A MODEL CIRCULATORY SY STEM FOR USE
IN UNDERGRADUATE PHY SIOLOGY LABORATORIES
Andrew M. Smith
Depa rtm ent of Biologica l Sciences, Butler University, India na polis, India na 46208
T
he cardiovascular system is a central topic in physiology classes, yet it is difficult to provide undergraduates with quality laboratory experiences in this area. Thus a model circulatory system was developed to give students hands-on experience with cardiovascular fluid dynamics. This model system can be constructed from readily available materials at a reasonable cost. It has a realistic pressure drop across the different vessels. Using this system, students can investigate the effect that blood volume, vessel compliance, vessel constriction, and heart activity have on blood pressure and flow. The system also demonstrates the effect of vessel diameter on resistance and fluid velocity. This model may give students a more concrete, intuitive feel for cardiovascular physiology. Another advantage is that it allows dramatic and easily controlled manipula-tions with quantitative results. Finally, its simple construction allows students to interchange components, giving them greater flexibility in experimentation.AM. J. PHYSIOL. 277 (ADV. PHYSIOL. EDUC. 22): S92–S99, 1999.
Key words:cardiovascular; teaching; fluid dynamics
Cardiovascular physiology includes a variety of con-cepts that students have difficulty grasping. Thus laboratory experiences have been designed to rein-force student learning of these topics. Medical and graduate schools often use animal labs, typically with anesthetized dogs. Such labs are rarely practical at the undergraduate level because of the cost of keeping animals and the requirement for surgical skill in the lab preparations. In addition, concern for animal well-being has led many instructors to reduce the number of vertebrate animals killed in their laborato-ries (5, 14). Fortunately, many circulatory phenomena can be modeled mathematically or mechanically. There are a variety of computer simulations of the circula-tory system (e.g., see Refs. 2, 10, 12, and 14). There are also quantitative exercises based on real data sets (e.g., see Refs. 3, 4, and 9). There are few mechanical models, however, despite several clear advantages to this approach (6, 11). Mechanical models allow stu-dents to perform hands-on experimentation with
actual systems. They also allow more dramatic and easily controlled experimental manipulations than are possible with animal systems. Thus a new mechanical model of a closed circulatory system was constructed for use in physiology teaching laboratories.
The model was designed with several goals in mind.1) It needed to be large enough for students to easily see and feel the effects of their manipulations. 2) It needed to depict accurately and quantitatively the major factors affecting flow through pipes. 3) It needed to have a flexible design to allow students to devise their own experiments. 4) It needed to be simple enough that it could be constructed easily and cheaply from readily available components.
cardiac activity. One can manipulate the vessel compli-ance to see how that affects the function of the venous reservoir and the arterial damping of pressure pulses. One can also investigate the physical principles
govern-ing the resistance of a system of vessels and the relationship between total cross-sectional area and fluid velocity. Finally, the model demonstrates the impor-tance of valves.
This paper provides guidelines for the construction and use of the model circulatory system. It includes a detailed list of parts, plans for their assembly, and the exact dimensions necessary to produce reasonable data. It also presents the results of a variety of experiments performed using the model. These experi-ments demonstrate the utility of the model in collect-ing quantitative data.
CONSTRUCTION OF SYSTEM: OVERVIEW
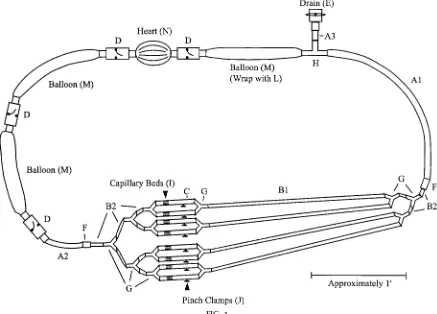
Figure 1 shows the construction plan. The system’s final size is roughly 10 ft in circumference, and it
FIG. 1.
Construction plan for model cir culatory system. Letters r efer to full part descriptions in Table 2. Short pieces of polyvinyl chloride (PVC) pipe (K) ar e glued into the valves (D and E) and ar e not labeled. Drawing is r oughly to scale.
TABLE 1 Featur es of the model
Variables that can be measured in the model Pressure
Average fluid velocity Cardiac output
Factors that can be controlled in the model Blood volume
Cardiac activity Vessel constriction
Vessel compliance and capacitance Number of capillary beds open Valve sufficiency
typically holds 2–3 liters of water. It has eight capillary beds, allowing the fluid to slow down as it spreads out into the greater total cross-sectional area.
For clarity, components are often referred to accord-ing to the part of the circulatory system they model. Thus, throughout this paper, terms such as artery, heart, and vein are used in reference to the system. Using these terms also makes the relation to real systems more concrete for students. This should not, however, imply that the components of the system exactly replicate the real components, only that they share the same function and some key features.
Almost all the equipment necessary to build the model was purchased from Aquaculture Supply (Dade City, FL). Other large aquarium suppliers would have this material as well. Polyvinyl chloride (PVC) pipes, pipe insulation, and balloons were purchased locally. Para-film lab Para-film and pressure transducers were purchased from scientific suppliers. The total cost of the system was approximately $160 (U.S.), not including devices for pressure measurement. Table 2 lists all the parts and their necessary dimensions. Dimensions are given in English units rather than SI, because that is how the components are sold in the United States.
Vessel dimensions were chosen to give realistic pres-sure drops through the system. Using Poiseuille’s equation, one can predict the resistance of each vessel in a closed system relative to the other vessels. This indicates the percentage of the total pressure drop that will occur across each vessel. From Poiseuille’s equation, one can show that the viscosity (
h
) of a fluid and the length (l) and radius (a) of a pipe affect the resistance (R) as follows (15)R58hl/pa4 (1)
For an array of pipes, one can add the resistance of each section of pipe in the same way as one would for an electrical circuit. In other words, for vessels in series, one adds the resistance of each vessel directly. For vessels in parallel, one adds the reciprocal of resistance of each vessel to give the reciprocal of total resistance of all vessels in parallel (15). The calcula-tion for parallel vessels can be simplified, because in this model the parallel vessels are identical. Thus one
can divide the resistance of one vessel of a parallel array by the total number of vessels in parallel to get the total resistance for that section. With these calcula-tions, the dimensions of the vessels were chosen so that 92% of the resistance (hence, pressure drop) would occur in the capillary beds, 7% in the arteries, and only 1% in the veins. Note that these calculations
TABLE 2
Equipment r equir ed to build the system
Supplier Equipment Quantity and Part
Aquarium PVC flap check valve,
slip seal, 1-in. fitting 4 (D)
PVC ball valve, slip seal, 1-in. fitting 1-in. foam pipe
insula-tion
1 ft (L)
Teflon tape, PVC cement
Miscellaneous Long party balloons (1 ft31.5 in. deflated)
3 (M)
assume steady, laminar flow in an unbranched pipe. Because these assumptions are not met, there will be some deviation from the predicted values.
The vessels are made of vinyl tubing and long bal-loons. The vinyl tubing is clear, allowing students to observe flow. Most of the tubing is heavy walled (1⁄
8-in.
wall thickness) rather than thin walled (1⁄
16-in. wall
thickness). The thin-walled tubing tends to flatten when bent, creating higher local resistance. Thin-walled tubes are only used for the vessels that contain the capillary beds. This allows them to be pinched to simulate arteriolar constriction.
Long balloons are used in place of vinyl tubing where distensibility is necessary. Party balloons that can inflate to 5 ft in length are used for the vessels. Such large balloons are necessary to handle the volume of fluid pumped without excessive increase in diameter. Unlike the vessels, the heart is made of a punching bag-style balloon. This type of balloon has heavier walls than normal balloons and is pleated. Most of the expansion comes in flattening out the pleats. This type of balloon handles high pressures well and does not develop bulges when squeezed. One difficulty with the balloons is that they deteriorate and may need to be replaced each semester, especially if they are left exposed to light.
Given the high pressures that the artery experiences, there must be a mechanism to prevent excessive swelling of this balloon. Unchecked, it develops a localized bulge, comparable to an aneurysm. Whereas demonstrating an aneurysm is instructive, it interferes with the normal function of the system; therefore, a sleeve of pipe insulation is placed around this balloon. The pipe insulation is a foam tube that is slit along its length so that it can be placed around a pipe without disconnecting the pipe. Thus it has a C-shaped cross section. When in place, the insulation allows the balloon to expand easily at first, but then it provides progressively more resistance to expansion.
Large PVC flap valves are used with the veins and heart. Short sections of PVC pipe connect these to the vessels, because the valve fittings are designed for PVC pipe. Unlike many other valves, this type of valve gives minimal resistance to flow. This keeps the pressure in
the veins low. Ideally, only a small fraction of the pressure drop should occur in the veins.
One important aspect of the venous system is its function as a volume reservoir. It must be able to accommodate pulses of blood while the heart is c ontrac ting. Thus the venous balloons are pre-stretched by being inflated once before use. The use of large-volume, highly distensible balloons assures that the veins can handle a full pulse with little increase in pressure. The same type of balloons are used for arteries, but they are not preinflated, so they are more resilient and contain a smaller volume at rest.
Water is added to or drained from the system through a side branch terminated by a ball valve. This is also used to remove excess air bubbles. It is useful to keep some small bubbles in the system, though. These give students a way to follow the flow and measure velocity.
Pressure can be measured using electronic transduc-ers (model BLPR, World Precision Instruments, Sara-sota, FL). The transducers can be connected to a bridge amplifier and a computer-based analog-to-digital data acquisition station. For laboratories that do not have access to chart recorders or computer-based data acquisition systems, it would be possible to use mechanical pressure gauges (such as a diaphragm pressure gauge; Fisher Scientific). Connecting such a gauge to the system would be slightly more compli-cated, though. In either case, the measurement de-vices are the most expensive components of the model; each typically costs around $100. Even with-out pressure transducers, the model effectively demon-strates many important principles. Indeed, the ability of students to feel the pressures and get a tactile, intuitive sense of the system’s response is one of the strengths of the model. Nevertheless, there is a significant advantage to be gained by allowing quanti-tative measurements.
ASSEMBLY INSTRUCTIONS
inserting them into a 7-in. length of thin-walled1⁄ 2-in.
tubing. The bundles of tubes fit snugly in the larger tube and are aligned and placed 2 in. from the venous end using a syringe plunger. This placement leaves over 3 in. for a screw clamp at the beginning of each bed.
Once the capillary beds are ready, connect the parts as shown in Fig. 1. Many of the connections use standard slip-on tubing connectors. To connect the balloons to the PVC pipe, slip the end of the balloon around the pipe and wrap it tightly with at least five layers of Parafilm (more for the high-pressure connections). This is sufficient to give a reliable seal. The only connection that does not seal well is where the3⁄
4-in.
tubing (A3 and A2) fits into the PVC pipe. To prevent leakage here, wrap the end of the tubing with Teflon tape before inserting it into the PVC, and then wrap the joint tightly with Parafilm. If leakage between the PVC and vinyl tubing is a concern, switch from 1-in. to
3⁄
4-in. valves at these points, and then use PVC slip
fitting-to-tubing adapters (3⁄
4in. to3⁄4in.) instead of PVC
pipe to connect the valves to the vessels. To add or remove any component, elevate that section so that water will not flow out when the connections are broken.
Pressure transducers can be inserted at a variety of points. Three convenient spots are immediately down-stream of the main arterial balloon, immediately up-stream of one of the capillary beds, and downup-stream of the capillary beds where they unite into one large vein. Wrap each spot with Parafilm, and then insert an 18-gauge needle with an attached stopcock. The Parafilm improves the seal around the needle, and the large needle size ensures that the needle transmits pressure changes with minimal damping. A trans-ducer can be connected to each needle via the stopcock. Alternatively, use just one transducer and move it from spot to spot, closing off the unoccupied needles with the stopcocks. In addition to the use of large needles, the response of the transducers is improved by carefully flushing all air bubbles from the transducer chamber (7).
RESULTS OF SAMPLE EXPERIMENTS
Sample data were collected to demonstrate the perfor-mance of the system. These experiments could also form the basis for a lab exercise. For these
measure-ments, normal operation was defined as when the system contained between 2 and 3 liters of water, there was no constriction of the vessels, and the pulse rate was approximately 40 beats/min. Each beat involved squeezing the heart smoothly until the experi-menter’s hand was fully clenched. Most of the pres-sures described were relative to the baseline when there was no flow. It should be noted that the baseline was actually several millimeters of mercury above ambient because of the stretch in the walls of the balloons. Thus the relative pressure readings can drop a few millimeters below zero.
The pressures measured using the system were reason-able, though low. Under most conditions, the arterial pressures were between 30 and 60 mmHg during systole and 10 to 30 mmHg during diastole. The factor that limited the pressure was the distensibility of the balloon representing the major artery. Without the foam insulation, a few sample balloons inflated easily at 25 mmHg and burst at 75 mmHg. Higher pressures could be achieved by decreasing the distensibility of this vessel. This would also lead to less damping of the pressure pulses, though, unless a greater length of flexible vessel was used.
across a branch relative to a straight section of the same length.
If one wanted more of the pressure drop to occur across the capillary beds, one could make the capillary tubes longer; doubling their length would double their resistance. Alternatively, one could use only four capillary beds instead of eight. This would also double the total resistance of the capillary beds, but the fluid would move twice as fast through the capillaries. Thus it would not demonstrate as effectively the decrease in velocity that occurs as total cross-sectional area in-creases.
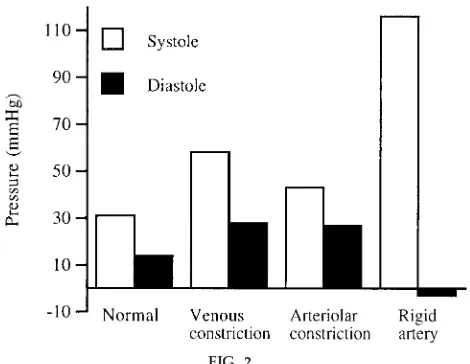
In addition to producing reasonable pressures and pressure drops, the system effectively demonstrated many of the factors that control blood pressure. For example, venous constriction was modeled by having a student apply pressure with the forearms to the venous balloons. Doing this greatly increased the venous return and made it possible to roughly double the systolic and diastolic pressures throughout the system (Fig. 2). Arteriolar constriction was modeled by tightening the screw clamps on the 1⁄
2-in. tubing
leading into the capillary beds. Pinching these fairly flat increased the mean arterial pressure 45% (Fig. 2). Obviously, in both cases, the exact magnitude of the pressure increase depended on the degree of constric-tion.
The system also effectively demonstrated the impor-tance of arterial flexibility. When the arterial balloon was wrapped tightly with a sheet of plastic so that it could not expand, the systolic pressure shot over 100 mmHg and the diastolic pressure dropped to nearly zero (Fig. 2). Thus the flow alternated between racing through the vessels and stopping abruptly. When the balloon was allowed to expand, it damped out these pressure oscillations and flow was correspondingly more continuous.
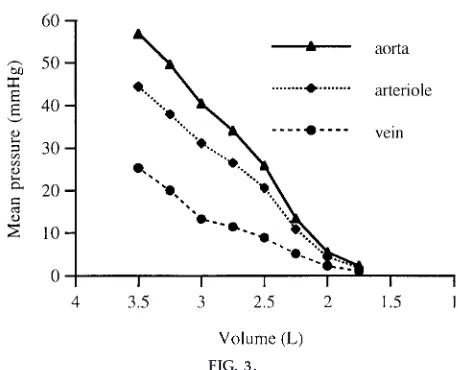
The blood volume could also be controlled in this system. To test the effect of blood volume on pres-sure, the system was filled with 3.5 liters of water. The pressures were then recorded under normal operating conditions for roughly 30-s intervals. Two hundred fifty milliliters of water were drained from the system between each interval. The baseline pressure was taken to be the pressure when the system was at rest at its lowest volume. As expected, the mean pressure decreased continuously with blood volume (Fig. 3). This decrease was caused by reduced stretching of the vessel walls and the consequent reduced venous return to the heart. Because venous resistance was minimal, the venous pressures primarily reflected the baseline pressures caused by passive stretching, which would not drive flow. The decreased baseline pres-sure, though, reduced cardiac filling and thus stroke volume. This reduced the pressure that drove flow, as was apparent from the reduced pressure drop be-tween each of the transducers. Thus the system effectively modeled circulatory shock. One could also manipulate the vessel constriction and heart rate to show the mechanisms by which the body compen-sates for shock.
In addition to pressure, one could study fluid velocity and flow in the system. For example, the fluid clearly slowed down as it branched into a larger number of vessels, because of their greater total cross-sectional area. By timing the progress of several different air bubbles, the average velocity in the four arterial branches was estimated to be roughly 55% of that in
FIG. 2.
Sample systolic and diastolic pr essur e measur ements under differ ent conditions. Pr essur es wer e measur ed at beginning of main3⁄4-in. artery. Venous constriction
the main artery, as predicted. One could also calculate the flow, thus cardiac output, by multiplying the average velocity by the total cross-sectional area at that point. In addition, monitoring the progress of the bubbles was useful in demonstrating shunting when some of the arterioles were constricted.
Finally, it should be possible to demonstrate the effect of gravity on the system. If the components could be clamped in place and the table tilted, one could measure this effect. This may be impractical, however. Not only would the size of the model be problematic but also the venous balloons may swell too much.
DISCUSSION
This model gives reasonable pressure values and makes many important principles of circulatory sys-tem design concrete and immediately obvious. A primary strength of the model is the ease with which one can manipulate variables and collect quantitative data. Because a number of factors can be manipulated, the results are often complex, and there is consider-able room for experimentation.
The model described in this paper differs from previ-ous models in several ways. It lacks the precise
mechanical control of the pump that they feature, but it has several significant advantages. One is that the dimensions of the vessels give a realistic pressure drop through the system. Thus beds of capillary tubes create the peripheral resistance rather than a single arbitrary constriction. The other parts of the system are also more similar to anatomic structures and derive their effect on flow in the same way. Thus it should be easier for students to relate their experience with the model to real systems. The other primary difference from previous models is the simplicity of construction and the detailed plans provided. This should encourage many teachers to build copies of this model, even those with little experience either in building models or with cardiovascular physiology. The instructor could even have students devote a lab period to assembling the model from precut pieces and then spend subsequent labs experimenting with it. The process of construction would familiarize them with the system and make them comfortable with modifying it. The instructor could also provide a variety of pieces with different dimensions for the students to experiment with. As an example of the model’s accessibility, one student group in a recent semester designed and added a pulmonary circuit to the model as one of their independent projects.
Although this paper describes parts of the model using anatomic terms, students should be reminded that the model only approximates real structures. It highlights principles in an intuitively clear way, but real systems are more complex. The model makes predictions about the way a real system would behave under certain circumstances. Students can then look up published data to determine whether these predic-tions are correct. If they are, then the mechanics of the model may accurately reflect the real system. When they differ quantitatively or qualitatively from real data, though, students can analyze the results and determine the reason for this difference. Engaging in this process is highly instructive, and students will likely learn more than if the results did match.
This model can be used in a variety of contexts. Its flexibility and simplicity suit it particularly well for independent projects. During such projects, students learn during the planning, execution, and analysis of experiments. These types of experiments stimulate critical thinking and typically increase student
motiva-FIG. 3.
Effect of fluid volume on mean pr essur es r ecor ded in system. Pr essur e was r ecor ded at beginning of main
3⁄4-in. artery, several inches in fr ont of the capillary
tion (1, 8, 13, 16). The model is also highly effective in demonstrations. It is large enough to use in a lecture setting with a small class. Finally, the model can be used in traditional, guided laboratory experiments. One can develop a handout to guide students through the manipulations described in this paper. The main drawback to this is the need to construct sufficient models to accommodate a full class. Given the size of the model, this may not be practical. Alternatively, the model can be used in self-guided laboratories where the students do the experiments at their convenience.
A version of this model has been used successfully for three semesters at Butler University. The student response has been enthusiastic in demonstrations. During the first two semesters, though, it was not used extensively in the independent projects, possibly because the students were uncertain about how to use it for detailed experimentation. Thus a handout similar to Table 1 was developed, describing the factors that could be manipulated. The incorporation of this handout increased the number of groups doing projects on the system to a level comparable to the other major systems studied (for example, muscles, nerves, or metabolic rate).
In summary, this model has the potential to be an excellent teaching tool. It is large and easy to handle so that students can get an intuitive feel for the factors that affect blood flow. It provides realistic, quantita-tive data. Its design allows for a variety of experimen-tal modifications. Finally, it can be constructed from readily attainable parts at a reasonable cost. Because of its utility, the development of this model significantly broadens the type of experimentation that is possible in a typical physiology lab.
I thank V. Van Drake and H. McDonald for suggesting some improvements to the model.
This work was supported in part by National Science Foundation Instrumentation and Laboratory Improvement Grant DUE-9650721.
Address for reprint requests and other correspondence: A. M. Smith, Dept. of Biological Sciences, Butler Univ., Indianapolis, IN 46208 (E-mail: [email protected]).
Received 25 November 1998; accepted in final form 2 September 1999.
Refer ences
1. American Association for the Advancement of Science.
The Libera l Art of Science: Agenda for Action. Washington, DC: Am. Assoc. Adv. Sci., publication 90-13S, 1990.
2. Campbell, K., M. Zeglen, T. Kagehir o, and H. Rigas. A pulsatile cardiovascular computer model for teaching heart-blood vessel interaction.Physiologist25: 155–162, 1982. 3. Chandler, M. P., and S. E. DiCarlo.An educational tool for
understanding the cardiopulmonary changes associated with aging.Am . J. Physiol. 267 (Adv. Physiol. Educ. 12): S17–S36, 1994.
4. Collins, H. L., and S. E. DiCarlo. An educational tool for understanding the cardiovascular changes associated with dia-betes. Am . J. Physiol. 269 (Adv. Physiol. Educ. 14): S4–S31, 1995.
5. Fawver, A. L., C. E. Branch, L. Tr entham, B. T. Robertson, and S. D. Beckett. A comparison of interactive videodisc instruction with live animal laboratories. Am . J. Physiol. 259 (Adv. Physiol. Educ. 4): S11–S14, 1990.
6. Fischer, T. M., and H. Schmid-Scho¨nbein. A circulation model for teaching fluid dynamics in laboratory courses in physiology.Med. Educ.21: 391–398, 1987.
7. Gabe, I. T.Pressure measurement in experimental physiology. In: Ca rdiova scula r Fluid Dyna m ics, edited by D. H. Bergel. London: Academic, 1972, p. 11–50.
8. Ortez, R. A. Investigative research in nonmajor freshman biology classes.J. Coll. Sci. Tea ching23: 296–300, 1994. 9. Patil, R. D., S. V. Karve, and S. E. DiCarlo. Integrated
cardiovascular physiology: a laboratory exercise.Am . J. Physiol. 265 (Adv. Physiol. Educ. 10): S20–S31, 1993.
10. Peterson, N. S., K. B. Campbell, R. H. Hopkins, and S. A. Feiner.An integrated cardiovascular teaching laboratory. Physi-ologist28: 447–448, 1985.
11. Rothe, C. F., and E. E. Selkurt.A model of the cardiovascular system for effective teaching. J. Appl. Physiol. 17: 156–158, 1962.
12. Rovick, A. A., and L. Br enner. Heartsim: a cardiovascular simulation with didactic feedback.Physiologist26: 236–239, 1983.
13. Ruther for d, F. J., and A. Ahlgr en.Science for All Am erica ns. New York: Oxford Univ. Press, 1990.
14. Samsel, R. W., G. A. Schmidt, J. B. Hall, L. D. H. Wood, S. G. Shr off, and P. T. Schumacker. Cardiovascular physiology teaching: computer simulations vs. animal demonstrations. Am . J. Physiol. 266 (Adv. Physiol. Educ. 11): S36–S46, 1994. 15. Vogel, S.Life in Moving Fluids: The Physica l Biology of Flow.
Princeton: Princeton Univ. Press, 1981.