Estimation of the impact of fertilisation rate on nitrate leaching in
Finland using a mathematical simulation model
Kirsti Granlund
∗, Seppo Rekolainen, Juha Grönroos, Antero Nikander, Yki Laine
Finnish Environment Institute, P.O.Box 140, FIN-00251 Helsinki, FinlandReceived 28 December 1998; received in revised form 24 August 1999; accepted 14 December 1999
Abstract
Agriculture comprises the largest single source of nitrogen (N) into watercourses in Finland. The emphasis of water protection policy is today on controlling the non-point nutrient losses from agriculture. In this study a mathematical simulation model was used as a management tool to estimate the changes in nitrate (NO3−-N) leaching resulting from changes in
cultivation practices in Finnish agriculture caused by the Agri-Environmental Support Scheme as a part of the Common Agricultural Policy of the European Union. Detailed data were collected from about 400 farms by interviewing farmers in four study areas in different parts of the country. The potential impacts of these changes on nitrate losses were then assessed by a deterministic nitrogen leaching model and regional assessments were made by combining the results of model calculations with digital spatial data about soils, crops and fertilisation, using GIS-software. In general, the use of nitrogen fertilisers (inorganic fertilisers and manure) has decreased to meet the requirements of the Support Scheme. However, the estimated potential impacts on nitrate losses were rather small (3–14% in different study areas). The model results showed that to achieve the targeted national and international reductions in agricultural nitrate leaching, fertilisation and particularly manure spreading should be reduced and adjusted better to the actual nitrogen requirements of crops. © 2000 Elsevier Science B.V. All rights reserved.
Keywords: Agriculture; Nitrogen; Fertilisation; Manure; Modelling
1. Introduction
In Finland, modern intensive and concentrated agri-culture comprises the largest single nitrogen source to surface waters. Today, the estimated total nitrogen load from agricultural land in Finland is 20 000–40 000 Mg per year, and the phosphorus load is 2000–4000 Mg per year. Due to several mild and rainy winters in the late 1980s and early 1990s, the nitrogen load increased
∗Corresponding author. Tel.:+358-9-40300243; fax:+358-9-40300290.
E-mail address: [email protected] (K. Granlund)
distinctly in southern Finland (Kallio, 1995; Reko-lainen et al., 1995). A model-based regional analysis of erosion and nitrate losses from agricultural land in the Nordic countries (Rekolainen and Leek, 1996) showed that in Finland the risk of nitrate leaching was somewhat higher than in Sweden but consider-ably lower than in Denmark and some parts of Nor-way. The analysis reflected the different agricultural practices in the Nordic countries, especially the fer-tilisation rates, and differences in climatic conditions. In Finland, nutrient loads have caused eutrophication of surface waters, and contamination of groundwaters by nitrates has been detected in areas where cultivated
fields or intensive livestock production and fur farms are located adjacent to groundwater formation areas.
Dissolved reactive phosphorus, being totally bioavailable, has been considered to be of crucial im-portance in controlling the eutrophication of surface waters in Finland. In recent years, however, the role of nitrogen as a limiting factor in primary production in lakes and rivers has become more clear. Pietiläi-nen (1997) carried out a comprehensive survey of nutrient status in Finnish lakes and rivers, based on the ratio of dissolved inorganic nitrogen to dissolved inorganic phosphorus. The results showed that 27% of the lakes and 25% of the rivers were nitrogen lim-ited. Furthermore, nitrogen is the limiting factor for algal growth in the Baltic Sea during the major part of the year (Granéli et al., 1990; Kivi et al., 1993). As Finnish agriculture is concentrated in coastal areas or in river valleys discharging to the Baltic Sea, the need to reduce nitrogen losses is greatest in these areas (Valpasvuo-Jaatinen et al., 1997).
According to a Decision-in-Principle by the Finnish government in 1998 (Ministry of the Environment, 1998), nitrogen loading from agriculture should be re-duced by 50% from the level in the beginning of the 1990s by 2005. Additionally, international agreements within the HELCOM framework aim at similar reduc-tions in nitrogen loads to the Baltic Sea (HELCOM, 1994).
In order to reduce the agricultural nutrient losses, the Finnish Agri-Environmental Support Scheme was implemented when Finland joined the European Union in 1995, in keeping with Common Agriculture Policy (EEC, 1992). The goal of the Scheme is to en-sure the development of agricultural practices towards higher sustainability. In a priori assessments it has been estimated that a 25–40% reduction in nutrient losses may be achieved by full implementation of the Scheme (Valpasvuo-Jaatinen et al., 1997). Accord-ing to this programme farmers are paid for adoptAccord-ing environmentally sound management practices. A de-tailed description of the programme was presented by Valpasvuo-Jaatinen et al. (1997). In 1998, more than 90% of Finnish farmers participated in the pro-gramme. During the first 3 years (1995–1997) of the programme, its implementation and changes in agri-cultural practices have been monitored by interview-ing farmers in four study areas in Finland (Grönroos et al., 1998).
A monitoring network of water quality is needed to evaluate the actual impacts of altered practices. How-ever, due to slow responses of water quality to changes in practices and high fluctuations in annual nutrient losses caused by meteorological variation, monitoring programmes cannot detect changes occurring within short time periods. The objective of this study was to assess the potential impacts of changes in cultivation practices on nitrate leaching in the study areas by using a mathematical simulation model. The SOIL-N nitrogen model (Johnsson et al., 1987) was used as a tool to estimate the potential changes in nitrate losses on the basis of information about crops, soils, fertilisa-tion rates and management practices. This paper gives an overview of the regional changes in nitrogen fer-tilisation rate resulting from the Agri-Environmental Support Scheme and presents the calculated potential changes in nitrate leaching caused by changes in fertilisation rate.
2. Materials and methods
2.1. Data collection
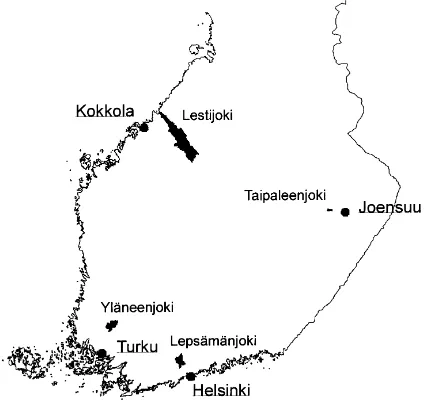
Fig. 1. Location of the Lepsämänjoki, Yläneenjoki, Taipaleenjoki and Lestijoki study areas.
amount of animals expressed as livestock units in each study area are presented in Table 1. According to the Support Scheme 1 ha per 1.5 livestock units is needed for manure application. For cattle, the livestock units vary from 0.18 to 1, for pigs from 0.14 to 0.5 and for poultry from 0.0028 to 0.011. The total number of livestock units for cattle is highest in Lestijoki. In Yläneenjoki the number of pigs and poultry in terms of livestock units is much higher than that of cattle.
The interview was conducted twice: in 1996 cov-ering the years 1994 and 1995, and in 1998 covcov-ering the years 1996 and 1997. The years 1994 and 1995 represent agricultural practice before adopting the Agri-Environmental Support Scheme. The interview was concentrated on those practices to which the Scheme sets restrictions or limits. The monitored variables were: fertilisation, storage and spreading of
Table 1
The proportion of livestock farms of all farms and total number of livestock units in the study areas in 1997
Area Livestock farms (per cent of all farms) Total number of livestock units
Cattle Pigs Poultry Cattle Pigs Poultry
Lepsämänjoki 17 3 – 337 118 7
Yläneenjoki 19 15 15 631 1062 1347
Taipaleenjoki 66 – – 612 – –
Lestijoki 75 2 – 1565 67 –
Fig. 2. Distribution of soil types in the study areas (per cent of cultivated area).
manure, winter green coverage, animal density, use of pesticides, soil tillage methods, management of set-aside and filter strips, and management of silage effluents. The main interest in this study was to eval-uate the potential impacts of changes in nitrogen fertilisation rates and manure application.
2.2. Modelling
assumed that the model is applicable to conditions of the present study.
Mean nitrate leaching (kg ha−1per year) was
calcu-lated for different crops and soils in four study areas in different parts of the country. For each combina-tion, 10-year weather records were used to calculate the mean annual leaching value in order to eliminate annual variations caused by climatic fluctuations. In order to make regional assessments, the results of these model calculations were combined with digital spatial data about soils, crops and fertilisation using GIS-software.
2.2.1. Description of the model
The model is applied in two phases. First, the soil water content and heat conditions are calculated with a one-dimensional water and heat model (SOIL, Jans-son and Halldin, 1979) for each soil layer. The results are then used as driving variables in a nitrogen model (SOIL-N, Johnsson et al., 1987) for calculation of ni-trate leaching from the soil profile.
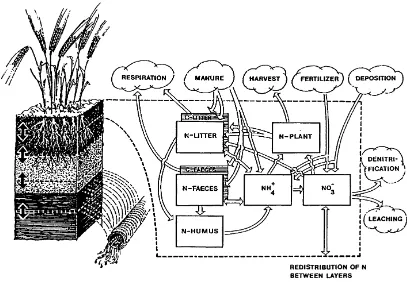
Fig. 3. Structure of the SOIL-N nitrogen model showing state variables (boxes) and flows (arrows). The structure is replicated for each soil layer (Johnsson et al., 1987).
The SOIL model has a one-dimensional vertical structure, with the profile divided into layers ac-cording to site-specific physical and biological soil properties. The model is based on two coupled partial differential equations describing heat and water dy-namics in a soil profile (derived from Fourier’s and Darcy’s laws, respectively). Snow dynamics, frost, evapotranspiration, infiltration, surface runoff and drainage flows are included. Using meteorological data as input, the model predicts the driving variables for the SOIL-N model (i.e., daily values of surface runoff and infiltration, water flow between soil layers and flow to drainage tiles and to deeper groundwater, unfrozen soil water content and soil temperature) in different soil layers. Information about soil character-istics, such as pF-curves and hydraulic conductivities is needed as input data, as well as parameters related to the calculation of evapotranspiration.
Inor-ganic fertiliser, manure and atmospheric deposition are inputs to the uppermost soil layer. Losses through denitrification and leaching of nitrate to drainage tiles can occur from each soil layer. Nitrate in solution can be transported between soil layers or to drainage tiles. Inorganic and organic nitrogen pools are replicated for each soil layer. Mineral nitrogen pools include ammonium and nitrate. Organic nitrogen pools are lit-ter, manure-derived faeces and humus. Carbon pools for litter and faeces are included for controlling ni-trogen mineralisation and immobilisation rates. The litter component includes undecomposed material, whereas stabilised decomposition products make up the humus component. The single plant component includes nitrogen in both above- and below-ground biomass. Root distribution within the soil profile is also taken into account. Ammonium is considered to be immobile in the soil profile.
Mineralisation of humus nitrogen is calculated as a first-order rate process controlled by a specific min-eralisation constant and response functions for soil temperature and moisture. Decomposition of the litter and faeces carbon pools is calculated in the same way. The net mineralisation of litter nitrogen is determined by the balance between the release of nitrogen during decomposition and the nitrogen immobilised during microbial synthesis and humification. Mineralisation of faeces is handled in the same way. Plant uptake of nitrogen is calculated using a simple time-dependent empirical function requiring parameter values specific for the crop and site considered. Total crop nitrogen uptake is used as input for the simulations, and can be measured or estimated from harvest yield. The total uptake is distributed as N uptake from the soil during the whole growing season. At harvest and ploughing the roots and harvest residues are incorporated into the soil litter pool. Denitrification is calculated as a first order rate process controlled by potential rate and response functions accounting for the effects of soil temperature, soil oxygen status and soil nitrate content.
2.2.2. Input data and parametrisation of the model
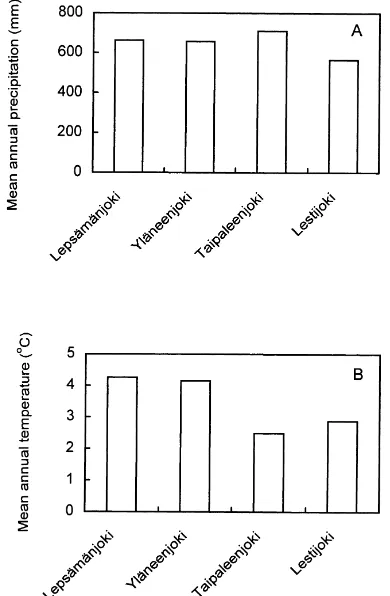
The nitrate leaching was simulated for a 10-year period (1981–1990) using meteorological data sepa-rately for each of the four study areas. The daily values of temperature, humidity, wind speed, precipitation and cloudiness measured at weather stations located within the study areas were used as input driving
vari-Fig. 4. Mean annual precipitation (a) and temperature (b) in the study areas (1981–1990).
ables to the model. The mean annual precipitation and temperature in the study areas are shown in Fig. 4.
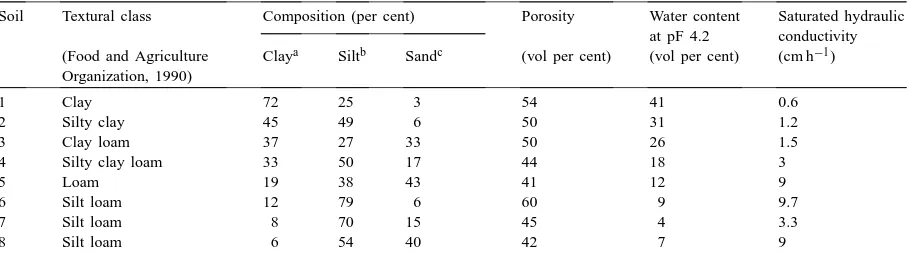
Nitrate leaching was calculated for eight texturally most common soil types in the study areas. The tex-tures of the soils varied from clay to silt loam. The water retention characteristics estimated for each sim-ulated soil were considered to represent typical soils falling into these eight classes. The particle size dis-tribution and physical characteristics of the soils are shown in Table 2. The soil profiles were divided into five layers (4×0.25 m and 1 m) down to a depth of 2 m, where free drainage was assumed. The physical soil characteristics were assumed to be uniform for the whole profile. For all soils the organic matter content was set to a constant value of 30 g kg−1in the topsoil
and 3 g kg−1beneath the topsoil, which is slightly less
Table 2
Textural composition and physical characteristics of the soils used in the simulations
Soil Textural class Composition (per cent) Porosity Water content Saturated hydraulic at pF 4.2 conductivity
Estimation of hydrological parameters was based on information on soil textures collected from farmers. The calculation of unsaturated hydraulic conductivity and water retention characteristics was based on the methods described by Mualem (1976) and Brooks and Corey (1964). Soil water content and soil temperature were calculated for each soil and area for six differ-ent crop groups. Rape (Brassica rapa oleifera (DC.) Metzg.) and spring cereals (barley, Hordeum vulgare L. and spring wheat, Triticum aestivum L.) were assumed to have similar properties regarding evapo-transpiration. One common set of parameters was also used to simulate the water balance of the winter cere-als (winter rye, Secale cereale L. and winter wheat). Separate parameter sets were developed for sugarbeet (Beta vulgaris var. altissima Döll), potato (Solanum
tuberosum L.), silage and hay (e.g., Timothy, Phleum pratense L.). Despite the fact that the same species are
cultivated for silage and hay, different sets of param-eters were used for these crops because their manage-ment differs in terms of harvesting times. The length of the growth period for each crop was kept equal for the two southern (Lepsämänjoki and Yläneenjoki) and the two northern areas (Taipaleenjoki and Lestijoki).
Estimation of parameters related to the nitrogen cy-cle was mainly based on previous applications of the model (e.g., Johnsson et al., 1987; Borg et al., 1990; Johnsson, 1990; Rekolainen and Leek, 1996; Kallio et al., 1997). The values of potential crop nitrogen up-take were given as input values. These values were based on information on average yields in the study
Table 3
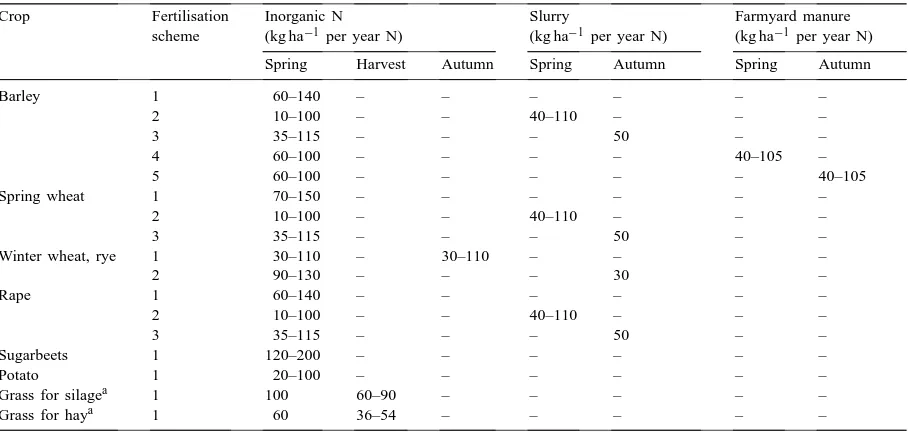
The amounts of inorganic and organic nitrogen fertilisers (as soluble N) for different crops used as input data in the model calculations
Crop Fertilisation Inorganic N Slurry Farmyard manure
scheme (kg ha−1 per year N) (kg ha−1 per year N) (kg ha−1 per year N)
Spring Harvest Autumn Spring Autumn Spring Autumn
Barley 1 60–140 – – – – – –
2 10–100 – – 40–110 – – –
3 35–115 – – – 50 – –
4 60–100 – – – – 40–105 –
5 60–100 – – – – – 40–105
Spring wheat 1 70–150 – – – – – –
2 10–100 – – 40–110 – – –
3 35–115 – – – 50 – –
Winter wheat, rye 1 30–110 – 30–110 – – – –
2 90–130 – – – 30 – –
Rape 1 60–140 – – – – – –
2 10–100 – – 40–110 – – –
3 35–115 – – – 50 – –
Sugarbeets 1 120–200 – – – – – –
Potato 1 20–100 – – – – – –
Grass for silagea 1 100 60–90 – – – – –
Grass for haya 1 60 36–54 – – – – –
aAfter the first harvest.
rape. A simplified three phase fertilisation scheme was applied for perennial silage and hay. When es-tablishing the grass in autumn (first year), a constant amount of slurry was applied. Inorganic fertiliser was applied twice: first in spring, and then in summer af-ter the first harvest. No fertiliser was applied afaf-ter the second harvest. The amount of inorganic fertilisers varied depending on crop type and time of appli-cation between 10 and 200 kg ha−1 per year N, and
that of manure between 20 and 60 m3ha−1 per year,
producing 40–110 kg ha−1per year of soluble N.
The range of fertilisation rates chosen for each crop was based on crop-specific information on actual use of fertilisers in the study areas. Averaged values for manure application rates and nitrogen storages in ma-nure were used as input. The estimation of nitrogen content in different fractions of manure (soluble N, organic N and N in bedding) was based on litterature (e.g., Kemira Agro Oy, 1997). The nitrogen content of precipitation and dry deposition were kept constant for all areas (1 mg l−1and 0.001 g m−2per day N,
respec-tively). The estimation of these values was based on air quality measurements carried out by the Finnish Me-teorological Institute (Leinonen, 1996) and on model calculations by EMEP Long-Range Transport (LRT) models (Tuovinen et al., 1990).
Instead of loss prediction in absolute terms, in-formation on relative differences of losses is useful in decision-making. Taking this into account, it was considered that earlier model validations in similar environmental conditions could provide justification for the use of the model for this purpose (see e.g., Johnsson et al., 1987; Borg et al., 1990; Bergström and Jarvis, 1991). In addition, general information on nitrate losses in Finland and Sweden was collected and used for evaluating the model results. The cal-culated nitrate losses were compared with reported measured nitrate losses for several cropping systems (Jaakkola, 1984; Yläranta et al., 1993), for several soil types (Yläranta et al., 1993), for different fertilisation rates (Jaakkola, 1984) and for different manure appli-cation schemes (Niinioja, 1993; Kemppainen, 1995). Generally, the model results were in agreement with these observed loss estimates. Comparison of model results with measured data is discussed in Section 4.
2.3. Upscaling
The spatial database contained the corner coordi-nates and the soil type and management data for the field parcels. To calculate the regional losses and their changes, the loss estimates for each field parcel were summed up separately for all farms in the four study areas for the years 1995 and 1997. Average regional nitrate leaching (in kg ha−1 per year) was
then calculated for both years and for all the study areas.
3. Results
3.1. Changes in actual fertiliser use
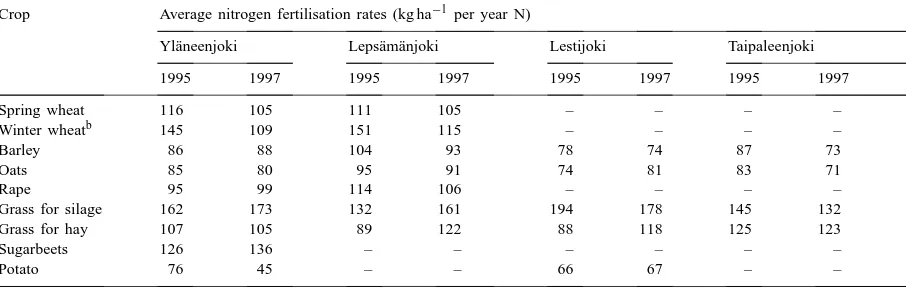
The Agri-Environmental Support Scheme sets crop-specific limits for the use of nitrogen fertilisers (Table 4). According to the interview data, a general reduction in the fertilisation rates to meet these limits has taken place in all the study areas (Table 5). For ce-reals, the greatest reductions were observed for winter wheat in the southern areas (ca. 25%). The amount of fertiliser applied for grass showed a slight increase in Lepsämänjoki and Lestijoki. In Lestijoki, this was due to an increase in slurry application. For the other crops the reductions in fertiliser use were modest, but in general the reductions during these years continue the general decreasing trends in the use of nitrogen fertilisers during the 1990s (Pirttijärvi, 1998).
Table 5
Average crop-specific nitrogen fertilisation rates in the study areas in 1995 and 1997 based on interviews with farmersa
Crop Average nitrogen fertilisation rates (kg ha−1 per year N)
Yläneenjoki Lepsämänjoki Lestijoki Taipaleenjoki
1995 1997 1995 1997 1995 1997 1995 1997
Spring wheat 116 105 111 105 – – – –
Winter wheatb 145 109 151 115 – – – –
Barley 86 88 104 93 78 74 87 73
Oats 85 80 95 91 74 81 83 71
Rape 95 99 114 106 – – – –
Grass for silage 162 173 132 161 194 178 145 132
Grass for hay 107 105 89 122 88 118 125 123
Sugarbeets 126 136 – – – – – –
Potato 76 45 – – 66 67 – –
aBlank entries in column indicate few or no observations.
bFor winter wheat, the periods 1994–1995 and 1996–1997 are included. Table 4
The crop-specific nitrogen fertilisation rates set by the Finnish Agri-Environmental Support Scheme (modified from the Ministry of Agriculture and Forestry, 1995)
Crop Nitrogen fertilisation
(kg ha−1 per year N)
Fodder cereal 90
Spring wheat 100
Winter wheat, autumn application 20 Winter wheat, spring application 100 Winter rye, autumn application 20 Winter rye, spring application 100
Oilseed crops 100
Sugarbeet 120
Potato 60–80
Silage 180
Hay 90 (+60a)
aIn case of second harvest.
3.2. Calculated nitrate losses
The mean annual nitrate losses were calculated on the basis of the 10-year daily output of the model runs. In this calculation, the inter-annual variation caused by fluctuating climatic conditions could mostly be ig-nored. The results represent potential long-term nitrate losses and their changes, assuming that cultivation is continued for a long period according to current man-agement practices.
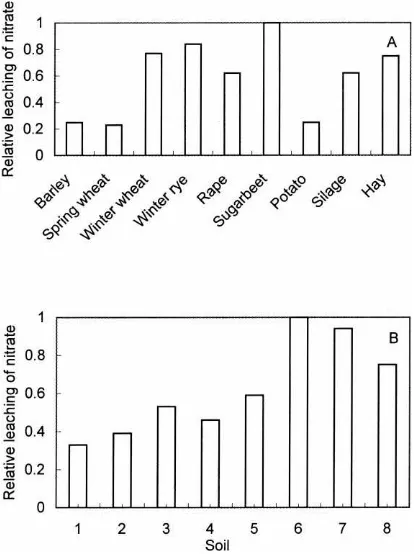
Fig. 5. Relative calculated leaching of nitrate from silty clay (Soil 2, Table 2) in the Yläneenjoki study area cultivated with different crops with fertilisation rates according to the Finnish Agri-Environmental Support Scheme (a). Relative calculated leach-ing of nitrate from barley fields in different soils in the Yläneen-joki study area (fertilisation 100 kg ha−1 per year N) (b). The value 1 represents the maximum nitrate leached. See Table 2 for a description of the soil types.
The highest amounts of nitrate were in most cases leached from winter cereals and sugarbeet. In the case of winter cereals this was mainly caused by autumn application of either inorganic or organic fertiliser. The reason for high nitrate leaching in the case of sugar-beet cultivation was the high use of nitrogen fertiliser (120–200 kg ha−1per year N). The calculated leaching
of nitrate was strongly dependent on soil type (Fig. 5). Leaching was usually highest in silt loam soils (Soils 6–8, see Table 2) and lowest in clay soil (Soil 1, see Table 2). The differences were mainly due to differ-ent water retdiffer-ention characteristics and thermal condi-tions, which affect water flow and mineralisation and denitrification rates.
No substantial differences were found in crop-specific nitrate leaching between Lepsämänjoki,
Fig. 6. Relative calculated leaching of nitrate from barley, potato and winter rye fields in different study areas (mean of all soil types with fertilisation rates according to the Finnish Agri-Environmental Support Scheme). The value 1 represents the maximum nitrate leached.
Yläneenjoki and Taipaleenjoki. In Lestijoki, however, the precipitation (Fig. 4) and thus the water flow from the bottom of the soil profile was lower than in the other areas. This caused lower nitrate leaching values in Lestijoki than in the other areas (Fig. 6), because in the model the calculated nitrate leaching is governed by deep percolation.
Differences in nitrate leaching were substantial for different fertilisation rates (Fig. 7). The relationships between the calculated leaching and fertilisation rates were non-linear for many crop-soil combinations, showing exponential features. The calculated
Fig. 8. Relative calculated leaching of nitrate from barley fields in different study areas in silty clay (Soil 2, Table 2). Spring fer-tilisation: inorganic fertiliser 140 kg ha−1 per year N or a combi-nation of inorganic fertiliser (100 kg ha−1 per year N) and slurry (40 kg ha−1 per year soluble N). The value 1 represents the max-imum nitrate leached.
ing values were higher if manure was used in addition to inorganic fertiliser compared to the case with pure inorganic fertilisation, even if the total amounts of applied soluble nitrogen were equal (Fig. 8). This is due to the fact that in addition to the soluble inor-ganic nitrogen, manure also contains orinor-ganic fractions which in the long run can be mineralised in the soil. Manure application in autumn resulted in higher ni-trate leaching than after spring application, but both leachings were higher than that caused by only inor-ganic fertilisation (Fig. 9). The reason for high nitrate leaching after autumn manure application is that in autumn the uptake of nitrogen by plants has ceased, and drainage of water increases. Moreover, minerali-sation of organic nitrogen may continue during early autumn. Nitrate leaching increased in all areas if fer-tilisation rates exceeded the rates set by the Support Scheme. This can be seen in Fig. 10, which shows calculated relative leaching from barley in all areas for two different fertilisation rates (inorganic fertiliser 100 and 140 kg ha−1per year N, silty clay).
3.3. Regional changes
The calculated average nitrate losses were higher in Lestijoki and Taipaleenjoki than in the southern areas (Table 6). The main reason for this was the clear dif-ference in the production structure between the two
Fig. 9. Relative calculated leaching of nitrate from barley fields in the Yläneenjoki study area in silty clay and silt loam (Soils 2 and 7, Table 2) with different fertilisation schemes. Fert. 1=inorganic fertiliser 140 kg ha−1 per year N in spring. Fert. 2=inorganic fertiliser (100 kg ha−1per year N) in spring+slurry (40 kg ha−1per year soluble N) in spring. Fert. 3=inorganic fertiliser (95 kg ha−1 per year N) in spring+slurry (50 kg ha−1 per year soluble N) in autumn. The value 1 represents the maximum nitrate leached.
Fig. 10. Relative calculated leaching of nitrate from barley fields in different study areas for two different rates of inorganic fertiliser in silty clay (Soil 2, Table 2). The value 1 represents the maximum nitrate leached.
Table 6
Relative calculated nitrate losses in 1997 (the value 1 representing the maximum nitrate leached) and changes in these losses between 1995 and 1997 in the study areas
Area Relative nitrate loss
1997 Change 1995–1997 (per cent)
Lepsämänjoki 0.3 −14
Yläneenjoki 0.39 −7
Taipaleenjoki 1 −6
areas: dairy production and thus grass cultivation dom-inate in the northern areas, whereas cereal production is more common in the southern areas. Clay soils dom-inate in the southern areas, whereas more permeable soils are common in the northern areas. This is also one reason for higher losses in the northern areas. The nitrate loss was estimated to have decreased to some extent in all the study areas, although the changes were rather small (3–14%, Table 6).
4. Discussion
The purpose of using a deterministic simulation model in this study was to assess relative changes in nitrate losses caused by changes in management prac-tices, in order to provide rapid feed-back information for decision-making. Validation of the model against observed time series over a wide range of soils, crops and management practices was impossible, e.g., due to the lack of measured data. More field data is needed to improve the model parametrisation of crop growth in Finnish conditions and to evaluate model results es-pecially in the case of manure application.
The results from these model calculations are not readily comparable to actual field (or lysimeter) mea-surements on N leaching. This is due, e.g., to the fact, that the modelled profile and the standard management practices were rather simple because of computational restrictions. Moreover, the history of the experimental fields provides site-specific initial values of mineral N in the soil, and crop rotation is often a factor in such studies. In the model runs a standard set of initial val-ues was used, and in order to be able to compare the long-term leaching values of different crops and soils, no crop rotation was envolved. However, in the next the results of model calculations are compared with existing field data on N leaching in case studies where similar crops and soils were used.
Yläranta et al. (1993) have studied leaching of ni-trogen from fallow, barley and grass ley in different soils in a 4-year lysimeter experiment in Jokioinen, southern Finland. The leaching of total nitrogen (of which nitrate-N was predominant) from barley was approximately 20 kg ha−1 for the 4 years period in
clay soil and approximately 115 kg ha−1in sand soil.
In this study the amount of inorganic nitrogen fertiliser was 100 kg ha−1 per year N. The modelled nitrate
leaching for barley in Yläneenjoki was of the same order and was higher in sandy soils than in clay soils. Field experiments in Finland and in Sweden (e.g., Jaakkola, 1984; Bergström and Jarvis, 1991) have shown that leaching losses from cereals are rather small if recommended, moderate amounts of inor-ganic fertilisers are used. Bergström and Jarvis (1991) used the SOIL/SOIL-N model to predict nitrate leach-ing from arable clay soil at application rates of 0, 100 and 200 kg ha−1 per year N in south-west
Swe-den. The long-term mean yearly leaching losses at different nitrogen application rates were reasonably well estimated by the model. Leaching losses were rather small in the treatment with 100 kg ha−1 per
year N, but doubling the applied fertiliser rate to 200 kg ha−1 per year N increased the leaching from
6.6 to 43.1 kg ha−1 per year N. The interview data
of the present study indicated that, in some cases, farmers actually have applied higher rates than the recommended ones on their fields. This was taken into account in the model calculations, and higher input values of N were tested in order to evaluate the risk of leaching in these cases. The calculated leaching values increased if fertilisation exceeded the recommended rates.
According to model results a situation where slurry is applied in autumn in addition to inorganic spring fer-tiliser causes the highest leaching values. The effect of spreading time on N leaching was also clearly demon-strated in a lysimeter trial by Kemppainen (1995). The effects of soil type, spreading time and use of a nitrifi-cation inhibitor on the leaching and uptake of nitrogen and phosphorus from cow slurry and fox manure were studied in lysimeters in northern Finland. Nitrogen leaching from barley was lowest with spring applica-tion and highest with applicaapplica-tions in September.
to observations of nitrate concentrations and fluxes at the outlets of the basins. This allows only the use of relative differences instead of absolute values.
The calculated regional reductions in nitrate loss (see Table 6) were mainly caused by reductions in fer-tilisation rates (see Table 5) . In Lepsämänjoki and Yläneenjoki spring cereals are the most common crops (59 and 65% of the total cultivated area, respectively). Thus reduction of fertilisation of spring cereals gov-erned the changes in nitrate leaching. The mean reduc-tion of fertilisareduc-tion rates for spring cereals was 4% in Yläneenjoki and 7% in Lepsämänjoki. Therefore, the reduction of nitrate leaching was lower in Yläneen-joki than in LepsämänYläneen-joki. Another reason for lower reduction in nitrate leaching in Yläneenjoki compared to Lepsämänjoki is possibly the higher livestock den-sity (pigs and poultry) (Table 1) in Yläneenjoki. No remarkable change was observed in animal densities, and thus nitrogen input was dominated by manure and the reduction in total nitrogen input was not as high as in Lepsämänjoki. In Lestijoki the amount of applied slurry has increased (on average 30.5 m3ha−1in 1995
and 35 m3ha−1in 1997). Thus, the reduction in nitrate
leaching (3%) was clearly lower than in other areas. However, the interview data for Lestijoki was not com-plete for the years 1994 and 1995, which may explain some of the discrepancies compared to the other areas.
5. Conclusions
Implementation of the EU Agri-Environmental Support Scheme in Finland has led to significant changes in agricultural practices, resulting in more environmentally sustainable agriculture. The model estimates calculated in this study showed that the altered practices most likely reduced nitrate losses, although the potential changes were rather small. The most important single reason for the reduction in losses was the reduction in nitrogen input (inorganic fertiliser+manure).
The estimates from this study show that the goals set for the Support Scheme, and also the general goals for nitrogen load reductions, will not be fully achieved by the changes in management practices that have taken place during the first years of the Scheme. In order to achieve further reductions, fertilisation and particularly manure spreading should be reduced and
better adjusted to the actual nitrogen requirements of crops.
Acknowledgements
Our warmest thanks are due to dozens of interview-ers in the study areas, who obtained essential infor-mation from the local farmers. We are also grateful to Markku Yli-Halla, who carried out the classifica-tion of soil types and provided a critical review of the manuscript. The study was jointly financed by the Ministries of the Environment and Agriculture and Forestry.
References
Bergström, L., Jarvis, N.J., 1991. Prediction of nitrate leaching losses from arable land under different fertilization intensities using the SOIL-SOILN models. Soil Use Manage. 7 (2), 79–85. Borg, G.Ch., Jansson, P.-E., Lindén, B., 1990. Simulated and measured nitrogen conditions in a manured and fertilised soil. Plant Soil 121, 251–267.
Brooks, R.H., Corey, A.T., 1964. Hydraulic properties of porous media. Hydrology Paper No. 3, Colorado State University, Fort Collins, Colorado.
EEC, 1992. Council Regulation (EEC) no 2078/92 of 30 June 1992 on agricultural production methods compatible with the requirements of the protection of the environment and the maintenance of the countryside. Official J. Eur. Commun. No. L215, 85–90.
Food and Agriculture Organization, 1988. FAO/Unesco Soil Map of the World. Revised Legend, with corrections. World Resources Report 60, FAO, Rome.
Food and Agriculture Organization, 1990. Guidelines for Soil Description. FAO, Rome, 70 pp.
Granéli, E., Wahlström, K., Larsson, U., Granéli, W., Elmgren, R., 1990. Nutrient limitation and primary production in the Baltic Sea area. Ambio 19, 142–151.
Grönroos, J., Rekolainen, S., Palva, R., Granlund, K., Bärlund, I., Nikander, A., Laine, Y., 1998. Maatalouden ympäristötuki. Toimenpiteiden toteutuminen ja vaikutukset v. 1995–1997. Suomen ympäristö 239, Suomen ympäristökeskus, Helsinki. Haak, E., 1993. Field-related fertilisation and crop production.
Stencil, Division of Plant Nutrition, Swedish University of Agricultural Sciences, Uppsala.
HELCOM, 1994. Intergovernmental activities in the framework of the Helsinki Convention 1974–1994. Balt. Sea Environ. Proc. No. 56, 107–224.
of Forest Water and Energy Exchange Models. International Society for Ecological Modelling, Copenhagen, pp. 145–163. Johnsson, H., 1990. Nitrogen and water dynamics in arable
soil — a modelling approach emphasising nitrogen losses. Swedish University of Agricultural Sciences, Department of Soil Sciences, Reports and Dissertations No. 6, Uppsala. Johnsson, H., Jansson, P.-E., 1991. Water balance and soil moisture
dynamics of field plots with barley and grass ley. J. Hydrol. 129, 149–173.
Johnsson, H., Bergström, L., Jansson, P.-E., Paustian, K., 1987. Simulated nitrogen dynamics and losses in a layered agricultural soil. Agric. Ecosyst. Environ. 18, 333–356.
Kallio, K., 1995. Miksi peltoalueiden typpihuuhtoutumat ovat kasvaneet. Vesitalous 1, 3–7.
Kallio, K., Rekolainen, S., Ekholm, P., Granlund, K., Laine, Y., Johnsson, H., Hoffman, M., 1997. Impacts of climatic change on agricultural nutrient losses in Finland. Boreal Environ. Res. 2, 33–52.
Kemira Agro Oy, 1997. Lannoitustulkki 97/98, Helsinki. Kemppainen, E., 1995. Leaching and uptake of nitrogen and
phosphorus from cow slurry and fox manure in a lysimeter trial. Agric. Sci. Finl. 4, 363–375.
Kivi, K., Kaitala, S., Kuosa, H., Kuparinen, J., Leskinen, E., Lignell, R., Marcussen, B., Tamminen, T., 1993. Nutrient limitation and grazing control of the baltic plankton community during annual succession. Limnol. Oceanogr. 38 (5), 893–905. Kätterer, T., 1995. Nitrogen dynamics in soil and winter wheat subjected to daily fertilization and irrigation — measurements and simulations. Swedish University of Agricultural Sciences, Department of Ecology and Environmental Research, Report 81, Uppsala 1995.
Leinonen, L. (Ed.), 1996. Air Quality Measurements 1994. Finnish Meteorological Institute, Helsinki 1996.
Ministry of Agriculture and Forestry, 1995. Maa- ja metsätalous-ministeriön päätös maatalouden ympäristötuen perustuesta. Päätös nro 768/95, Annettu Helsingissä 10.5.1995.
Ministry of the Environment, 1998. Vesiensuojelun tavoitteet vuoteen 2005. The Finnish Environment 226, Ministry of the Environment, Helsinki, Finland.
Mualem, Y., 1976. A new model for predicting the hydraulic conductivity of unsaturated porous media. Water Resources Res. 12, 513–522.
Niinioja, R., 1993. Lietelannan levitys ja ravinteiden huuhtoutuminen. Vesi- ja ympäristöhallinnon julkaisuja - sarja A 150.
Pietiläinen, O.-P., 1997. Agricultural phosphorus load and phosphorus as a limiting factor for algal growth in Finnish lakes and rivers. In: Tunney, H., Carton, O.T., Brookes, P.C., Johnston, A.E. (Eds.), Phosphorus Loss from Soil to Water. CAB International, Wallingford, UK, pp. 354–356.
Pirttijärvi, R., 1998. Nutrient balances in agri-environmental policy. Agricultural Economics Research Institute, Finland, Publications 88.
Rasmussen, K., Sippola, J., Urvas, L., Låg, J., Troedsson, T., Wiberg, M., 1991. Soil map of Denmark, Finland, Norway and Sweden, Scale 1: 2 000 000. Landbruksforlaget, Oslo. Rekolainen, S., Leek, R. (Eds.), 1996. Regionalisation of erosion
and nitrate losses from agricultural land in Nordic countries. Nordic Council of Ministers, TemaNord, 615.
Rekolainen, S., Pitkänen, H., Bleeker, A., Felix, S., 1995. Nitrogen and phosphorus fluxes from Finnish agricultural areas to the Baltic Sea. Nord. Hydrol. 26, 55–72.
Sippola, J., 1974. Mineral composition and its relation to textute and to some chemical properties in Finnish subsoils. Annales Agriculturae Fenniae 13, 169–234.
Sippola, J., Tares, T., 1978. The soluble content of mineral elements in cultivated Finnish soils. Acta Agriculturae Scandinavica Supplement 20, 12–25.
Tuovinen, J.-P., Kangas, L., Nordlund, G., 1990. Model calculations of sulphur and nitrogen deposition in Finland. In: Kauppi, P., Anttila, P., Kenttämies, K. (Eds.), Acidification in Finland. Springer, Berlin, Heidelberg, pp. 167–197.
Valpasvuo-Jaatinen, P., Rekolainen, S., Latostenmaa, H., 1997. Finnish agriculture and its sustainability: environmental impacts. Ambio 26 (7), 448–455.