THE COMBINATION OF UAV SURVEY AND LANDSAT IMAGERY FOR
MONITORING OF CROP VIGOR IN PRECISION AGRICULTURE
V. Lukas a*, J. Novák a, L. Neudert a, I. Svobodova b, F. Rodriguez-Moreno c, M. Edrees a, J. Kren a
a Department of Agrosystems and Bioclimatology, Mendel University in Brno, Zemedelska 1, 613 00 Brno, Czech Republic –
b Agricultural Research Institute Kromeriz, Ltd., Havlickova 2787/121, 767 01 Kromeriz, Czech Republic – [email protected] c Department of Remote Sensing, Global Change Research Centre, Academy of Sciences of the Czech Republic,
v.v.i., Belidla 986/4a, 603 00 Brno, Czech Republic. - [email protected]
Commission VIII, WG VIII/8
KEY WORDS: Unmanned aerial vehicle, satellite remote sensing, vegetation indices, winter wheat, site specific crop management
ABSTRACT:
Mapping of the with-in field variability of crop vigor has a long tradition with a success rate ranging from medium to high depending on the local conditions of the study. Information about the development of agronomical relevant crop parameters, such as above-ground biomass and crop nutritional status, provides high reliability for yield estimation and recommendation for variable rate application of fertilizers. The aim of this study was to utilize unmanned and satellite multispectral imaging for estimation of basic crop parameters during the growing season. The experimental part of work was carried out in 2014 at the winter wheat field with an area of 69 ha located in the South Moravia region of the Czech Republic. An UAV imaging was done in April 2014 using Sensefly eBee, which was equipped by visible and near infrared (red edge) multispectral cameras. For ground truth calibration the spectral signatures were measured on 20 sites using portable spectroradiometer ASD Handheld 2 and simultaneously plant samples were taken at BBCH 32 (April 2014) and BBCH 59 (Mai 2014) for estimation of above-ground biomass and nitrogen content. The UAV survey was later extended by selected cloud-free Landsat 8 OLI satellite imagery, downloaded from USGS web application Earth Explorer. After standard pre-processing procedures, a set of vegetation indices was calculated from remotely and ground sensed data. As the next step, a correlation analysis was computed among crop vigor parameters and vegetation indices. Both, amount of above-ground biomass and nitrogen content were highly correlated (r > 0.85) with above-ground spectrometric measurement by ASD Handheld 2 in BBCH 32, especially for narrow band vegetation indices (e.g. Red Edge Inflection Point). UAV and Landsat broadband vegetation indices varied in range of r = 0.5 – 0.7, highest values of the correlation coefficients were obtained for crop biomass by using GNDVI. In all cases results from BBCH 59 vegetation stage showed lower relationship to vegetation indices. Total amount of aboveground biomass was identified as the most important factor influencing the values of vegetation indices. Based on the results can be assumed that UAV and satellite monitoring provide reliable information about crop parameters for site specific crop management. The main difference of their utilization is coming from their specification and technical limits. Satellite survey can be used for periodic monitoring of crops as the indicator of their spatial heterogeneity within fields, but with low resolution (30 m per pixel for OLI). On the other hand UAV represents a special campaign aimed on the mapping of high-detailed spatial inputs for site specific crop management and variable rate application of fertilizers.
1. INTRODUCTION
Site specific management, known as precision agriculture, is an internationally unified term for directions of land management using new technologies that began to be developed in the eighties and early nineties of the twentieth century. The aim of precision agriculture is an optimization of production inputs (fertilizers, pesticides, fuel, etc.) based on the local crop requirements and soil condition. Crop management in this way can lead to economically efficient use of agrochemicals and minimization of environmental risks. Site specific management takes into consideration spatial variability within fields and optimizes the production inputs, thus fulfilling the objectives of sustainable agriculture (Corwin & Plant 2005).
For site specific crop treatments during vegetation period, such as fertilizing or crop protection, full coverage information about the heterogeneity of crop vigor are needed. The survey by using traditional sampling methods at the appropriate spatial level is costly and labour consuming.
Remote sensing methods provide a various tools for assessment of canopy stand parameters, which are applied in last two
decades (Mulla, 2013). For quantification of crop biophysical parameters, which are related to nutrient and healthy status of plants and thus important for yield formation, various vegetation indices are recommended as described by many research studies (for cereals e.g. (Fu et al., 2014; Li et al., 2014).
Besides already established airborne and satellite multispectral imaging, an application of unmanned aerial survey by Remotely Piloted Aircraft Systems in precision agriculture is rapidly increasing in recent years (Zhang a Kovacs, 2012). There are many research studies which investigate development of the unmanned aerial platforms (Link et al., 2013), the processing and use of this new type of image data in precision agriculture, which can include the methodology for radiometric correction of images (Del Pozo et al., 2014; Kelcey a Lucieer, 2012) or development of the entire processing chain from raw images up to georeferenced reflectance images, digital surface models and biomass estimates, which integrates photogrammetric and quantitative remote sensing approaches (Honkavaara et al., 2013). Generally, compared to the airborne and satellite imaging, UAV survey offers cheaper operation and higher The International Archives of the Photogrammetry, Remote Sensing and Spatial Information Sciences, Volume XLI-B8, 2016
spatial resolution of the image together with high flexibility (Pechanec et al., 2014). Main sensing technology is based on the multispectral cameras, which provide single bands for calculation of broadband vegetation indices (Candiago et al., 2015; Gómez-Candón et al., 2014; Sankaran et al., 2015). Other category are narrowband hyperspectral sensors, which allows to estimate more specific vegetation indices or chlorophyll fluorescence (Aasen et al., 2015; Lucieer et al., 2014; Zarco-Tejada et al., 2009). But also simple RGB imaging is useful for crop assessment, as presented by Bendig et al. (2014) by the estimation of spring barley biomass based on the crop surface model from UAV survey in visible spectrum.
The aim of the study was to verify the possibility of assessment of the basic parameters of winter wheat canopy represented as the total amount of aboveground biomass and nutritional status of the plants by using unmanned multispectral imaging.
2. MATERIAL AND METHODS
Experimental work was carried out at the field of area 68.77 ha with winter wheat at locality Otnice (Czech Republic, South Moravia region; 49 ° 5'27 "N, 16 ° 50'32" E). The land surface is gently sloped (215-277 m asl), predominant soil types are haplic luvisol and chernosem. Plant samples were taken during vegetation period in BBCH 32 (15th April 2014) and BBCH 59 (13th Mai 2014) at 20 control points for estimation of above-ground biomass and nitrogen content. Information about nitrogen concentration in plants and total amount of dry biomass allows to calculate nitrogen uptake (N-uptake), expressed as amount of N per square meter. Simultaneously the spectral signatures were measured using portable spectroradiometer ASD Handheld 2 in the spectral range 325 - 1000 nm.
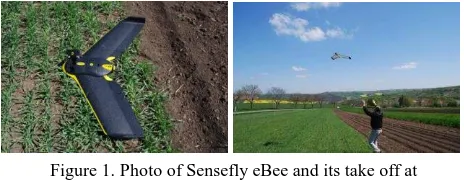
Figure 1. Photo of Sensefly eBee and its take off at experimental site
Unmanned aerial imaging was carried out on 22nd April 2014 Checkterra, s.r.o. company with their Sensefly eBee, which was equipped by one camera in visible spectrum (Canon S110 RGB) and one camera for near infrared - red edge (Canon S110 RE). This means that complete survey consists of two flights and over 500 images with 15 cm spatial resolution for each flight were acquired. Orthomosaic was processed in Pix4D Postflight Terra 3D software and later corrected by Quick Atmosphere Corrections tools in ENVI 5.2 software.
Besides aerial survey, available cloud-free Landsat 8 OLI satellite images were downloaded from USGS web application Earth Explorer for whole vegetation period. The Landsat scene covers 185-by-180 km surface area with the spectral resolution of 15 m (panchromatic band), 30 m (multispectral bands) and 100 m (thermal bands) (Irons et al., 2012). For this study, only images related to the dates of crop survey were selected - acquisition day 108 (18th April) and 140 (20th Mai). Pixel DN values were corrected to top-of-atmosphere by band coefficients
from metadata file and surface reflectance using dark subtraction tool, both made in Harris ENVI 5.2 software.
After pre-processing procedures, a set of vegetation indices (NDVI, GNDVI, EVI2 and REIP) was calculated from remotely and ground sensed data. Normalized Difference Vegetation Index (NDVI) was originally developed for estimating the proportion of vegetation cover in shrubby area from broadband satellite data (Rouse et al. 1974). Normalization partially reduces some disruptive impacts on the imagery data, such as differences in scene illumination, shadows and atmospheric influences, because their effect is similar across the spectral bands. The equation for calculation of NDVI from broadband wavelength are chosen. For ASD data, calculation according Heege et al. (2008) was used with R670 and R800.
Small modification of NDVI is Green NDVI, where instead of red, green reflectance is calculated. Some studies describe the higher sensitivity of GNDVI to the changes in chlorophyll concentration in comparison to NDVI (Gitelson a Merzlyak, 1998).
Huete et al. (1994) introduced the Enhanced Vegetation Index (EVI), which reduces atmospheric and canopy background effects by implementation of blue band reflectance into normalized calculation. Later Jiang et al. (2008) developed two bands EVI (EVI2), which is calculated from red and NIR bands and allows higher compatibility among various sensors by keeping functionally equivalent to EVI:
(2)
According to Gao et al. (2000), NDVI is influenced more by chlorophyll content and saturates at high amount of aboveground biomass of plants, while EVI is related tightly to a structural changes in crop canopy stands and thus better corresponds to crop biomass. As a result, EVI has a higher sensitivity to changes in the green vegetation at a higher level of above-ground biomass (Huete et al., 2002).
One of the vegetation indices often used for estimation of nutrient status of field crops is Red Edge Inflection Point (REIP), which indicates the wavelength of the inflection point in the red edge part of spectrum. The position of this point is generally in the region 680-750 nm. An increase of chlorophyll concentration in plants or amount of biomass causes a shift of inflection point to higher wavelengths (Heege et al. 2008). Several methods have been proposed for calculation of REIP, in this study the linear interpolation from four wavelengths according to the empirical equation proposed by Guyot et al. (1988) was used:
[nm] (3) The International Archives of the Photogrammetry, Remote Sensing and Spatial Information Sciences, Volume XLI-B8, 2016
As the last step, the average value for buffer area of control points with the diameter of 2 m was extracted by Zonal Statistic tool in ESRI ArcGIS 10.2 and correlation analysis was computed among crop vigor parameters and vegetation indices.
3. RESULTS AND DISCUSSION
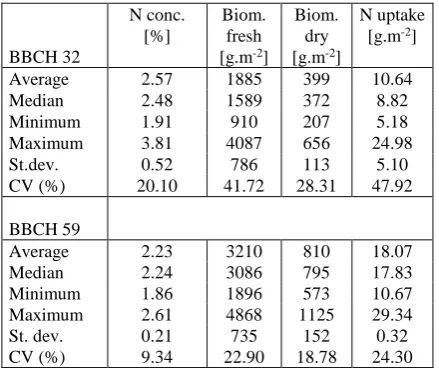
Basic statistical results of assessment of crop parameters from plant sampling and their laboratory analysis are shown in Table 1. Higher variability, evaluated by coefficient of variability (CV), was achieved in BBCH 32, mainly in the total amount of above ground fresh biomass and N-uptake. The variability of vegetation indices from ASD, UAV and Landsat didn’t exceed 20 % of CV lower (not presented in the table).
BBCH 32
N conc. [%]
Biom. fresh [g.m-2]
Biom. dry [g.m-2]
N uptake [g.m-2]
Average 2.57 1885 399 10.64
Median 2.48 1589 372 8.82
Minimum 1.91 910 207 5.18
Maximum 3.81 4087 656 24.98
St.dev. 0.52 786 113 5.10
CV (%) 20.10 41.72 28.31 47.92
BBCH 59
Average 2.23 3210 810 18.07
Median 2.24 3086 795 17.83
Minimum 1.86 1896 573 10.67
Maximum 2.61 4868 1125 29.34
St. dev. 0.21 735 152 0.32
CV (%) 9.34 22.90 18.78 24.30
Table 1. Basic statistics of results of plant analysis (St. dev. – standard deviation, CV – coefficient of variability, N conc. – nitrogen concentration, Biom. – total amount of above-ground
biomass)
Figure 2. Orthomosaic of the experimental field from UAV survey in the false color representation
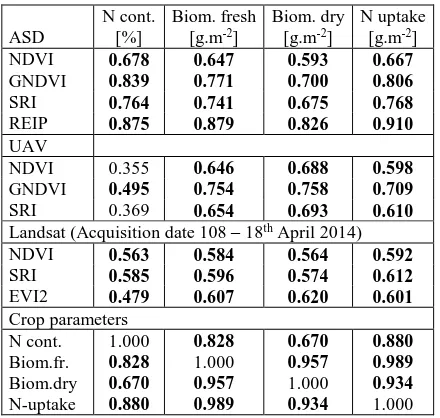
Results of correlation analysis between vegetation indices and crop parameters are shown in Table 1 (BBCH 32) and 2 (BBCH 59). Both, amount of above-ground biomass and nitrogen content were highly correlated (r > 0.85) with ground spectrometric measurement by ASD Handheld 2 in BBCH 32, especially for narrow band vegetation indices (e.g. Red Edge
Inflection Point). Sensitivity of REIP nitrogen concentration in leaves was observed in many recent studies. Mariotto et al. (2013) find that use of narrowband hyperspectral sensors provide 25 % greater variability in crop modelling and 20 % greater accuracy in crop discrimination compared to broadband sensors. The correlation coefficients were lower in BBCH 59, but still highest from all spectral measurements.
Figure 2. GNDVI image of the experimental field from UAV survey with the position of control points
Figure 3. Landsat NDVI image of the experimental field from 18th April 2014 (Acquisition date 108)
For unmanned aerial imaging, in both sampling dates were achieved the highest values of correlation coefficients with biomass by GNDVI. This confirms the results of the study the authors Gitelson a Merzlyak (1998) who describe GNDVI greater sensitivity to changes in the index of chlorophyll than NDVI. Figures below show the scatterplots of NDVI and dry biomass (Figure 4) and GNDVI between N-uptake.
Compared to the Landsat images, UAV vegetation indices achieved higher level of correlation with the crop parameters (except N concentration) from first sampling date. However, for second plant sampling date, the correlation decreased, probably due the two weeks lag between plant sampling and UAV survey.
The amount of above-ground biomass, which is an important indicator of plant growth and yield estimation wheat (Fu et al., 2014), was identified as the dominant for most of verified remotely sensed indices. As reported by (Li et al., 2008), the relationship between vegetation indices and crop parameters changes during the growing season, which is reflected by lower sensitivity of vegetation indices at higher leaf area index (LAI) due the saturation of the reflected radiation. This is evident from the graph in Fig. 4, where the higher values of biomass are nor identified by NDVI values.When reaching a certain level LAI, value of broadband NDVI doesn’t reflect the increase of canopy density linearly anymore and they decrease with vegetation senescence (Baret & Guyot 1991).
ASD
N cont. [%]
Biom. fresh [g.m-2]
Biom. dry [g.m-2]
N uptake [g.m-2]
NDVI 0.678 0.647 0.593 0.667
GNDVI 0.839 0.771 0.700 0.806
SRI 0.764 0.741 0.675 0.768
REIP 0.875 0.879 0.826 0.910
UAV
NDVI 0.355 0.646 0.688 0.598
GNDVI 0.495 0.754 0.758 0.709
SRI 0.369 0.654 0.693 0.610
Landsat (Acquisition date 108 – 18th April 2014)
NDVI 0.563 0.584 0.564 0.592
SRI 0.585 0.596 0.574 0.612
EVI2 0.479 0.607 0.620 0.601
Crop parameters
N cont. 1.000 0.828 0.670 0.880
Biom.fr. 0.828 1.000 0.957 0.989
Biom.dry 0.670 0.957 1.000 0.934
N-uptake 0.880 0.989 0.934 1.000 Table 2. Pearson correlation coefficients between vegetation indices from handheld spectrometer (ASD), UAV survey and
Landsat OLI images (acquisition day marked) and crop parameters for BBCH 32. Bold values are statistically
significant at 95 % level.
ASD
N cont. [%]
Biom. fresh [g.m-2]
Biom. dry [g.m-2]
N uptake [g.m-2]
NDVI 0.404 0.453 0.434 0.504
GNDVI 0.498 0.680 0.627 0.695
REIP 0.516 0.764 0.700 0.772
UAV
NDVI 0.205 0.378 0.396 0.415
GNDVI 0.289 0.456 0.444 0.487
Landsat (Acquisition date 140 – 20th Mai 2014)
NDVI 0.468 0.638 0.520 0.593
EVI2 0.423 0.692 0.600 0.647
Crop parameters
N cont. 1.000 0.561 0.346 0.650
Biom.fr. 0.561 1.000 0.955 0.978
Biom.dry 0.346 0.955 1.000 0.934
N-uptake 0.650 0.978 0.934 1.000 Table 2. Pearson correlation coefficients between vegetation indices from handheld spectrometer (ASD), UAV survey and
Landsat OLI images (acquisition day marked) and crop parameters for BBCH 59. Bold values are statistically
significant at 95 % level.
Figure 4. Scatter plot of NDVI values and dry biomass from UAV image in BBCH 32
Figure 4. Scatter plot of GNDVI values and dry biomass from UAV image in BBCH 32
CONCLUSIONS
Based on the results can be assumed that UAV and satellite monitoring provide reliable information about crop parameters for site specific crop management. The main difference of their utilization is coming from their specification and technical limits. Satellite survey can be used for periodic monitoring of crops as the indicator of their spatial heterogeneity within fields, but with low resolution (30 m per pixel for OLI compared to the 0.15 m per pixel of UAV imaging). On the other hand UAV represents a special campaign aimed on the mapping of high-detailed spatial inputs for site specific crop management and variable rate application of fertilizers.
ACKNOWLEDGEMENTS
This study was supported by research project TACR ALFA TA04021389 "Development of the system for variable rate application of pesticides and fertilizers using crop monitoring" and NAZV QJ1610289 "Efficient use of soil productivity by site specific crop management"
REFERENCES
Aasen, H., Burkart, A., Bolten, A., Bareth, G. Generating 3D hyperspectral information with lightweight UAV snapshot cameras for vegetation monitoring: From camera calibration to The International Archives of the Photogrammetry, Remote Sensing and Spatial Information Sciences, Volume XLI-B8, 2016
quality assurance. ISPRS Journal of Photogrammetry and Remote Sensing. 2015, vol. 108, pp. 245-259.
Bendig, J., Bolten, A., Bennertz, S., Broscheit, J., Eichfuss, S., Bareth, G. Estimating Biomass of Barley Using Crop Surface Models (CSMs) Derived from UAV-Based RGB Imaging. Remote Sensing. 2014, vol. 6, no. 11, pp. 10395-10412.
Candiago, S., Remondino, F., Giglio, M. D., Dubbini, M., Gattelli, M. Evaluating Multispectral Images and Vegetation Indices for Precision Farming Applications from UAV Images. Remote Sensing. 2015, vol. 7, pp. 4026-4047.
Del Pozo, S., Rodríguez-Gonzálvez, P., Hernández-López, D., Felipe-García, B. Vicarious Radiometric Calibration of a Multispectral Camera on Board an Unmanned Aerial System. Remote Sensing. 2014, vol. 6, pp. 1918-1937.
Fu, Y., Yang, G., Wang, J., Song, X., Feng, H. Winter wheat biomass estimation based on spectral indices, band depth analysis and partial least squares regression using hyperspectral measurements. Computers and Electronics in Agriculture. 2014, vol. 100, no. 0, pp. 51-59.
Gao, X., Huete, A. R., Ni, W. G., Miura, T. Optical-biophysical relationships of vegetation spectra without background contamination. Remote Sensing of Environment. 2000, vol. 74, no. 3, pp. 609-620.
Gitelson, A. A., Merzlyak, M. N. Remote sensing of chlorophyll concentration in higher plant leaves. Advances in Space Research. 1998, vol. 22, no. 5, pp. 689-692.
Gómez-Candón, D., Castro, A. I., López-Granados, F. Assessing the accuracy of mosaics from unmanned aerial vehicle (UAV) imagery for precision agriculture purposes in wheat. Precision Agriculture. 2014, vol. 15, no. 1, pp. 44-56.
Heege, H. J., Reusch, S., Thiessen, E. Prospects and results for optical systems for site-specific on-the-go control of nitrogen-top-dressing in Germany. Precision Agriculture. 2008, vol. 9, no. 3, pp. 115-131.
Honkavaara, E., Saari, H., Kaivosoja, J., Pölönen, I., Hakala, T., Litkey, P., Mäkynen, J., Pesonen, L. Processing and Assessment of Spectrometric, Stereoscopic Imagery Collected Using a Lightweight UAV Spectral Camera for Precision Agriculture. Remote Sensing. 2013, vol. 5, pp. 5006-5039.
Huete, A., Didan, K., Miura, T., Rodriguez, E. P., Gao, X., Ferreira, L. G. Overview of the radiometric and biophysical performance of the MODIS vegetation indices. Remote Sensing of Environment. 2002, vol. 83, no. 1-2, pp. 195-213.
Huete, A., Justice, C., Liu, H. Development of Vegetation and Soil Indexes for Modis-Eos. Remote Sensing of Environment. 1994, vol. 49, no. 3, pp. 224-234.
Irons, J. R., Dwyer, J. L., Barsi, J. A. The next Landsat satellite: The Landsat Data Continuity Mission. Remote Sensing of Environment. 2012, vol. 122, no. 0, pp. 11-21.
Jiang, Z., Huete, A. R., Didan, K., Miura, T. Development of a two-band enhanced vegetation index without a blue band.
Remote Sensing of Environment. 2008, vol. 112, no. 10, pp. 3833-3845.
Kelcey, J., Lucieer, A. Sensor Correction of a 6-Band Multispectral Imaging Sensor for UAV Remote Sensing. Remote Sensing. 2012, vol. 4, no. 5, pp. 1462-1493.
Li, F., Gnyp, M. L., Jia, L., Miao, Y., Yu, Z., Koppe, W., Bareth, G., Chen, X., Zhang, F. Estimating N status of winter wheat using a handheld spectrometer in the North China Plain. Field Crops Research. 2008, vol. 106, no. 1, pp. 77-85.
Li, F., Mistele, B., Hu, Y., Chen, X., Schmidhalter, U. Reflectance estimation of canopy nitrogen content in winter wheat using optimised hyperspectral spectral indices and partial least squares regression. European Journal of Agronomy. 2014, vol. 52, pp. 198-209.
Link, J., Senner, D., Claupein, W. Developing and evaluating an aerial sensor platform (ASP) to collect multispectral data for deriving management decisions in precision farming. Computers and Electronics in Agriculture. 2013, vol. 94, no. 0, pp. 20-28.
Lucieer, A., Malenovský, Z., Veness, T., Wallace, L. HyperUAS—Imaging Spectroscopy from a Multirotor Unmanned Aircraft System. Journal of Field Robotics. 2014, vol. 31, no. 4, pp. 571-590.
Mulla, D. J. Twenty five years of remote sensing in precision agriculture: Key advances and remaining knowledge gaps. Biosystems Engineering. 2013, vol. 114, no. 4, pp. 358-371.
Pechanec, V., Vávra, A., Machar, I. Využití UAV technologie pro získávání dat v precizním zemědělství na příkladu ploch s cukrovou řepou. Listy cukrov. řepař. 2014, vol. 130, no. 5-6, pp. 162-165.
Sankaran, S., Khot, L. R., Carter, A. H. Field-based crop phenotyping: Multispectral aerial imaging for evaluation of winter wheat emergence and spring stand. Computers and Electronics in Agriculture. 2015, vol. 118, pp. 372-379.
Zarco-Tejada, P. J., Berni, J. A. J., Suárez, L., Sepulcre-Cantó, G., Morales, F., Miller, J. R. Imaging chlorophyll fluorescence with an airborne narrow-band multispectral camera for vegetation stress detection. Remote Sensing of Environment. 2009, vol. 113, no. 6, pp. 1262-1275.
Zhang, C., Kovacs, J. The application of small unmanned aerial systems for precision agriculture: a review. Precision Agriculture. 2012, vol. 13, no. 6, pp. 693-712.