IMPACTS OF TREE HEIGHT-DBH ALLOMETRY ON LIDAR-BASED TREE
ABOVEGROUND BIOMASS MODELING
R. FANG
College of Forestry, Oregon State University, 97331 Corvallis, Oregon, USA- [email protected]
Commission VIII, WG VIII/7
KEY WORDS: tree aboveground biomass, lidar, allometric equations, simulation, regression
ABSTRACT:
Lidar has been widely used in tree aboveground biomass (AGB) estimation at plot or stand levels. Lidar-based AGB models are usually constructed with the ground AGB reference as the response variable and lidar canopy indices as predictor variables. Tree diameter at breast height (dbh) is the major variable of most allometric models for estimating reference AGB. However, lidar measurements are mainly related to tree vertical structure. Therefore, tree height-dbh allometric model residuals are expected to have a large impact on lidar-based AGB model performance. This study attempts to investigate sensitivity of lidar-based AGB model to the decreasing strength of height-dbh relationship using a Monte Carlo simulation approach. Striking decrease inR2and increase in relative RMSE were found in lidar-based AGB model, as the variance of height-dbh model residuals grew. I, therefore, concluded that individual tree height-dbh model residuals fundamentally introduce errors to lidar-AGB models.
1. INTRODUCTION
Forests play an important role in global climate change and can absorb CO2 in the atmosphere via photosynthesis and store the sequestered carbon as biomass (Myneni et al., 2001; Pacala et al., 2001; Pan et al., 2011). Thus, accurate estimates of forest biomass are crucial for understanding global carbon cycle and predicting the future climate (Chen et al., 2015). Tree aboveground biomass (AGB) refers to the total amount of living aboveground organic matters present in trees, including leaves, twigs, branches, main bole and bark (Brown 1997). Field AGB measurements usually are not achievable at forests with dense canopies, and cannot cover extensive spatial area. Light detection and ranging (lidar) is a remote sensing technology that has been widely used to estimate forest biomass at plot and stand levels (Lefsky et al. 1999; Hyde, Nelson et al. 2007; Chen et al. 2012). Canopy vertical structural indices can be extracted from lidar measurements. Lidar-based canopy indices are used to construct regression models with ground reference AGB estimates, which are usually calculated from allometric models.
Tree diameter at breast height (dbh) is considered as the most reliable parameter for AGB estimates. Thus, AGB allometric models were widely developed based on dbh (Bartelink, 1996; Basuki et al., 2009; Jenkins et al., 2003; Nelson et al., 1999; Ter-Mikaelian and Korzukhin, 1997; Zianis and Seura, 2005). The fundamental assumption of using lidar canopy height indices to associate with ground AGB reference is that stands (plot) with the same height produce the same amount of biomass products. However, at individual tree level, there is considerable variation in tree height at given tree dbh. This variation is reflected as residuals existing fitted height-dbh allometric models. Tree height-dbh model residuals probably reduce the correlation between lidar canopy height indices and ground AGB reference, consequently introducing errors to lidar-based AGB models.
Exactly how and to what extent the tree level height-DBH allometric model residuals impact the plot level lidar-based AGB models remains poorly understood. Little study has addressed the lidar-based AGB model errors induced by height-dbh allometry. This study aims to exploring how lidar-based AGB model performance change with the decreasing strength of tree height-dbh allometric relationship. A Monte Carlo simulation approach was used to develop plots with varying strength of individual tree height-dbh relationship. For each height-dbh model scenario, 1000 realizations were created. Pseudo point clouds were collected from the simulated canopy surface. Mean canopy height (MCH) was extracted by averaging plot point cloud. Finally, a simply linear regression model was developed with reference AGB and MCH. Average
R2and RMSE were reported for each simulation scenario. The changing patterns of R2and RMSE reveal sensitivity of plot level lidar-based AGB model to the varying individual tree height-dbh relationship. Some further implement suggestions and potential approaches of improving the model performance were proposed.
2. STUDY AREA and METHODS
2.1 Study area and field data
The study area is located in United States Forest Service Sagehen Creek Experimental Forest in California. A systematic sampling grid with 125 m space density was established. Plot size is 0.05 ha. For each plot, trees with dbh greater than 5 cm were measured. Tree species were recorded. Tree crown ratio was estimated.
2.2 Reference AGB calculation
The International Archives of the Photogrammetry, Remote Sensing and Spatial Information Sciences, Volume XLI-B8, 2016 XXIII ISPRS Congress, 12–19 July 2016, Prague, Czech Republic
This contribution has been peer-reviewed.
USDA Jenkins allometric equation model (Jenkins et al., 2003) is available to generate AGB estimates in northern California. The general equation form is expressed as following:
AGB=eβ0+β1*ln(dbh) (1)
where AGB is the tree total aboveground biomass, e (2.71828) is the base of the natural logarithm,β0 and β1are parameters that are dependent on specific tree species groups, DBH is diameter at breast height, and ln is natural logarithm .
Plot level biomass was converted to total biomass density, which is the sum of individual tree biomass present in the plot divided by the area of the plot.
2.3 Monte Carlo Simulation
2.3.1 Height-dbh model
Field tree height and dbh measurements were used to develop simple height-dbh model at log-transformed scale. Their relationship is presented in Figure 1. As it shows in Figure 1, considerable residuals exist in the height-dbh relationship. This model was the base to further establish tree height-dbh relationship with different strength scenarios.
Figure 1.Constructed height – dbh allometric model at log-tranformed scale with field data
2.3.2 Simulation
Step 1. deciding the location and crown diameter of each trees
Plot tree density and dbh were obtained from field sample data. Tree relative locations were randomly assigned within each plot. Distance between any pairs of trees was determined with a rule that Distanceij≥1.5 * (dbhi+dbhj) , where Distanceij is
distance between the geometric centre of ith and jth trees, dbhi
and dbhjare the dbh of ith and jth trees repectively. Crown
diameter was determined by existing models developed by Gill et al. (2000).
Step 2. generating simulated tree height from dbh using tree
height-dbh allometric model under different scenarios
For different scenarios, the strength of the log-transformed height-dbh allometric model was controlled by assigning variance of residuals (�!). The �! was increase from 0 to 0.5.
Totally, ten scenarios were performed. For each stime, the �! was increased 0.05 compared with previous scenario.
For each tree, the height was generated with equation in 2.3.1, by adding a random residual. For all the simulated trees, the residual of log-transformed height-dbh model has the normal distribution N(0,�!).
Step 3. Generate pseudo lidar point clouds
Pseudo lidar point clouds were obtained from the simulated canopy surface with a density two to four returns per square meter. lidar MCH was extracted from the pseudo point clouds. All the returns were classified as ground returns and foliage returns.
Step 4: Constructing LiDAR-AGB models
Reference AGB estimates were calculated with Jenkins equations. And a simply linear regression was used to construct lidar-based AGB models with reference AGB and lidar MCH at log-transformed scale. The model is expressed as following:
ln(AGB)=α0+α1* ln(MCH)+e
0(2)
where AGB is plot reference AGB density, α0and α1are the
estimated parameters, and e0is the residual of the predictions.
Model performance was evaluated with R2and RMSE.
Step 5: Generating 1000 realizations for each tree height-dbh model scenario
1000 realizations were generated for each scenario by repeating
step 1 to 4 to eliminate effect of random locations of trees and
canopy overlapping. The average R2and relative RMSE (ratio between RMSE and mean reference AGB density) of regression models from 1000 realizations were recorded.
3. RESULT
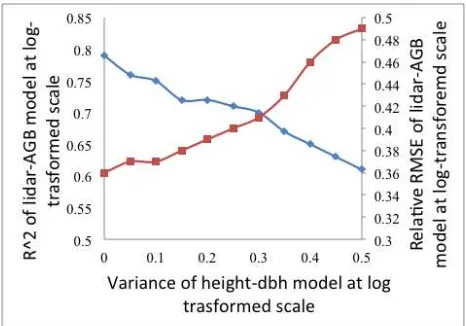
The increasing variance of log-transformed height-dbh model residuals led to decreasing strength of height-dbh relationship. TheR2of log-transformed lidar-based AGB model apparently declines, as consequence of decreasing strength of log-transformed height-dbh model (Figure 2). Theoretically, as height and dbh have perfect relationship (variance of residuals is zero), theR2of lidar-based AGB model is near 0.80, with a relative RMSE of 0.36. When the variance of log-transformed height-dbh model residuals increases to 0.5, averageR2of lidar-based AGB model decreases to 0.61. The simulation result demonstrates the scattering of individual tree level height-dbh allometric relationship introduces errors to lidar-based AGB estimation.
4. DISCUSSIONS and CONCLUSION
Previous studies have extensively studied on the resources that cause variation in lidar’s performance of AGB estimation. These resources include: various types of sensors (Zolkos et al., 2013), regression approaches (Chen et al., 2010; Chen et al, The International Archives of the Photogrammetry, Remote Sensing and Spatial Information Sciences, Volume XLI-B8, 2016
XXIII ISPRS Congress, 12–19 July 2016, Prague, Czech Republic
This contribution has been peer-reviewed.
2015; Dalponte et al., 2008; Garcıa-Gutiérreza et al.; Gleason and Im, 2012), and whether or not optical remote sensing data is fused with lidar data (Anderson et al., 2008; Koetz et al., 2007; Lefsky et al., 2005; Swatantran et al., 2011; Laurin et al., 2014). However, these sources introducing errors to lidar-based AGB models are more considered as external factors rather than the intrinsic limitations of further improving the performance of lidar in biomass estimation. The novelty of this study is to investigate the errors introduced by height-dbh model residuals using Monte Carlo approach. The general decreasing R2of lidar-based AGB model under scenarios of increasing variance of height-dbh model residuals manifested that the individual tree level height-dbh allometry is a fundamental factor impacting on the performance of lidar-based AGB models.
Figure 2. Simulation result: change in (blue diamond line) and relative RMSE (red square line) of log-transformed lidar-AGB model, under the scenarios of increasing variance of log-transformed height-dbh model residuals.
The result implies that if a generalized lidar-based AGB model is developed for a spatially spread area, the accuracy of the model is probably poor, due to the large discrepancy in the strength of height-dbh allometric relationship. Tree height-dbh allometry could vary at forests of different development stages, species compositions, and locations. While sampling trees and constructing lidar-based AGB models, foresters should take the tree height-dbh allometry into consideration.
Another suggestion is to add tree height as an extension variable in estimating reference AGB. Including tree height in reference AGB estimation could enhance lidar’s association with ground reference AGB, because it directly provides the stand height variation at given basal area. Reference AGB estimates with extra height information are more related to lidar canopy vertical measurements. Some allometric models use both tree height and dbh as parameters for AGB estimation (Heath et al. 2009; Zhou and Hemstrom, 2010). Zhao et al. (2012) already found performance of lidar-based AGB models could be different, when different allometric equations were applied for estimating reference AGB. Their finding suggested including tree height in field AGB estimation largely influences the model’s accuracy.
REFERENCES
Anderson, J.E., Plourde, L.C., Martin, M.E., Braswell, B.H., Smith, M.-L., Dubayah, R.O., Hofton, M.A., and Blair, J.B. (2008). Integrating waveform lidar with hyperspectral imagery for inventory of a northern temperate forest. Remote Sens.
Environ,112, pp. 1856–1870.
Bartelink, H.H. (1996). Allometric relationships on biomass and needle area of Douglas-fir. For. Ecol. Manag. 86, pp. 193–203.
Basuki, T.M., van Laake, P.E., Skidmore, A.K., and Hussin, Y.A. (2009). Allometric equations for estimating the above-ground biomass in tropical lowland Dipterocarp forests. For.
Ecol. Manag. 257, pp. 1684–1694.
Brown, S., Food and Agriculture Organization of the United Nations Rome, (1997). FAO FORESTRY PAPER. 134 http://www.fao.org/docrep/w4095e/w4095e00.HTM.
Chen, G., Hay, G.J., and Zhou, Y. (2010). Estimation of forest height, biomass and volume using support vector regression and segmentation from lidar transects and Quickbird imagery. In
2010 18th International Conference on Geoinformatics, pp. 1–4.
Chen, Q., Vaglio Laurin, G., Battles, J.J., and Saah, D. (2012). Integration of airborne lidar and vegetation types derived from aerial photography for mapping aboveground live biomass.
Remote Sens. Environ. 121, pp. 108–117.
Chen, Q. (2015). Modeling aboveground tree woody biomass using national-scale allometric methods and airborne lidar.
ISPRS Journal of Photogrammetry and Remote Sensing, 106,
pp. 95-106.
Dalponte, M., Bruzzone, L. and Gianelle, D., 2008, October. Estimation of tree biomass volume in Alpine forest areas using multireturn LIDAR data and support vector regression. In SPIE
Remote Sensing (pp. 71090C-71090C). International Society for
Optics and Photonics.
García-Gutiérrez, J., et al. "A comparison of machine learning regression techniques for LiDAR-derived estimation of forest variables." Neurocomputing 167 (2015): 24-31.
Gill, S.J., Biging, G.S. and Murphy, E.C., 2000. Modeling conifer tree crown radius and estimating canopy cover. Forest
Ecology and Management, 126(3), pp.405-416.
Gleason, C.J., and Im, J. (2012). Forest biomass estimation from airborne LiDAR data using machine learning approaches.
Remote Sens. Environ.125, pp. 80–91.
Heath, L.S., Hansen, M., Smith, J.E., Miles, P.D. and Smith, B.W., 2009. Investigation into calculating tree biomass and carbon in the FIADB using a biomass expansion factor approach.
R2
The International Archives of the Photogrammetry, Remote Sensing and Spatial Information Sciences, Volume XLI-B8, 2016 XXIII ISPRS Congress, 12–19 July 2016, Prague, Czech Republic
This contribution has been peer-reviewed.
Jenkins, J.C., Chojnacky, D.C., Heath, L.S., and Birdsey, R.A. (2003). National-Scale Biomass Estimators for United States Tree Species. For. Sci. 49, pp. 12–35.
Koetz, B., Sun, G., Morsdorf, F., Ranson, K.J., Kneubühler, M., Itten, K., and Allgöwer, B. (2007). Fusion of imaging
spectrometer and LIDAR data over combined radiative transfer models for forest canopy characterization. Remote Sens.
Environ. 106, pp. 449–459.
Laurin, G.V., Chen, Q., Lindsell, J.A., Coomes, D.A., Del Frate, F., Guerriero, L., Pirotti, F. and Valentini, R., 2014. Above ground biomass estimation in an African tropical forest with lidar and hyperspectral data. ISPRS Journal of Photogrammetry
and Remote Sensing, 89, pp.49-58.
Lefsky, M.A., Harding, D., Cohen, W.B., Parker, G., and Shugart, H.H. (1999). Surface Lidar Remote Sensing of Basal Area and Biomass in Deciduous Forests of Eastern Maryland, USA. Remote Sens. Environ.67, pp. 83–98.
Lefsky, M.A., Turner, D.P., Guzy, M., and Cohen, W.B. (2005). Combining lidar estimates of aboveground biomass and Landsat estimates of stand age for spatially extensive validation of modeled forest productivity. Remote Sens. Environ. 95, pp. 549–558.
Myneni, R.B., Dong, J., Tucker, C.J., Kaufmann, R.K., Kauppi, P.E., Liski, J., Zhou, L., Alexeyev, V., and Hughes, M.K. (2001). A large carbon sink in the woody biomass of northern forests. Proc. Natl. Acad. Sci. 98, pp. 14784–14789.
Nelson, B.W., Mesquita, R., Pereira, J.L., De Souza, S.G.A., Batista, G.T., and Couto, L.B. (1999). Allometric regressions for improved estimate of secondary forest biomass in the central Amazon. For. Ecol. Manag. 117, pp. 149–167.
Nelson, R.F., Hyde, P., Johnson, P., Emessiene, B., Imhoff, M.L., Campbell, R. and Edwards, W., 2007. Investigating RaDAR–LiDAR synergy in a North Carolina pine forest.
Remote Sens. Environ, 110(1), pp.98-108.
Pacala, S.W., Hurtt, G.C., Baker, D., Peylin, P., Houghton, R.A., Birdsey, R.A., Heath, L., Sundquist, E.T., Stallard, R.F., Ciais, P., et al. (2001). Consistent Land- and Atmosphere-Based U.S. Carbon Sink Estimates. Science 292, pp. 2316–2320.
Pan, Y., Birdsey, R.A., Fang, J., Houghton, R., Kauppi, P.E., Kurz, W.A., Phillips, O.L., Shvidenko, A., Lewis, S.L., Canadell, J.G., et al. (2011). A Large and Persistent Carbon Sink in the World’s Forests. Science 333, pp. 988–993.
Swatantran, A., Dubayah, R., Roberts, D., Hofton, M., and Blair, J.B. (2011). Mapping biomass and stress in the Sierra Nevada using lidar and hyperspectral data fusion. Remote Sens.
Environ.115, pp. 2917–2930.
Ter-Mikaelian, M.T., and Korzukhin, M.D. (1997). Biomass equations for sixty-five North American tree species. For. Ecol.
Manag. 97, pp. 1–24.
Zhao, F., Guo, Q. and Kelly, M., 2012. Allometric equation choice impacts lidar-based forest biomass estimates: A case study from the Sierra National Forest, CA. Agricultural and
forest meteorology, 165, pp.64-72.
Zhou, X. and Hemstrom, M.A., 2010. Timber volume and aboveground live tree biomass estimations for landscape analyses in the Pacific Northwest.
Zianis, D., and Seura, S.M. (2005). Biomass and stem volume equations for tree species in Europe (Finnish Society of Forest Science, Finnish Forest Research Institute).
The International Archives of the Photogrammetry, Remote Sensing and Spatial Information Sciences, Volume XLI-B8, 2016 XXIII ISPRS Congress, 12–19 July 2016, Prague, Czech Republic
This contribution has been peer-reviewed.