MULTI
MULTI
MULTI
MULTI----SSSSOURCE
OURCE
OURCE
OURCE R
R
R
REMOTE
EMOTE
EMOTE
EMOTE SSSSENSING
ENSING
ENSING
ENSING
IIIIMAGE
MAGE
MAGE
MAGESSSS M
M
M
MATCHING
ATCHING
ATCHING
ATCHING BASED
BASED
BASED
BASED O
O
O
ON
N
N
N IIIIMPROVED
MPROVED
MPROVED
MPROVED KAZE
KAZE
KAZE
KAZE A
A
A
ALGORITHM
LGORITHM
LGORITHM
LGORITHM
WANG Zong-weia, b, WANG Hua-binb, WANG Guang-huib, LI Can-haib, YANG Hua-chaoa
aEnvironment science and Spatial Informatics, China University of Mining and Technology School, Jiangsu Xuzhou 221116, China bSatellite Surveying and Mapping Application Center, National Administration of Surveying, Mapping and Geoinformation, Beijing
100830, China
KEY KEY KEY
KEY WORDS:WORDS:WORDS:WORDS: Multi-Source Remote Sensing Images, KAZE, AOS, SIFT, Image Matching, Nonlinear Scale Space, Geometric transformation model
ABSTRACT: ABSTRACT: ABSTRACT: ABSTRACT:
SIFT as the representative of the same feature point extraction and matching algorithm has been widely applied in the field of multi-source remote sensing image matching. However, it eliminates noise and detects features at different scale levels by building or approximating the Gaussian scale space based on linear. Gaussian blurring does not respect the natural boundaries of objects and smoothes to the same degree details and noise, reducing localization accuracy. To solve this problem, we proposed an improved KAZE algorithm which can build stable nonlinear scale space. Firstly, the extreme points are detected through building stable nonlinear scale space. Secondly, The match result by optimizing the feature points and strictly limiting matching threshold is used to calculate geometric transformation model parameters between two image. Finally, we can use this geometric transformation model to restrict the search space for feature points matching. Experimental results show that the improved KAZE algorithm is significantly better than the before KAZE. Moreover, for detail and texture blurred images, KAZE and its improved algorithm have unique advantages compared to the SIFT.
1. 1. 1.
1. IIIINTRODUCTIONNTRODUCTIONNTRODUCTIONNTRODUCTION
With the rapid development of remote sensing technology, different sensor resolutions and phase of the multi-source remote sensing images have become an important data source for basic surveying and mapping, agricultural census, meteorological observations, land and resources dynamic monitoring. Due to the influence of external factors such as weather, sunlight, shelter and different imaging time, angle, distance led to the questions of image resolution, pan, rotate, zoom, it has brought great difficulty to multi-source remote sensing images matching work .
SIFT(Scale Invariant Feature Transform) (Lowe, 2004) as the representative of the same feature point extraction and matching algorithm, such as: SURF (H.Bay, 2006), PCA-SIFT (Y.Ke, 2004), ASIFT (Morel, 2009), has been widely applied in the field of multi-source remote sensing images matching. However, it eliminates noise and detects features at different scale levels by building or approximating the Gaussian scale space based on linear. Gaussian blurring does not respect the natural boundaries of objects and smoothes to the same degree both details and noise, reducing localization accuracy and distinctiveness, which causes edge matching poor stability, brings more error matching points and also increases the difficulty of the error matching points elimination. To solve this problem, we proposed an improved KAZE algorithm which can builds stable nonlinear scale space using efficient Additive Operator Splitting (AOS) techniques (Ruan Zong-cai, 2006) and variable conductance diffusion.
2. 2. 2.
2. REMOTEREMOTEREMOTEREMOTE SENSINGSENSINGSENSINGSENSING IMAGEIMAGEIMAGEIMAGESSSS MATCHINGMATCHINGMATCHINGMATCHING ALGORITHM
ALGORITHM
ALGORITHMALGORITHM BASEDBASEDBASEDBASED ONONONON IMPROVEDIMPROVEDIMPROVEDIMPROVED KAZEKAZEKAZEKAZE
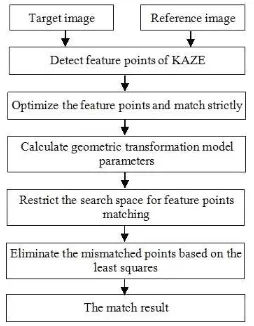
In the first phase of the improved KAZE algorithm, nonlinear scale space is built using efficient Additive Operator Splitting (AOS) techniques and variable conductance diffusion to solve implicit differential equations. And then, feature points are detected by searching for normalized Hessian local maxima at different scales. In the second phase, 64-dimensional double Gaussian weighted M-SURF feature descriptors are constructed. In the third phase, the match result by optimizing the feature points and strictly limiting match threshold is used to calculate geometric transformation model parameters between two images.Finally, That using the geometric transformation model to estimate the matching point's position in the reference image can restrict the search space for feature points matching, which can improve the speed and accuracy of matching. The specific process is shown in Figure 1:
2.1 2.1 2.1
2.1 NNNNonlinearonlinearonlinearonlinear SSSScalecalecalecale SSSSpacepacepacepace 2.1.1
2.1.1 2.1.1
2.1.1 NonlinearNonlinearNonlinearNonlinear DDDDiffusioniffusioniffusioniffusion FFFFilteringilteringilteringiltering(Pablo, 2012, Zhang Er-hua, 2011): Nonlinear diffusion filtering approaches describe the luminance of an image at different scales levels as the divergence of a certain flow function. These approaches are normally described by nonlinear partial differential equations:
)
Where
L
= the luminance of an imaget
= the time of diffusiondiv
= the divergence operators∇
= the divergence operators)
,
,
(
x
y
t
c
= a conductivity function(c
)The function
c
is possible to make the diffusion adaptive to the local image structure. The timet
is the scale parameter, and larger values lead to simpler image representations. In this paper, the functionc
is defined as follows:)
where
∇
L
σ = the gradient of a Gaussian smoothedversion of the original image
L
σThe function
g
is defined as follows:⎪
The function
g
1 can promote high-contrast edges.g
2 can promote wide regions over smaller ones.g
3 can effectively smooth internal area and retain boundary information. The parameterk
is the contrast factor that controls the level of diffusion, which can decide retain how much edge information and large values lead to retain litter edge information .2.1.2 2.1.2 2.1.2
2.1.2 BuildingBuildingBuildingBuilding NNNNonlinearonlinearonlinearonlinear SSSScalecalecalecale SSSSpacepacepacepace: The KAZE takes a similar approach as done in SIFT, discretizing the scale space in logarithmic steps arranged in a series of
O
octaves andS
sub-levels. Unlike SIFT, the KAZE always work with the original image resolution. The octave and sub-level are corresponding to scalar
σ
through the following formula:( )
o
s
osSo
[
O
] [
s
S
] [ ]
i
N
Because nonlinear diffusion filtering is defined in time terms, the set of discrete scale levels in pixel units is needed to convert to time units. In the case of the Gaussian scale space ,the convolution of an image with a Gaussian of standard deviation
σ
is equivalent to filtering the image for some time2
2
σ
=
t
. Thus, the mapping relation of transforming the scale spaceσ
i to time units is defined as following formula:{
N
}
i
t
i=
2
1
σ
i2,
=
0
...
(5)Where
t
i = the evolution timeGiven an input image, we process image with Gaussian filtering, then calculate image gradient histogram, thus obtain the contrast parameter
k
.According to a group of evolution time, the use of AOS nonlinear scale space algorithm can get all the different scale space images (For example Figure 2):(
)
m( )
iFigure 2. Nonlinear scale space images
2.2 2.2
2.22.2 FeatureFeatureFeatureFeature PPPPointointointointssss DDDDetectionetectionetectionetection
(
2)
vertical derivatives respectivelyxy
L
= the second order cross derivativeWhen searching for maxima, each pixel is compared with all its neighboring points, including its previous and the next scale total of 26 points. When it is larger than its neighboring points of scale and image domain, it is namely maxima points.
After finding the location of feature points, precise positioning reaches to sub-pixel using the method of Lowe proposed in BMVC2002 (Lowe, 2002). This is based on Taylor expansion:
( )
X
Sub-pixel coordinates of the feature points are:
X
2.3 FeatureFeatureFeatureFeature DescriptDescriptDescriptDescriptorororor 2.3.1
2.3.1 2.3.1
2.3.1 TheTheTheThe DDDDominantominantominantominant OOrientationOOrientationrientationrientation OOOOffff FFFFeatureeatureeatureeature PPPPointsointsointsoints: To obtain rotation invariant descriptors, it’s necessary to estimate the dominant orientation based on the local image structure of feature points. If the feature point scale parameter is
σ
i , the search radius is set to 6σ
i . For all the neighboring points on the search circle, first order derivativesL
x andL
y are weighted with a Gaussian centered at the interest point, so response contribution of which close to the feature points is large and away from the feature points is litter. The derivative responses are represented as points in vector space and the dominant orientation is found by summing the responses within a sliding circle segment covering an angle of 600. From the longest vector the dominant orientation is obtained.2.3.2 2.3.2 2.3.2
2.3.2 BuildingBuildingBuildingBuilding TTTThehehehe FFFFeatureeatureeatureeature DDDDescriptorescriptorescriptorescriptor: In this paper, the M-SURF descriptor is used to adapt to nonlinear scale space framework. For the scale parameter
σ
i of the feature point, with feature point as the center, the window of 24 × 24 is extracted on the gradient image. And the window is divided into 4 × 4 sub-regions. The size of each sub-region is 9σ
i×9σ
i. Neighboring sub-regions have an overlapping band width of 2σ
i . Each sub-region is weighted by a Gaussiankernel
(
σ
1=
2
.
5
σ
i)
. And then description Vector of sub-region whose length is 4 is calculated.(
∑ ∑ ∑
∑
)
=
x y x yv
L
L
L
L
d
,
,
,
(10)Afterwards, each sub-region's vector
d
v is weighted by another size of 4 × 4 Gaussian window(
σ
2=
2
.
5
σ
i)
. Finally, through normalized, 4×4×4=64 dimensional description vector is obtained.2.4 2.4
2.42.4 ConstrainConstrainConstrainConstrainedededed MMatchMMatchatchatchinginginging
The better KAZE feature points are selected based on spatial distribution and information entropy(Yang Hua-chao, 2011). Euclidean distance between eigenvectors of feature descriptors is the similarity measure. Based on Nearest Neighbour Distance Ration(NNDR), optimal matching feature points are obtained by strictly limiting matching threshold
δ
.2.4.1 2.4.1
2.4.12.4.1 RestrictRestrictRestrictRestrict TheTheTheThe SearchSearchSearchSearch SpaceSpace ForSpaceSpace ForForFor FeatureFeatureFeatureFeature PointsPointsPointsPoints: Matching points obtained by the optimized feature points are used to calculate geometric transformation model parameters. On this basis, we can use the geometric transformation model to estimate the matching point's position in the reference image. And then we can build a circular area whose centre is the position of the estimated points and whose radius is
R
pixels. If more than one feature point are in the circular area, NNDR is used to search for the best matching point. And only one feature point is in the circular area, the correlation coefficient of template matching is to be used. The method of restricting the search space for feature points matching can get most of the feature points out of the search space and reduce the amount of error matching points caused by "different point homogeneity", which can improve the speed and accuracy of matching.2.4.2 2.4.2
2.4.22.4.2 EliminatingEliminatingEliminatingEliminating TheTheTheThe MismatchedMismatched FeatureMismatchedMismatchedFeatureFeatureFeature PointsPointsPointsPoints: We need to estimate the residual error of each matching point using the least squares principle and statistic its Root Mean Square Error(RMSE). If the RMSE is greater than threshold
γ
, the matching point whose RMSE is the greatest, is eliminated until the RMSE is less thanγ
. The RMSE is calculated as follows:N
Where
∆
x
= the residual error inx
directiony
∆
= the residual error iny
directionN
= the amount of matching points3. 3. 3.
3. EXPERIMENTEXPERIMENTEXPERIMENTEXPERIMENT ANDANDANDAND RESULTRESULTRESULTRESULT ANALYSISANALYSISANALYSISANALYSIS
integrated to write the algorithm experiment program. The main parameters of hardware environment is that: CPU is Intel(R) Core (TM) i3-2310M 2.10Ghz. RAM is 2G.
In order to make the table and figure seemed brief, another form of shorthand is used in the following tables and figures:
Where KAZE+ = the improved KAZE t1 = the time of detecting feature points t2 = the time of matching
t3 = the total time
num = the amount of right matching points
Algorithm t1 /s t2 /s t3 /s num SIFT 0.962 1.295 2.257 104
KAZE 1.006 0.437 1.443 23
KAZE+ 1.006 0.311 1.317 49
Table 1. The matching result of ZY-3 stereo images(509*512)
S I F T
K A Z E
K A Z E +
Figure 3. The matching result of ZY-3 stereo images(509*512)
Algorithm t1 /s t2 /s t3 /s num
SIFT 0.771 1.445 2.216 0
KAZE 0.803 0.361 1.164 8
KAZE+ 0.803 0.235 1.038 21
Table 2. The matching result of IRS-P5 image(434*379) and SPOT5 image(246*225)
K A Z E
K A Z E +
Figure 4. The matching result of IRS-P5 image (434*379) and SPOT5 image(246*225)
Algorithm t1 /s t2 /s t3 /s num
SIFT 0.639 1.910 2.549 0
KAZE 0.754 0.807 1.561 57
KAZE+ 0.754 0.567 1.321 92
Table 3. The matching result of SPOT5 images(509*512) before and after Wenchuan earthquake
K A Z E
K A Z E +
Figure 5. The matching result of SPOT5 images(509*512) before and after Wenchuan earthquake
According to the table 1 to 3, for the same image, the feature points detection time of the three algorithms is almost the same. From the table 2 to 3 and figure 4 to 5, for multi-source remote sensing images of larger difference resolution and phase, the amount of matching points of KAZE is significantly better than SIFT. The time and the amount of matching points of the improved KAZE are significantly better than the before KAZE. Especially for the remote sensing images before and after an earthquake, the KAZE and the improved KAZE show their unique advantages by building non-linear scale space which is no loss of details.
4. 4.
4.4. CONCLUSIONCONCLUSIONCONCLUSIONCONCLUSION
REFERENCES REFERENCES REFERENCESREFERENCES
Lowe D G., 2004. Distinctive image features from scale-invariant key points.International Journal of Computer Vision, 60(2), pp. 91-110.
Bay H.,2008. SURF:Speeded up Robust Features. Computer Vision and Image Understanding, 110(3), pp. 346-359.
Ke Y., 2004. PCA-SIFT:A More Distinctive Representation for Local Image Descriptors. IEEE Conference Computer Vision and Pattern Recognition, pp. 506-513.
J.M. Morel.,2009. ASIFT:A New Framework for Fully Affine Invariant Image Comparison. SIAM Journal on Imaging Sciences, pp. 438-469.
Ruan Zong-cai., 2006. AOS based seeded linear diffusion algorithm for image segmentation. Microelectronics & Computer, 23(12), pp. 89-95.
Pablo F. Alcantarilla., 2012. KAZE Features, ECCV, Florence, Italy.
Zhang Er-hua., 2011. Non-linear anisotropic diffusion filtering for 3D seismic noise removal and structure enhancement.
Progress in geophysics, 25(3), pp. 866-870.