SOFTWARE TOOLS FOR IN-SITU DOCUMENTATION OF BUILT HERITAGE
Pierre Smars
Dept & Graduate School of Cultural Heritage Conservation National Yunlin University of Science & Technology
Dou-Liu, 640 Taiwan [email protected] http://smars.yuntech.edu.tw/
KEY WORDS:Architecture, Archæology, Surveying, Acquisition, Photogrammetry, Modelling
ABSTRACT:
The paper presents open source software tools developed by the author to facilitatein-situdocumentation of architectural and archæo-logical heritage. The design choices are exposed and related to a general issue in conservation and documentation: taking decisions about avaluableobject underthreat. The questions of level of objectivity is central to the three steps of this process. It is our belief thatin-situdocumentation has to be favoured in this demanding context, full of potential discoveries. The very powerful surveying techniques in rapid development nowadays enhance our vision but often tend to bring back a critical part of the documentation process to the office. The software presented facilitate a direct treatment of the data on the site. Emphasis is given to flexibility, interoperability and simplicity. Key features of the software are listed and illustrated with examples (3D model of Gothic vaults, analysis of the shape of a column, deformation of a wall, direct interaction with AutoCAD).
1 INTRODUCTION
A set of software tools developed and used by the author in the framework of various documentation projects is presented (Smars et al., 2001, Smars, 2008, Smars and De Jonge, 2009, Smars, 2010, Smars et al., 2012). The purpose of these tools is to fa-cilitate documentation work in-situ, using data acquired using various sensors (total stations, cameras, laser scanners) and hand measurements to produce 3D models (Figures 4, 5), analyse ge-ometry and construction technique (Figures 5, 6), study and mon-itor deformations (Figures 1, 6), either interactively, either semi-automatically.
The source code was recently released (Smars, 2013) under a GPL license.
The paper does not describe all the tools. Interested readers will find more detailed information in another paper (Smars, 2010) and in the software documentation. Some features of the software are described and illustrated but the main of the paper is to show how it attempts to fit a specific approach for the documentation of our built heritage.
The choices made for the design of the software tools were guided by a set of principles taken by the author as acredo:
• Documentation isnever perfectly objective(sections 2 and 3).
• In-situdocumentation is better (section 4).
• Flexibility(tools, approaches) is a virtue (section 5).
• Hybrid approaches, involving a combination of instruments and techniques are most often necessary (section 6).
2 TRANSPARENCY
We like to believe that our record of a particular object is perfectly faithful to “reality”. Of course this is not the case, the result of the
documentation process isa measure, the output of some instru-ment, process, methodology applied to the given object. Results are somehow inaccurate and biased because of the limitations of instruments, techniques but also because of the experience, back-ground and believes of the persons in charge and because of the context of the project.
Documentation as an activity is a step in the path towards the sat-isfaction of some higher aim: prepare an intervention, assess the importance of a property, measure risks, order emergency actions, understand.
Actions may well be taken without prior documentation. They often are. But that will most likely lead to poor results. Ar-guably, better, more rational decisions are taken when situations are well understood. Efficiencyis one of the virtue of good gov-ernance (UNDP, 1997). Documentation reduces uncertainty on the data and consequently facilitates the definition of suitable op-tions, leads to better estimates of their outcome, and globally to a better satisfaction of the objectives.
The whole process is not straightforward though. Given an identi-cal level of knowledge, two deciders will take different decisions, choose different options. Choice is political. This is an unavoid-able fact, neither good nor bad.
Documentation professionals are working in this context. Com-missions are given and reports are used in the framework of a policy.
Commonly accepted good governance principles include trans-parencyandaccountability(UNDP, 1997). That is also the sense of article 16 of the Venice Charter (ICOMOS, 1964).
In that framework, what can be expected from architects, sur-veyors, engineers, archæologists working on the documentation of our build heritage? In our opinion, transparency is critical at their level too. It is beneficial to technical operators, deciders and stakeholders to have an unambiguous presentation of the process and of the level of objectivity to be expected from its outcome; basically to identify uncertainty and choices.
Sometimes, decisions can be taken on sounder bases, reducing the uncertainty by allocating sufficient time and money to the documentation process. In other, irreducible choices have to be made, these occurrences should be identified.
These considerations lead us to state the following general rec-ommendations:
• Document the process of documenting. From a practical point of view, that means that actions taken on the data have to be remembered, organised, documented.
• Keep the original data (original photographs, points mea-sured by the instruments):traceability. This data is the most basic and “objective”.
• Facilitate the possibility to return to some previous stage.
• Advocate the benefits of giving access to this information to the stakeholders:accountability(possibility of peer review, of refuting, inform on the use of public funding).
Many design choices made during the development of the soft-ware tools, were made with these ideas in mind:
• Keep traces of all the actions on the data (log files, concur-rent version systems).
• Use text files: they can be understood by humans, data can be (re-)used easily, even when software becomes obsolete.
• Give a clear view onlevels of objectivity, what is data, un-certainty or interpretation. This is further discussed in the next section.
• Offer tools to compare models.
3 MEASUREMENTS
Documentation activities produce models: 3D computer models, 2D measured drawings, graphs, reports.
Models are needed to apprehend the infinitely complex reality. They are built in a multidimensional space. Points, lines and other geometrical entities may for instance live in a three dimensional space. Models are manageable because they are finite, bounded. They are defined in a space of finite dimension and by a finite number of numeric parameters. They need to be finite because brains and machines can only process finite sets of data. Because they are finite, they are also approximate.
Models are made in the hope to understand the past and predict the future.
How many parameters are necessary? Three points define a plane, two points a vertical plane. How many points need to be mea-sured to record a wall? A model will need to be chosen. Archi-tects, archæologists and engineers will probably see and model the wall differently. If the model is just a section, an architect may decide to cut the building at the level of a window. For an engineer, it may be more useful to cut it at the level of a buttress or where the wall is most inclined. For structural analysis, defor-mations (bulges, traces of relative movements, cracks) will often be important to document. They will affect safety estimates, give clues about the structural history of the structure and record a situ-ation which can be monitored. Are models with many parameters better? Ockham gave us the answer.
One of the key decision is therefore to choose an appropriate model (defined by a finite set of measurable parameters and in-terpolation and/or extrapolation rules).
The number of parameters will also depend of the number of dimensions considered (or the number and types of fields asso-ciated with elements in space and time). Visible line segments have colours. They could be modelled using 12 parameters rep-resenting the coordinates and the colour values at its end points (x1, y1, z1, h1, s1, v1) and (x2, y2, z2, h2, s2, v2) and a linear law of interpolation. Other properties: material type, deterioration level, age may be deemed important to document.
Which dimensions need to be documented? That will be another key choice to make.
When a model is defined or chosen, measurements are made. “Measurement is the process of assigning numbers to objects or events following rules” (Stevens, 1943). Instruments have rules wired in (take theDistoTM, point it to the object, press the button, read). In some case, this is the easy part. It is rarely difficult to measure the edge of a square or to measure a point with a total station. In other cases, it is more critical: identify stone types, measure a state of deterioration, measure the historical value. In these cases, the interpretative part is more significant. It is par-ticularly important to state clearly the set of rules used to assign tags or numbers. Doing so improve reproducibility but does not necessarily imply consensus. Photographs have often a key role, they can provide a non-interpreted version of a situation. More generally, it is useful to compare models with data and with other models.
Various tools were devised to relate photographs and geometri-cal models (6.2) and some tools to compare geometrigeometri-cal models (6.1).
It is important to keep in mind that accuracy of a model is not the same as accuracy of the measurements. If it is unlikely to produce accurate models from inaccurate measurements, it is not at all uncommon to have inaccurate models defined by accurate mea-surements. As discussed above, documentation is a two-times process. During the first qualitative step, the model is chosen (ex-ample: the shape is a cube), then in a second quantitative step, a measurements is made (example: the side of the cube is 20 mm). If the shape is not a cube, the model will not be accurate, even if the measurement of one of the edge is excellent.
An ideal set of tools would allow to:
• Design or choose models (decide about the number of di-mensions and parameters).
• Measure the quality of the fit (decide about the adequacy of the model, interpret the differences).
• Compare the results with other models.
• Offer tools to improve models (refine their geometry, add new dimensions)
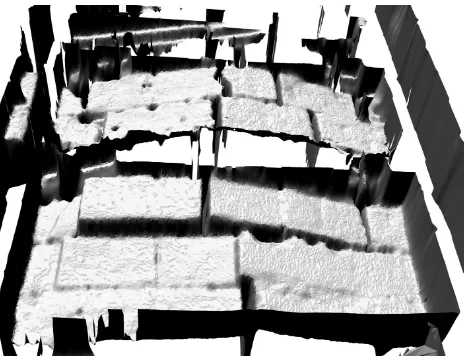
Operations do not have to occur in that sequence. It is also a po-tentially never ending process. Data can be explored to get hints about suitable models. The large quantity of data acquired by laser scanners make this approach easier today (Figure 1). In that perspective, laser scanners are rather data providers than model providers. Models produce but also require understanding and understanding requires time, reduction of the number of param-eters, categorisations. The current excitement around laser scan-ners and their extraordinary possibilities often lead people to for-get that it takes time and human brains to turn data into knowl-edge.
Figure 1: Analysis of the deformation of a wall, Baalbek, Lebanon. Horizontal deformations are magnified 10 times. In-teractive analysis of a data set, trying to understand and model the deformation.
The features list for a set of tools presented above was qualified “ideal” because it is still a vision for the future or a programme. It is certainly not yet fully implemented. The possibility to easily define flexible models and to fit them to measurementsin-situis a very complex matter.
4 IN-SITU MEASUREMENTS
In the author understanding, Conservation of Built Heritage is deemed necessary because:
• Values are attributed to an object (historical, artistic, eco-nomical, etc)
• Values are underthreat(development, disasters, ageing, obliv-ion, etc).
Documentation has a key clearly a role in “measuring” both val-uesandthreats.
Conservation actions try to find an optimum balance between statu-quo(conservation of the values) and changes (mitigation
of the threat). In a society, actions are actually decided in a larger perspective, which includes considerations about manage-ment, developmanage-ment, tourism, sustainability, creation of values and many other aspects that introduce new terms in the equation (the “Strategic Programme Objectives” of UNESCO are very clear in that respect). The issue is political (in a noble sense, related to choices): what place is given in our society to Cultural Heritage? An instrument of development? A window on our past? Some-thing to design? According to the CIPA charter, recording is ”one of the principal ways to give meaning, understanding, definition and recognition of the values of the cultural heritage” (ICOMOS, 1996). This is probably a good technical definition which can sat-isfy tenants of opposite opinions about the meaning of our built heritage.
The emphasis forin-situmeasurements is political in that sense: learn from the past (from an existing object), rather than design for the future (or for the least, contribute to the identification of the associated values). Historical values (Art history, technolog-ical history, traces of events) are often associated with rarity and rarity certainly commands caution. There is a high risk to use common frame of thoughts to approach an object which by def-inition is different. If we care about these values, and want to maximise the chance to identify them before deciding about their fate, it is critical to compare our models with the artefact. It is important to have the possibility to compare, refine, approach, refute, interrogate, i.e. to work on the site (nothing new for an archæologist or a scientist).
The quality of the decisions affecting our built heritage depends of the quality of of the measure of values and threats. If we care about historical values,in-situmeasurements is the way to go.
The tools developed try to facilitate the treatment of the data acquired with total stations, laser scanners, photographs on the site. They include tools to control the instruments, to visualise the data, to integrate data coming from different sources, to build models, to compare them. This is a work in progress, new expe-riences introduce new needs.
5 SOFTWARE TOOLS DESIGN
The documentation process typically involves a large number of actions. Data is acquired, using a variety of sensors (total stations, cameras, laser scanners, gps — tape measures). It is then pro-cessed, organised, interpreted. The objective is to bring meaning to the object under investigation, to create knowledge. Actions are related to each other by a – sometime complex – network of relations (Figure 2). This pattern is certainly not specific to the documentation process.
The design of the tools presented was inspired by theUnix phi-losophy(Raymond, 2003), a loose set of principles or rules drawn to improve the efficiency of similar “information“ processes, of-fering flexibility and power to both users and developers. Among the principles followed, we can mention: modularity, simplicity, clear interfaces, easy connections, use of text files. The OS used to develop and test the tools are FreeBSD and Linux (many of them would also work under windows).
Figure 2: Example of setup: 3 computers, 2 total stations and 1 camera.
% translate 100. 0. 0.<column.tri|rotate 0. 0. 90.| tri2dxf -l column>column.dxf
Chain of actions can be recorded in script files keeping track of partial or whole processes. Files can (should) be documented to achieve transparency, facilitate reuse in similar context or repro-cessing if better data becomes available. Typically, new com-mands are mixed with common Unix comcom-mands like ’sed’ or ’awk’ to process text files, ’socat’ for network connections. In more complex situations, a concurrent versions system (CVS) like git (GIT, 2013) can easily be used to keep track of the changes made in files, facilitate collaboration, resilient storage and future reuse. Great attention was given to make it very difficult to loose data.
Other tools are designed as Tcl libraries. Tcl is a general pur-pose scripting language which makes it easy to “glue” programs, instruments or computers together to achieve complex tasks and, with its extension Tk, to create graphical user interfaces. The new Tcl libraries define objects (geometrical elements like points or circles, 3D visualisation windows, system of units) and allow to manipulate them (move, compute shortest distances, surface, export to files).
Programs, libraries and scripts are developed in C++, Tcl/Tk and shell scripts. Whenever possible, existing libraries are used, chiefly VTK (Kitware, 2013b) for the visualisation and VxL (VxL, The Vision-Something-Libraries, C++ Libraries for Computer Vision Research and Implementation, 2013) for photogrammetric com-putations and optimisation.
6 DATA ACQUISITION
All surveying techniques have limitations. Even if, in theory, they can provide a complete and everywhere accurate set of measure-ments, this is rarely the case in practice.
Hand measurements are often difficult because of accessibility problems (high facades, roofs, vaults) but they are still efficient to survey smaller architectural elements like doors, windows or mouldings for instance. Even if they produce data at a slower path, they somehow imply a parallel progression of data acquisi-tion and understanding.
Total stations, laser scanners and photogrammetry have also their limitations. The first one is related to the completeness of the data set. Only the parts of the object visible from the station of
the instrument can be measured. Many architectural elements are designed to produce shadows which contribute to the character of the work. A complete survey of their geometry would often re-quire an impractical number of stations. Capitals, pediments and mouldings are particularly difficult elements to measure. Another limitation is related to the sampling process. Laser scanners, like CD recorders, attempt to produce an image of a continuous pro-cess. But there is no such thing as continuous recordings. Doc-umentation is always a process of discretisation. As it is well known from theNyquist-Shannon sampling theorem, the high-est frequency that can be recorded depends of the sampling rate. This is true in time and in space. Laser scanner measure points, they often fail to record accurately edges and fine details. If auto-matic processes are used to produce surfaces from the point mea-surements, there is also a risk of aliasing. Dealing with electric signals, it is customary to pass the data though filters before sam-pling to eliminate non interesting frequencies (above the limits of perception), avoid aliasing and moire patterns. This is not often practical with laser scanners. In theory, these limitations can be overcome: increasing resolution and number of stations. In prac-tice, it is often more efficient (in time, resources and money) and interesting to consider that these techniques provide data (mea-surements) rather than models (section 3). Other techniques, and workin situcan help understanding the object and finalising the process of models construction.
The approach here advocated is designed with the idea that it is not possible to decidein abstractowhich technique and approach will be the most efficient. It is therefore better to provide a flexi-ble framework which can easily integrate data coming from vari-ous sources.
6.1 Total Station / Laser Scanner
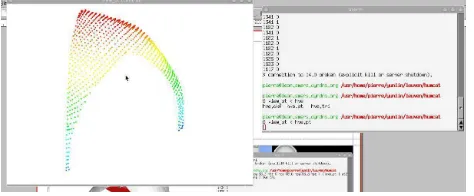
The use of a total station to measure masonry vaults is at the ori-gin of many of the tools developed. To model the surface of the web of a vault (an object of great interest to the author), numer-ous points have to be measured (typically a few thnumer-ousands). It is sometimes difficult to identify the main characteristics of the geometry before actually measuring it. It is also difficult not to forget some areas. Tools were developed to allow a real-time con-trol of the measurements (Figure 3). A module concon-trol the total station from a computer (in Tcl/Tk) using the serial port (possibly via Bluetooth or wifi). Measurements can be triggered from the instrument or from the computer.
Data is typically sent to a visualisation module where points are seen in 3D. The module offers various function to navigate the data, organise it in layers, export it to various formats, import reference data. All actions are recorded in log files.
Figure 3: Real-time control of the total station measurements.
The module controlling the total station allows choosing the type of measurement. We commonly use points, lines and rays. Points are also used to measure surfaces. It is possible to create surfaces directly but to see the points in the 3D windows actually gives a clearer feedback. External tools were developed to create tri-angular meshes from point clouds (and also to manipulate point clouds and triangle files). Rays are line segments starting from the instrument and going to the point measured by the total sta-tion. They are useful to measure edges for which total stations often fail to return the exact distance. They materialise the an-gle measured (one or two points close to the edge can then be measured to get a good estimate of the distance).
In some cases, it can be useful to send the data to a CAD pro-gram like AutoCAD. This does not allow to navigate through the 3D data as fast as with the visualisation module but it provides a richer set of commands. To work on the model of Figure 4, the total station was connected to a small laptop computer run-ning the software to control the total station and a visualisation window to give a direct feedback to the operator. In parallel, the data was sent to another computer set on a table where a col-laborator was using AutoCAD. When ready, he requested new measurements from a buffer running on his computer. Some fine details like mouldings, were measured by hand, others using pho-tographs (next sub-section).
Figure 4: AutoCAD used with acad.tcl server module.
We often use the word ’can’. The point is that the process is meant to be flexible. In some circumstances, it make sense to or-ganise a complex setup. In others, just one or two tools can be used. The possibility of real-time control actually often result in a faster setting of the instruments. Complex and repetitive setups can also be prepared in advance and launched with a few clicks . Tcl/Tk makes it easy to ”glue“ programs and prepare user inter-faces.
In line with the discussion made on models (section 3), programs were developed to fit measurements (point clouds) and models: find robust fit to a specific shape (line, plane, circle, sphere, cylin-der, cone) or model rib-like elements. A future line of develop-ment will be to try to offer tools to fit more complex parametric models to measured data.
Most of these tools can be used (and were used) with laser scan-ner data (Figures 1, 6).
6.2 Camera
Photographs carry a lot of information. They are fast, cheap and relatively objective. They record dimensions invisible to total sta-tions or other instruments: colours, shades, deterioration. They
can also be used to extract geometrical information and to vali-date models.
Tools were developed to control cameras from a computer [us-ing gphoto (Gphoto, digital camera software, 2013) and Tcl/Tk], correct the radial distortions, calibrate cameras, extract exif data. In a typical setup, a photograph is taken, the distortions corrected and the image is sent to a visualisation module where points can be marked on the 2D image and from which the total station can be triggered to measure the 3D position of the point. Using, this data, the position and orientation of the camera is computed. This data can then be used to ”wrap“ the photograph on a 3D model (Figure 5), to project model features on the photograph (useful to control the model)
Figure 5: Projection of a photograph on the 3D model of a vault, section through the model to draw isolines. Humelghem, Bel-gium.
Alternatively, images can be processed (automatically or man-ually) using Gimp (GIMP, GNU Image Manipulation Program, 2013), Photoshop or other common software programs to prepare interpretative images (materials, deterioration, historical phases). In this way, the idea is not to produce a unique, static 3D model but rather to produce information from data sources which can be combined or compared in various ways.
Simpler programs were also prepared to compute and prepare ho-mographies which are fast and efficient to measure plane objects.
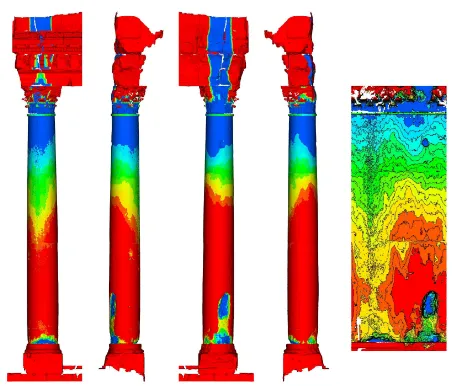
Presentation documents (say a 1/20 facade detail) can be pre-pared using scripts, which assemble pieces of geometrical data (possibly moving, rotating or cutting it), project images or colour the model according to some measurements. These possibili-ties were used to study the structural pathology of construction in the archæological site of Baalbek (Smars et al., 2012, Smars, 2012). The geometrical data was acquired by a laser scanner (Van Genechten et al., 2011). The use of scripts makes the preparation of new documents from new laser scanner measurements trivial, making a monitoring of the deformations easy (Figure 6).
7 CONCLUSIONS AND FUTURE WORK
Figure 6: Analysis of the shape of a column of the temple of Jupiter, Baalbek, Lebanon.
in-situdocumentation of built heritage. Some of the key features are: open source code, ease of usein-situ, flexibility.
This is a work in progress. Changes and improvements occur as new needs arise. Some tools have been extensively used and are now stable and robust, others are still experimental and need more testing. Collaboration is welcome. The approach advocated is not yet fully effective. In practice, there are still bottlenecks, missing pieces, especially when dealing with new situations. It is not yet always possible to do as much work as we would like on the site. This is often due to logistics: time, infrastructure (sometimes trivial matters like table, umbrellas) and personnel are critical in practice. More attention is currently paid about the documentation of the various tools to encourage the use of the tools by new users.
In well-tested scenarios, like the measurement of vaults (Smars and De Jonge, 2009) or the documentation of structural pathology (Smars, 2012), the workflow is now smooth and fast.
ACKNOWLEDGEMENTS
The software tools and the methodology presented in this paper were developed in the framework of research projects at the Uni-versity of Louvain in Belgium, at the UniUni-versity of Bath in UK and at the National Yunlin University of Science & Technology in Taiwan, in collaboration with numerous researchers from these Universities. The projects were financed by various national and international institutions.
REFERENCES
GIMP, GNU Image Manipulation Program, 2013.
http://www.gimp.org/.
GIT, 2013.http://git-scm.com/.
Gphoto, digital camera software, 2013.
http://www.gphoto.org/.
ICOMOS, 1964. International charter for the conservation and restoration of monuments and sites (the Venice Charter). Avail-able onhttp://www.icomos.org/.
ICOMOS, 1996. Principles for the recording of mon-uments, groups of buildings and sites. Available on
http://www.icomos.org/.
Itseez, 2013. OpenCV, the Open Computer Vision Library.
http://opencv.org/.
Kitware, 2013a. Paraview.
http://www.paraview.org/.
Kitware, 2013b. VTK, the Visualization ToolKit.
http://www.vtk.org/.
Latimer CAD, 2013. TheoLT.http://www.theolt.com/.
MeshLab, 2013. http://meshlab.sourceforge.net/.
Panotools, 2013.
http://panotools.sourceforge.net/.
Raymond, E. S., 2003. The Art of Unix Programming. Addison-Wesley.
Smars, P., 2008. Documenting architectural heritage, look-ing for a balance between automation and control. Journal of Cultural Conservation Science, Taiwan pp. 3–10. Available at http://smars.yuntech.edu.tw/papers/jccs0.pdf.
Smars, P., 2010. Surveying software tools for para-metric modelling of architectural heritage. In: 2010 International Symposium on Cultural Heritage Conserva-tion, December 5-8 2010, Tainan (Taiwan). Available at http://smars.yuntech.edu.tw/papers/tainan2010.pdf.
Smars, P., 2012. Values - Threats . . . and Uncertainty, Baalbek (Lebanon). In: International Conference on Conservation and Adaptive Reuse of Cultural Proper-ties, Taizhong (Taiwan), To be published. Available at http://smars.yuntech.edu.tw/papers/taizhong2012 smars.pdf.
Smars, P., 2013. Points&Forces, software tools facilitating the task of surveying architecture. http://sourceforge.net/projects/pointsforces/.
Smars, P. and De Jonge, K., 2009. Geometry and construction techniques of gothic vaults in brabant (belgium). In: K.-E. Kurrer, W. Lorenz and V. Wetzk (eds), Third International Congress on Construction History, Cottbus (Germany), pp. 1347–1354.
Smars, P., Balen, K. V. and Nuyts, K., 2001. Layered Geo-metric Information System. In: 18thInternational Symposium CIPA 2001 (Surveying and Documentation of Historic Buildings - Monuments - Sites Traditional and Modern Methods), Potsdam (D), September 18- 21, pp. 462–68.
Smars, P., Seif, A. and Santana, M., 2012. Archaeological site of Baalbek, defining the structural risk. In: ICOMOS Sympo-sium 2012 - Reducing Risks to Cultural Heritage from Natural and Human-Caused Disasters, 27 October 2012, Beijing (China), To be published.
Stevens, S., 1943. On the Theory of Scales and Measurements. Science 103(2684), pp. 677–680.
UNDP, 1997. Good governance - and
sus-tainable human development. Available from
http://mirror.undp.org/magnet/policy/.
Van Genechten, B., Santana Quintero, M., Seif, A. and Ghattas, G., 2011. Laser scanning the past for the future. COTJournal 1/2, pp. 252–267.
VxL, The Vision-Something-Libraries, C++ Libraries for Computer Vision Research and Implementation, 2013.