A Boolean approach to the measurement of group processes
and attitudes
The concept of integration as an example
* Rudi Janssens
Centrum voor Vrouwenstudies, Vrije Universiteit Brussel, Pleinlaan 2, B-1050 Brussels, Belgium
Abstract
Most social research involves comparison of some sort. Numerous tests are developed to examine if a person A is, for example, more intelligent or more creative or more stressed than a person B. Nevertheless, researchers not only compare cases but also want to make some statements on the group level. This article focuses on this type of problem. As an example, the process of cultural integration is discussed. My aim is to compare the evolution of the integration process between different Islamic minorities confronted with a Western value system. Starting from a set of individual response patterns, indicating the presence or absence of a set of attitudes referring to this aspect, a Boolean approach to analyse and compare group behaviour is developed. First, a formal approach of the process of integration is presented. Afterwards, the methodological tool is described. Finally, an example illustrates some possibilities of the Boolean approach.
1999 Elsevier Science B.V. All rights reserved.
Keywords: Cultural integration; Boolean approach; Attitudes; Group processes
1. Integration: a formal approach
One of the most important research topics in contemporary sociology is the adaptation of specific cultural minorities to the norms and values of the modern urban industrialized society. Whether this process is defined as a shift between cultures or as a shift from tradition to modernity, most theories emphasize the variability of the individual attitudes in reaction to the confrontation with a different value system. A person does not become integrated by switching immediately from a traditional to an integrated attitude. This process contains at least several stages of integration, depending on the creativity and
*Tel. / fax:132-26-292-582
E-mail address: [email protected] (R. Janssens)
flexibility of the individual. Not only the personal characteristics but also the nature of the minority group itself plays an important part in this process of change. The influence of the group one belongs to determines the range of possible changes. One may assume that a group with a similar cultural background shows similar attitudes. A core set of dominant attitudes within a group is called the group norm. This norm may allow for deviations or not: within a coherent group, the possibilities of change will be restricted; where as in a loose group, increasing complexity in a greater variability of possible attitudes. In light of the above considerations, integration can be defined as ‘a one-way
learning process, whereby somebody gradually closes the gap between the native culture
of the land of origin and the culture of the society he or she lives in, depending on the
1
adaptability of the individual and the group he belongs to’.
The attitude of a particular person is measured by a set of items covering different aspects of integration. As a result, each person is characterized by a pattern of co-occurring features, referring to the presence or absence of these aspects. This binary pattern, written as a vector with a fixed order of the items, is called a response pattern. More formally:
attitude reflected in i , then ij j,h51 and if a respondent h does not agree with the attitude reflected in i , then ij j,h50.
Since the relation between the indicators is unknown, one may assume that if the response pattern of respondent h contains more positive responses than the response1
pattern of respondent h , then h is considered to show a ‘more integrated attitude’ than2 1
person h . So, the arithmetic sum s2 h5o1#j#n j,hi is defined as the degree of integration. Before groups can be compared, a standard (or ‘group norm’), derived from the various attitudes of the individual group members, must be constructed. Two possible subsets of members can easily be identified: those with a response pattern containing all 0s reflecting a traditional position, and those characterized by a response pattern containing all 1s referring to an integrated position. The main problem lies in representing the evolution between both positions, an evolution typical for the group under study. Working with real life data, most respondents are characterized by a response pattern showing a mixture of 1s and 0s. The only information that one can derive from such a pattern is the degree of integration as a vague indicator of its position in relation to the concept of integration. What one actually wants to know is its position in relation to the other response patterns. In other words, one wants to know how the integration process between the traditional and integrated positions is structured.
The definition of integration provides the materials for a formal approach to the integration process. A first important element is the fact that integration is defined as a
1
one-way process. This assumption is based on previous research findings among similar and even relatively more closed minority groups stressing the adaptation of the group to the peremptory demands of the cultural majority (see e.g., Mugny, 1982; Levine and Moreland, 1985; Bar-Tal, 1990; Lesthaeghe, 1997). This does not exclude an individual regressive transition. However, such regression seems to be an exception to the rule that a cultural minority almost inevitably evolves into the direction of a more integrated position. Another essential element is the gradual evolution of the process. This implies that the degree of integration is supposed to increase only one unit at a time. The fact that the degree of integration increases or not depends on both the individual and the group he belongs to. This means that some aspects are more prone to change than others. An example illustrates the mechanism behind the way the process of integration is structured. Suppose a set of indicators I5hi , i , i , i1 2 3 4jand a set of respondents H5hh ,1
h2j, and
respondent h is characterized by the response pattern (1000),1
respondent h is characterized by the response pattern (1110).2
If we are interested in the evolution of the attitude of person h , two possibilities may1
occur:
1. h does not change his attitudes since he only agrees with the common indicators1
2. h does change his attitude influenced by the attitude of h .1 2
According to the definition of integration, h does not change his attitude.2
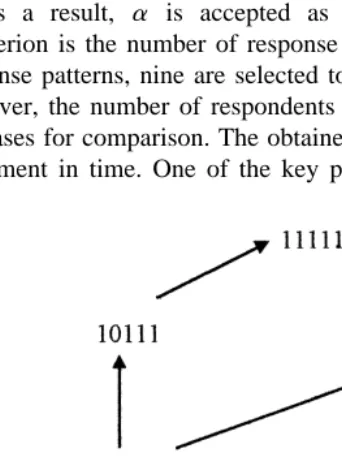
If h changes his attitude, he will first evolve towards a position characterized by the1
response patterns (1100) or (1010), before he can reach the position on which h is2
situated. Fig. 1 illustrates the possible evolution of h .1
If within our group of respondents H, only two possible response patterns are found, namely (1000) and (1110), Fig. 2 presents the structure of the integration process of that group.
Fig. 2 demonstrates that there are two possible ways to move from a traditional to an integrated position: from (0000) over (1000), (1100) and (1110) towards (1111); or from (0000) over (1000), (1010) and (1110) towards (1111). In accordance with graph theory, these ways are defined as the paths of the integration process. Although within the dataset only two response patterns are found, the corresponding structure is composed of six different patterns. The response patterns characterizing the respondents
Fig. 2. Digraph representing the integration process of group H.
are called actual patterns. The other component patterns are called possible patterns. Both the traditional (0000) and integrated position (1111) are included by definition.
The previous example presents the possible attitude changes in the case only two response patterns are observed. Usually, more patterns will be found. In this article, a method based on the Boolean analysis of questionnaires (Flament, 1976) is introduced which enables one to structure the integration process based on a large set of response patterns.
2. Boolean analysis: the method
‘Boolean analysis’ is used as a collective name for those methods based on the translation of research problems into a Boolean framework, and by solving them by
2
applying the axioms and theorems of Boolean algebra. Based on the work of Flament (1976), the method is used here to illustrate its applicability for structuring the indicators of the integration process. Boolean algebra entails the possibility of introducing a partial order relation within the set of indicators. In fact, Boolean analysis enables one to deduce a unique structure representing the integration process of a particular group such that the structures derived from different datasets can be compared. For this purpose, two Boolean principles are used: Boolean minimization, and Boolean implication. Before presenting the method, some notions need to be introduced.
Every respondent is characterized by his response pattern, an ordered n-tuple representing the attitude of the respondent towards a set of items. In Boolean terms, such a pattern is called a Boolean expression, while an item is called a generator. The raw dataset, including all response patterns, is called the set of primitive Boolean expres-sions. Boolean analysis also deals with subpatterns of the response patterns, representing the responses on a subset of the set of items. If one takes the response pattern (1000) as an example, the subpattern referring to the first three items or the pattern referring to the first, third and fourth item, are both written as (100). To avoid possible ambiguity, the items can also be represented by letters so that a positive response is written as a small letter and a negative one as its complement. Referring to the example, (1000) can be written as ab9c9d9 and the subpatterns as ab9c9 and ac9d9. The Boolean term for a pattern is a fundamental product. If this pattern contains information about all the items,
2
it is called complete. So in Boolean algebra, the set of response patterns corresponds to a set of complete fundamental products.
On every set of generators G5ha, b, c, . . . , nj, having a value of 1 or 0, two binary operations ^ (Boolean product) and % (Boolean sum) and a unary operation 9
(complement) are defined which act on any generators a and b in G according to the following truth tables (Table 1).
2.1. Boolean minimization
A first basic feature of Boolean analysis, as a data analytic approach, is the principle of Boolean minimization. It refers to algorithms that construct equivalent Boolean expressions for a given expression, in such a way that a unique expression using a minimum of symbols is obtained. The basic idea is to reduce a set of primitive Boolean expressions to a smaller number of Boolean expressions describing the original set. Boolean minimization can be defined as follows.
Consider a set of Boolean expressions C, each expression being a complete fundamental product. If two complete fundamental products, c and c , differ according1 2
to only one generator (which is included complemented in c and uncomplemented in c1 2
or vice versa), this generator can be removed to create a simpler expression q composed of the common generators. This new expression q is included in the two complete fundamental products: q%c 5c and q%c 5c . In that case, we say that the
1 1 2 2
fundamental product q covers both complete fundamental products c1 and c . By2
repeating this process of minimization, one obtains a set of subpatterns for which no further minimization is possible. This set of subpatterns is called the set of prime implicants. Every set of Boolean expressions C can be reduced uniquely to a set of prime implicants. An example illustrates this principle.
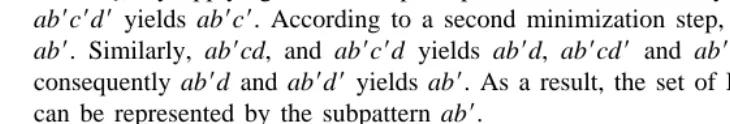
Suppose a set C of complete fundamental products, and C5hab9cd, ab9cd9, ab9c9d, ab9c9d9j. By applying the above principle, ab9cd9 and ab9cd yields ab9c, ab9c9d and ab9c9d9 yields ab9c9. According to a second minimization step, ab9c and ab9c9 yields
ab9. Similarly, ab9cd, and ab9c9d yields ab9d, ab9cd9 and ab9c9d9 yields ab9d9 and consequently ab9d and ab9d9 yields ab9. As a result, the set of Boolean expressions C can be represented by the subpattern ab9.
Summarizing, every set of response patterns can be reduced to a set of subpatterns characterizing the original dataset; this set of subpatterns covers the whole dataset, so that by knowing the set of prime implicants, the original dataset can be reconstructed.
Table 1
Truth tables for the Boolean operators^,%, and9
a b a^b a%b a9
1 1 1 1 0
1 0 0 1 0
0 1 0 1 1
2.2. Boolean implication
Boolean minimization does not provide a structure, it only offers a way to reduce a set of Boolean expressions to a more condensed and workable form. By defining an order relation on the basis of prime implicants, Flament (1976) provides the stepping stone between this condensed form and a structured set of indicators.
Flament (1976), starts from the set of all possible response patterns, whether they appear in the dataset or not. The theoretical set of all possible patterns is called R, so that:
R5hpiu pi5pattern i with a frequency fij.
0
These response patterns can be divided into two sets: R the set of patterns with
*
frequency equal to 0, and, R the set of actual patterns with non-zero frequencies:
0
Any given response pattern will be an element of one of these two sets, i.e. R5R <R .
0
*
Because both sets are mutually exclusive (R >R 5[), information about one of the
0 0
* *
sets is sufficient to reconstruct the dataset: R 5R\R and R 5R\R .
Instead of starting from the set of actual patterns, Flament (1976) looks for the set of
0 0
prime implicants of R . A prime implicant of the set R is called an ultimate canonical projection (PCU). As a consequence, the set of PCUs covers all patterns which are not observed among the respondents. In other words: if ab is a PCU, then nobody answered both a and b positively. In the case of integration, if ab is derived as a PCU, somebody who shows attitude a, will never show attitude b. So, Flament (1976) concludes that a implies b9 (written as: a→b9). A PCU however, yields more information than a particular implication. If ab9is a PCU, then one also knows that if somebody answers
b9, he will not answer a, so the implication b9→a9holds as well. In general, a PCU of
k
length k generates 2 22 equivalent implications. Every non-empty subpattern of a PCU implies the Boolean sum of the complemented responses of its remaining literals. Of course, an implication does not reflect a causal relation between the indicators but gives some information about their co-occurrence.
The goal of using Boolean analysis is to represent the data as a hierarchical structure. From every PCU, a set of equivalent implications can be derived. By selecting one
*
implication per PCU and chaining them into one structure, R can be represented in one scheme. Such a representation, Flament (1976) calls an implication scheme. Because he also proved that implications are reflexive, antisymmetric and transitive, a partial order is defined on the responses. An example shows how implication schemes can be constructed.
0
Suppose R 5habcd9, abc9d, ab9cd, abc9d9, ab9cd9, a9bcd9, ab9c9d, a9b9cd9, a9bc9d9,
ab9c9d9j. As a result of Boolean minimization, the set of PCUs5hab9, ac9, ad9, cd9,
Table 2
232 contingency table of items a and b based on the presence or absence of the items
b9 b
a9 1 1
a 0 1
subpattern is observed, it is indicated by 1, if this subpattern is not observed, it is indicated by 0.
If a person responds negatively towards item a, both options b and b9are plausible. Knowing somebody answers a9does not say anything about the answer of that person on indicator b. If he has responded positively towards a, he has also responded positively towards b. So, if a is given as an answer, b has been given as well. As a result: a→b. If he has responded negatively towards b, he has also responded negatively towards a. So, if b9 is given as an answer, a9 has been given as well. As a result: b9→a9. One may notice that, if the cell in the contingency table referring to a9b would be zero, a9b would
also be a PCU so that the implication b→a holds as well. In that case, an equivalence relation a↔b is found. If no zero-cells are detected, the relation between both indicators cannot be specified.
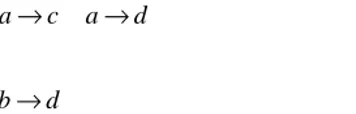
To obtain a hierarchical structure, the method requires one to choose one implication out of the set of possible implications for each PCU. According to the subject under investigation, a choice is made. On the one hand, Boolean analysis does not provide the researcher with a unique solution, on the other hand, he has a restricted autonomy to select several solutions without violating the methodological principles. In the current subject, where a set of indicators of integration is selected and evaluated based on their presence or absence, it is interesting to select those implications indicating the presence of an indicator. According to this criterion, the following implications are selected:
a→b a→c a→d
c→d b→d
The resulting implication scheme is presented in Fig. 3.
By applying the above principles, Boolean analysis enables one to represent every dataset as a partially ordered set of indicators. Nevertheless, the fact that the solution is not unique illustrates a possible weakness of the method.
3. Boolean analysis and the measurement of integration
The interesting feature of the Boolean approach is the translation of a set of response patterns into a hierarchical structure. But the method has its weaknesses as well. The first problem concerns the obtained structure. Although Boolean analysis results in an implication scheme, there is no guarantee that the obtained scheme results in a structure that suits the formal description of the process under investigation, in this case cultural integration. Moreover, an implication scheme yields a partial order defined on the separate items, while we are looking for a representation describing a structure composed of response patterns. A second problem mentioned above is the fact that the resulting structure is not unique, which makes a comparison of different structures quite difficult. Both problems are discussed herein.
3.1. Calculating PCUs and structuring the process of integration
Boolean analysis results in a set of equivalent implication schemes, while the substantive nature of the integration process may suggest only certain of the schemes. How can one be sure that the resulting structure fits the required conditions? A solution for this problem is suggested by the theory of knowledge spaces that provides a mathematical translation of the process of knowledge aggregation (for an introduction, see Falmagne et al. (1990)). Although this theory is applied within a different context, it is looking for a similar structure that meets the formal description of the integration process.
According to Degreef et al. (1986), a knowledge structure is a pair (X,k), where X is a set of questions, andk is a family of subsets called knowledge states. A knowledge structure is called a knowledge space if both the set X and the empty set[are states and if every union of states is a state. For the aggregation of knowledge, Doignon and
3
Falmagne (1985) are able to generalize Birkhoff’s Theorem and prove that if a knowledge structure, and as a consequence a knowledge space, is closed under union and intersection, it is well-graded. This means that starting from the [-state, by increasing from one level to another, every response pattern situated on level l can be reached by adding just one positive response to a response pattern situated on level l21. This condition meets the gradual aspect of the process of integration. Theuns (1992) proved that there is a one-to-one correspondence between a set of PCUs consisting each of one positive and one negative response and the family of knowledge spaces that are closed under union and intersection. Considering the correspondence between union and intersection on the one hand, and Boolean sum and Boolean product on the other hand, one may conclude that, if the original dataset can be represented by a set of PCUs of the form xy9 or x9y, one obtains a structure that meets the conditions for structuring the
process of integration. The fact that all these PCUs have length 2 results in only two equivalent implications. Because the set of PCUs only consists of PCUs with one
3
For any set X, the formula xQ y iff ( y[K implies x[K for all K[K), defines a 1–1 correspondence between
positive and one negative response, all implications can be written either as x→y or as y9→x9(or otherwise x9→y9or x→y). This results in an implication scheme with only
positive or only negative responses. This implication scheme corresponds to a unique set of response patterns. These patterns can be represented in a digraph with the source describing the traditional state with all negative responses and the sink describing the integrated one with all positive responses. All response patterns are situated between these two states. Starting from the source, the different arcs connect the response patterns such that the corresponding degree of integration always increases by 1. All response patterns found on each path represent a total ordered scale.
3.2. Obtaining a unique solution
Boolean analysis results in a set of PCUs. Looking for a well-graded structure, not all PCUs are accepted. By reconstructing the set of response patterns corresponding to the
0
*
selected PCUs, possibly some response patterns of R are treated as if they belong to R .
0
*
The division of the set of all possible response patterns R into R and R is no longer based on the presence or absence of that pattern, but on the selection of the PCUs. Such a ‘deviation’ is called a dichotomization methodx. The set of response patterns obtained
*
by applying this dichotomization method x is called R . The response patternsx *
belonging to Rx are defined as accepted response patterns. Those patterns moving from
0 0
*
R to R are defined as rejected response patterns and belong to R . In this case, thex
dichotomization is based on the definition of the integration process. Alternatively, dichotomization methods can also be based on mathematical criteria, for instance the frequency of appearance of the response pattern (see Flament, 1976; Van Buggenhaut and Degreef, 1987; Theuns, 1992).
Looking for PCUs of length 2, implies the evaluation of the relation between two indicators. Suppose two indicators i and j, withp representing the frequencies denoted by the indices (see Table 3).
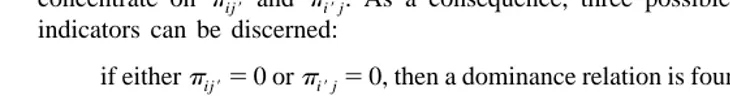
According to our dichotomization method, only PCUs of length 2 are accepted, so we concentrate on pij9 and pi9j. As a consequence, three possible relations between the indicators can be discerned:
if eitherp 5ij9 0 orp 5i9j 0, then a dominance relation is found
if bothp 5ij9 0 andp 5i9j 0, then an equivalence relation is found
ifpij9±0 andpi9 ±0, then the relation between both indicators is not specified.
j
Table 3
232 contingency table of items i and j based on the frequency of appearance of the items
j9 j
i9 pi9j9 pi9j pi9
i pij9 pij pi
If a dominant relation is found, either i9j or ij9is a PCU. If an equivalence relation is found, both i9j and ij9are PCUs. In sociology, working with large datasets,pij9 or pi9j
are seldom 0. The reason can be twofold: somebody can make an error by responding to the interviewer, or somebody may show a deviating attitude uncommon for the group he belongs too. Consequently, the straightforward dichotomization at zero frequency does not result in a satisfactory solution because one rarely finds ‘pure’ dominance or equivalence relations. Therefore, an additional criterion is needed to decide about whether the frequency of appearance ofpij9orpi9jcan be considered as 0 or not. Such a criterion is defined as the dichotomization threshold a. The theory of integration does not provide us with such a criterion, so a mathematical criterion remains as the only possible solution. There are two options to evaluate the relation between both indicators. One may focus on a dominance relation and decide about a fixed thresholdasuch that if eitherp # aij9 orp # ai9j , the proportion smaller thana is considered as 0. A problem with this kind of rigid criterion occurs when one of the frequencies is situated just above
a and the other one is less than a. In that case, a dominance relation is ‘forced’, notwithstanding both frequencies are quite low. Consequently, a lot of meaningful response patterns might be rejected. A second possibility is to decide about equivalence first, making a decision about both frequencies at the same time. In fact, one has to decide about the impact of dropping a given proportion (p 1 pij9 i9j) of the population. Depending on this decision, a is calculated. The pros and cons of the first option are already described in detail (see Flament, 1976; Van Buggenhaut and Degreef, 1987; Theuns, 1992). In this article, the second option is discussed.
In general, the search for a dichotomization thresholda can be described as follows:
Step 1. one has to decide about equivalence or not.
• If the relation between i and j is declared an equivalence relation,a $maxhpij9,pi9jj
and (p 1 pij9 i9j) is declared 0.
• If the relation between i and j is considered non-equivalent, neitherpij9 norpi9j are declared 0. As a result, all a ,minhpij9, pi9jj are possible thresholds.
Step 2. One has to decide about dominance or not.
• If at least one equivalence relation is found, a $maxhpij9, pi9jj and all frequency counts between 0 and maxhpij9,pi9jjare declared 0. In that case, a relation between two indicators k and l is considered as a dominance relation if minhpkl9, pk9lj#
maxhpij9, pi9jj and maxhpkl9, pk9lj.maxhpij9, pi9jj, given the fact that the relation between k and l is not equivalent.
• If no equivalence relation is found, a fixed a must be calculated by some other consideration (see later).
structure that represents our dataset. The dichotomization method x has to divide the
0
*
dataset into a set Rx of response patterns belonging to the norm, and a set Rx of response patterns that are not accepted or only manifested by a limited number of members. Thus, one has to decide whether or not the attitude marked by a possible PCU (i.e. every pair of indicators ij9 or i9j, being subpatterns of some response patterns)
belongs to the norm. In a very loose group, one will find a greater variety of possible attitudes than is the case for a more coherent group. In statistical terms, the different attitudes on the traditional-integrated continuum can be conceived as an unknown distribution around the norm, with a coherent group characterized by a small standard deviation and a loose group characterized by a large standard deviation. If one wants to compare both groups, the norm must be based on a similar proportion of the population, and not on a similar set of response patterns. The decision about this proportion can be based on the theorem of Chebyshev. This theorem allows one to determine the minimum proportion of the values that lie within a specified number of standard deviations of the mean. Chebyshev’s inequality states that, if X (in this case, the degree of integration) is a random variable:
2
Pr[uX2E(X )u$kd(X )],1 /k (1)
with E(X ) the expected value andd(X ) the standard deviation of the random variable X. It is possible to rewrite Chebyshev’s inequality in the following words: ‘for any set of
observations (sample or population), the minimum proportion of the values that lie 2
within k standard deviations of the mean is at least 121 /k , where k is any constant greater than 1’ (Mason and Lind, 1990, p. 135). As a result of this theorem, one knows
that at least 75% of the population is situated between the mean and plus or minus two standard deviations, and 88.9% between the mean and plus or minus three standard deviations.
For the measurement of integration, the proportion of respondents situated between the mean and plus or minus two standard deviations is defined as the group norm. As a result, this norm is based on the responses of at least 75% of the population. Because 88.9% of the population is situated between the mean and plus or minus three standard deviations, this proportion is used to decide about equivalence or non-equivalence. If a relation between two indicators is declared an equivalence relation, one is not allowed to drop more than 11.1% of the population. As a result of this decision, the dichotomization threshold a is calculated as follows.
Based on a comparison of all possible PCU’s, one decides whether or not the relation between two indicators is equivalent or not:
• if [12(p 1 pij9 i9j) /m]$0.889 then the relation between the indicators i and j is regarded as an equivalence relation, so that the dichotomization threshold a $
maxhpij9, pi9jj;
• if [12(p 1 pij9 i9j) /m],0.889 then the relation between the indicators i and j is regarded as a non-equivalence relation, so that the dichotomization threshold a ,
• if [12(p 1 pij9 i9j) /m]$0.750 then the relation between the indicators i and j is regarded as a dominance relation if minhpij9,pi9jj#a and maxhpij9,pi9jj.a;
• if [12(p 1 pij9 i9j) /m],0.750 then the relation between the indicators i and j cannot be specified if minhpij9,pi9jj.a.
This first step determines the interval in which a is situated. If the dichotomization thresholda is based solely on the relation between two indicators, it may occur that for different pairs of indicators different respondents are dropped, such that the total number of respondents dropped exceeds 11.1% (in case of equivalence) or 25% (in case of dominance). If such is the case, the pair of indicators on which the decision abouta is based will not be declared an equivalence or dominance relation and the dichotomization threshold will be based on another pair of indicators.
In other words: ;i, j[I: iRj is declared equivalent iff [12(p 1 pij9 i9 ) /m]$0.889,
j
anda results in a solution that holds for at least 88.9% of the respondents. And;i, j[I: iRj is declared dominant iff [12(p 1 pij9 i9j) /m]$0.750, anda results in a solution that holds for at least 75% of the respondents. Still there is a problem when no equivalent relations are found. In that case, one needs to derive a maximum dichotomization thresholda that decides about dominance. This value can also be derived, based on the theorem of Chebyshev. If a is the maximum threshold, and one wants to obtain a solution that holds for at least 75% of the population, the theorem can be written as 122a/m$0.75. As a consequence, a #m / 8. Because m is known, a can always be calculated.
The procedure, as described above results in a set of PCUs that can be presented in an implication scheme. A corresponding digraph indicates the possible stages between the traditional and integrated states, while the orderings reflect the possible (integration) paths between both states.
4. Boolean analysis and the integration process: some examples
These examples discuss only one aspect of the integration process, namely the
4
changing gender relations. The respondents were confronted with the following statements:
(a) A woman always has to obey her husband.
(b) A woman can talk to another man, even when she does not know him. (c) When there are visitors, women preferably retire into a separate room.
(d) Apart from her domestic role, a woman has to play a role in religious, political and social life also.
(e) A woman has the right to work outside the house.
4
The answers are recoded such that a 1 refers to an integrated and a 0 to a traditional attitude.
Here, two examples of the use of Boolean analysis are presented. The first example shows how the group norm of the female Turkish migrant population is determined. In a second example, a comparison between structures is made.
4.1. Women and gender relations: the Turkish case
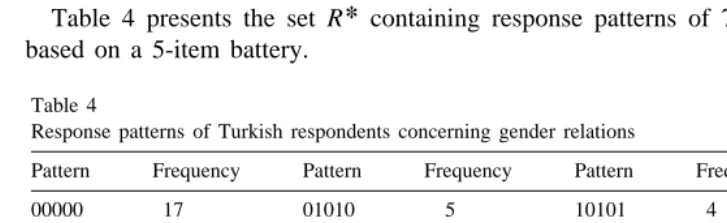
*
Table 4 presents the set R containing response patterns of 773 Turkish migrants, based on a 5-item battery.
Table 4
Response patterns of Turkish respondents concerning gender relations
Pattern Frequency Pattern Frequency Pattern Frequency
00000 17 01010 5 10101 4
00001 39 10001 2 10110 1
00010 30 10010 2 11010 1
00100 5 11000 3 11100 1
01000 3 00111 170 01111 77
00011 185 01011 44 10111 42
00101 20 01101 5 11011 6
00110 8 01110 2 11110 1
01001 3 10011 17 11111 80
First, one evaluates the existence of an equivalence relation. For this purpose, the
Dp-values, indicating the difference between both indicators, are calculated. If the relation between the indicators i and j is considered as equivalent, this difference must be minimal. So the pair of items with a min Dp is evaluated first.
According to the above Table 5, the relation between the indicators d and e results in a minDp of 23. For this particular pair of items, [12(pde91pd9e) /m]50.84. Because 0.84,0.889, the relation between the indicators i and j is regarded as non-equivalent. Not only their difference, but also their sum is the smallest. Because a #m / 8 (i.e.
a #96.625), no equivalence relation is found and the dichotomization threshold a ,
minhpde9, pd9ej, a ,50. The largest possible threshold that does not exceed 50 is 35. Consequently, the set of PCU9is hac9, ad9, ae9, bd9, be9, cd9, ce9j. Fig. 4 presents the
Table 5
Possible PCUs andDp-calculation based on the responses of the Turkish respondents
Pairs pij9 pi9j Dp Sp Pairs pij9 pi9j Dp Sp
ab 68 139 71 207 bd 21 455 434 476
ac 31 287 256 318 be 16 479 463 495
ad 10 521 511 531 cd 35 290 255 325
ae 9 543 534 552 ce 18 296 278 314
Fig. 4. Implication scheme representing the integration process of the Turkish respondents.
*
implication scheme based on the selection of PCUs. From the set of declared PCUs, Rx
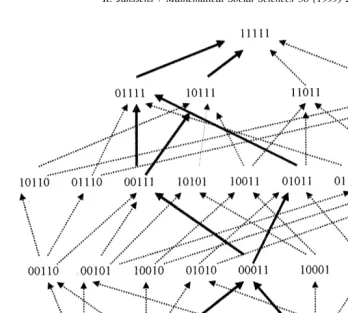
can be derived. According to the definition of the integration process, Fig. 5 illustrates the stages between the traditional and integrated position. Fig. 6 shows the group norm
*
of the Turkish respondents (R ) together with the set of the response patterns of thex *
group as a whole (R ). In this figure, all possible shifts between the traditional and integrated attitude are illustrated. The arrows printed in bold represent the unique solution resulting from the application of Boolean analysis.
Some statistics can be developed to describe this structure. The fit between the obtained structure and the total population can be expressed in terms of the proportion of the population situated on the structure. In this case, the solution holds for 88.7% of the population. As a result, a is accepted as the dichotomization threshold. A next
*
evaluation criterion is the number of response patterns involved. When R contains 27 different response patterns, nine are selected to describe the structure of the integration process. However, the number of respondents and the number of response patterns are not the only bases for comparison. The obtained structure is a reproduction of a process at a given moment in time. One of the key problems behind this research is how the
* *
Fig. 6. Comparison between Rx and R among the Turkish respondents.
evolution from a traditional to an integrated attitude can be described. The answer is given by the number of possible paths between the terminal nodes of the graphical representation. First, the number of paths can be used as an indication of the coherence of the group. Afterwards, the characteristics of the respondents situated on the different positions and paths can be compared.
4.2. The generational evolution of gender relations
In a second example, a comparison between different structures is made. Here, we will restrict ourselves to a comparison based on group coherence. Group coherence refers to the variety of possible attitudes its members show. As a measure of comparison, the number of paths between source and sink of the digraph representation of the integration process is used. Because the way a structure is derived is already discussed in the previous example, only the results are compared.
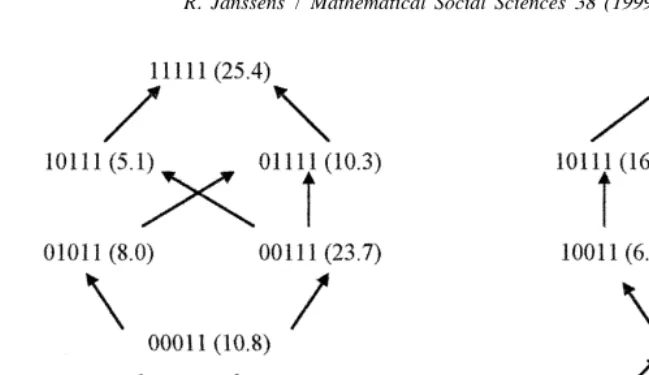
Fig. 7. Comparison of gender relations between Turks (left) and Moroccans (right) ‘First generation adults’.
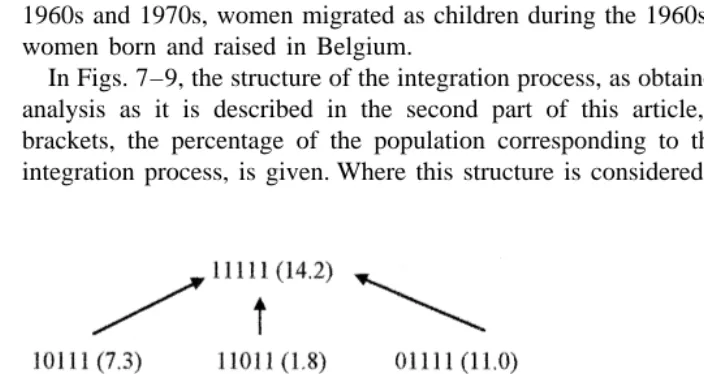
1960s and 1970s, women migrated as children during the 1960s and 1970s, and finally, women born and raised in Belgium.
In Figs. 7–9, the structure of the integration process, as obtained applying the Boolean analysis as it is described in the second part of this article, is presented. Between brackets, the percentage of the population corresponding to that specific state of the integration process, is given. Where this structure is considered as the group norm, the
Fig. 9. Comparison of gender relations between Turks (left) and Moroccans (right) ‘Born in Belgium’.
number of paths determines the tolerance or rigidity of that group. A substantial number of paths may also refer to a situation of uncertainty of a group trying to reach a new balance within a changing environment. A comparison of these structures shows that the first generation that migrated as adults produces the most complex scheme among the Moroccan respondents. Afterwards, the number of possible paths reduces. For the Turkish population, a similar evolution is detected, although the most complex structure is found among the respondents who migrated as children. The diversity within both groups is remarkable, compared to the structures of the other categories.
the networks developed by men who migrated earlier might play an important role as well.
5. Conclusions and discussion
The Boolean approach of Flament (1976) enables one to reduce a set of response patterns, by using Boolean minimization, into a set of prime implicants (PCUs) on which several structures can be built. These structures are obtained by dividing the set of observed patterns into a set of accepted and rejected patterns, called dichotomization. Further research of Van Buggenhaut (1987), Van Buggenhaut and Degreef (1987) and Theuns (1992) explored the possibilities of dichotomizing mainly based on mathematical criteria. In this article, a method is developed such that a unique structure is obtained and that the dichotomization of the response patterns is based, not on a mathematical theory but on a formal theory of integration. The uniqueness of the obtained solution is a necessary condition, since the method aims to compare different groups.
The result of the Boolean analysis as presented by Flament (1976), is the implication scheme reflecting the relation between the separate indicators. This implication scheme can be represented in a digraph indicating the different paths between the extreme nodes of the graph. The notion of path is crucial for the analysis of integration. A path introduces an order between all the indicators of the concept. Within the obtained graphical representation, several paths can be discerned, each describing a possible evolution from a traditional towards an integrated position. On the one hand, since the obtained solution is considered as the group norm, the number of paths reflects the coherence of the group. On the other hand, a path can be used as an alternative for a dimension since the number of paths depends on the data and the method does not force a restricted representation. Although in this article only the method of Boolean analysis is applied, it must be considered as an optional instrument, most useful in combination with other methods.
The applicability of the method is only demonstrated for the analysis of the evolution of the gender relations of Islamic women within a Western society. Where the applied method enables us to discern some tendencies within the data, generally no set of variables is found from which the evolution over the separate paths can be explained univocally. The interpretation of the overall representation from the given set of background variables is too complex to obtain a clear insight in the data. As an alternative, one may reverse this search by combining background variables and comparing different structures of separate groups, based on the same combination of background variables. Apart from the fact that the method provides a general structure for the dataset, this use is most promising. An additional advantage lies in the ease of the calculations. The construction of an implication scheme or the corresponding digraph is rather a pencil and paper method, and the number of indicators is (theoretically) not restricted.
data measuring attitudes, or it can be applied within other fields like knowledge aggregation or symptomatology.
References
Bar-Tal, D., 1990. Group Beliefs. A Conception For Analyzing Group Structure, Processes, and Behavior, Springer Verlag, New York.
Bastenier, A., Dassetto, F., 1993. Immigration et espace public, CIEMI-Harmattan, Paris. Birkhoff, G., 1937. Rings of sets. Duke Mathematical Journal 3, 443–454.
Degreef, E., Doignon, J.-P., Ducamp, A., Falmagne, J.-C., 1986. Languages for the assessment of knowledge. Journal of Mathematical Psychology 30, 243–256.
Doignon, J.-P., Falmagne, J.-C., 1985. Spaces for assessment of knowledge. International Journal of Man-Machine Studies 23, 175–196.
Falmagne, J.-C., Doignon, J.-P., Koppen, M., Villano, M., Johannesen, L., 1990. Introduction to knowledge spaces: how to build, test and search them. Psychological Review 97 (2), 201–224.
´
Flament, C., 1976. Analyse Booleenne de questionnaire, Mouton, Paris.
Janssens, R., 1995. A Boolean Approach to Attitude Measurement. Ph.D. Thesis, Vrije Universiteit Brussel. Janssens, R., 1997. Evolutie en waardepatronen m.b.t. de man-vrouw relaties. In: Lesthaeghe, R. (Ed.),
¨
Diversiteit in sociale verandering. Turkse en Marokkaanse vrouwen in Belgie, VUBPress, Brussels. Janssens, R., 1998. Structuring complex concepts. In: Dowling, C., Roberts, F., Theuns, P. (Eds.), Recent
Progress in Mathematical Psychology, Lawrence Erlbaum Associates, Hillsdale NJ.
Janssens, R., Migratie, R., 1995. Religiositeit en modernisme. Een onderzoek naar de religiositeit van Turkse migrantenvrouwen en de invloed hiervan op een aantal waarden, normen en opinies. In: Lesthaeghe, R., Page, H. (Eds.), Indicatoren van integratie van etnische minderheden. Turkse en Marokkaanse vrouwen in Vlaanderen en Brussel. Sociografische opstellen over sociale verandering, DWTC-Federale Diensten voor Wetenschappelijke, Technische en Culturele Aangelegenheden, Brussels.
¨ Lesthaeghe, R. (Ed.), 1997. Diversiteit in sociale verandering. Turkse en Marokkaanse vrouwen in Belgie,
VUB Press, Brussels.
¨
Lesthaeghe, R., Surkyn, J., 1994. Turkse en Marokkaanse vrouwen in Belgie. Gezinsvorming en waarden bij ¨
de generatiewisseling. Working papers Etnische Minderheden in Belgie. Centrum voor Sociologie Vrije Universiteit Brussel, en Seminarie voor Demografie Universiteit Gent, WP 94-2, Brussels.
Levine, J.M., Moreland, R.L., 1985. Innovation and socialisation in small groups. In: Muscovici, G., Mugny, G., Van Avermaet, E. (Eds.), Perspectives On Minority Influence, Cambridge University Press, Cambridge. Mason, R.D., Lind, D.A., 1990. Statistical Techniques in Business and Economics, Irwin, Boston.
Mugny, G., 1982. The Power of Minorities, Academic Press, London.
Theuns, P., 1992. Dichotomization Methods in Boolean Analysis of Co-occurrence Data. Ph.D. Thesis, Vrije Universiteit, Brussels.
Van Buggenhaut, J., Degreef, E., 1987. On dichotomisation methods in Boolean analysis of questionnaires. In: Roskam, E.E., Suck, R. (Eds.), Progress in Mathematical Psychology, Vol. 1, North-Holland, Elsevier, Amsterdam.
´ ´ ´
Van Buggenhaut, J., 1987. Questionnaires booleens: schemas d’implications et degres de cohesion. Mat-´