www.elsevier.com / locate / livprodsci
Genetic parameters for lean meat yield, meat quality,
reproduction and feed efficiency traits for Australian pigs
2. Genetic relationships between production, carcase and meat
quality traits
a ,
*
b aS. Hermesch
, B.G. Luxford , H.-U. Graser
a
Animal Genetics and Breeding Unit, Joint Unit of NSW Agriculture and The University of New England, University of New England,
Armidale, NSW 2351, Australia
b
Bunge Meat Industries, Corowa, NSW 2646, Australia
Received 15 September 1998; received in revised form 12 November 1999; accepted 9 December 1999
Abstract
Data from 1799 Large White and 1522 Landrace boars were used to obtain genetic correlations between production, carcase and meat quality traits. Variance components were obtained by REML procedures applying an average information algorithm. Traits analysed included average daily gain from 3 to 18 weeks of age (ADG1) and average daily gain, feed intake and feed conversion ratio from 18 to 22 weeks of age (ADG2, FDINT, FCR). Carcase traits included two backfat measurements and one muscle depth measurement taken on the live animal using realtime ultrasound and on the carcase using Hennesy Chong equipment. Further carcase traits included weight of the whole back leg (BLW) and weight of the ham (LMW). Meat quality traits included pH recorded 45 min (pH45) and 24 h after slaughter (pH24), colour of the m.
longissimus dorsi (CLD) and m. multifidus dorsi (CMD), drip loss percentage (DLP) and intramuscular fat content (IMF). ADG1 was genetically a different trait than ADG2 (genetic correlation (rg): 0.3260.23). Genetic correlations between these two traits and backfat measurements were favourable for ADG1 (rg: 20.35 to 20.21,60.13 to 0.22) and unfavourable for ADG2 (rg: 0.29 to 0.48,60.18 to 0.22). A lighter CLD was genetically related to a higher DLP and a lower pH. Estimates were higher between pH24, CLD and DLP (absolute rg: 0.71 to 0.83,60.11 to 0.14) than between pH45 and further meat quality traits (absolute rg: 0.12 to 0.44,60.23 to 0.24). Increasing IMF will improve other meat quality traits (rg: 0.06 to 0.48,60.19 to 0.24). Growth rate was genetically independent from meat quality traits (rg range: 20.31 to 0.35,60.18 to 0.31) while selection for improved feed efficiency and increased leanness will increase the incidence of PSE meat (absolute rg range: 0.00 to 0.66,60.14 to 0.31) and reduce IMF (rg: 0.16 to 0.34,60.15 to 0.27). Meat quality traits should therefore be included in selection indices in order to avoid further deterioration as a result of selection for higher leanness and feed efficiency. 2000 Elsevier Science B.V. All rights reserved.
Keywords: Pigs; Production; Carcase; Meat quality traits; Genetic correlations
*Corresponding author. Tel.: 161-2-6773-3787; fax: 161-2-6773-3266.
E-mail address: [email protected] (S. Hermesch).
1. Introduction The housing system in the test station from 18 to 22 weeks consisted of single penning. Carcase traits
The genetic evaluation of farm animals is based on were recorded on the live animal as well as on the
multitrait best linear unbiased prediction (BLUP) carcase and included backfat at P2 site, and backfat
procedures which require knowledge of genetic and muscle depth between the third and fourth last
correlations between all analysed traits. Estimates of ribs (LFDP2, LFD3 / 4, LMD3 / 4, FDP2, FD3 / 4). In
genetic correlations might differ between populations addition, weight of the whole back left leg and the
due to genetic differences or differences in manage- slash boned ham were recorded as further carcase
ment practices. For example, lean meat percentage traits (BLW, LMW). Meat quality traits included pH
and meat quality traits are unfavourably correlated in recorded 45 min and 24 h after slaughter (pH45,
populations carrying the halothane gene (Cole et al., pH24), colour of the m. longissimus dorsi and m.
1988). In contrast, de Vries et al. (1994) found no multifidus dorsi (CLD, CMD), drip loss percentage
unfavourable relationship between lean meat per- (DLP) and intramuscular fat content (IMF). The
centage and meat quality traits in a halothane free fixed effect models included date of recording (all
population. In the past, the main emphasis of selec- traits), breed (not significant for ADG2, FDINT,
tion decisions has been on growth rate, food conver- FCR, pH24 and CMD) and parity (ADG1, ADG2,
sion ratio and lean meat content (Ollivier et al., BLW, LMW). Weight of the animal at test begin was
1990). Genetic parameters have been obtained fre- fitted for feed intake and feed conversion ratio.
quently for these traits as reviewed by Stewart and Backfat measurements, muscle depth and
in-Schinckel (1990). In addition to these traits, meat tramuscular fat content were corrected for weight of
quality traits have received greater attention in the animal at slaughter. Litter was fitted for growth
breeding programs with the main focus on reduction rate and back leg weight traits as an additional
of incidence of pale, soft and exudative (PSE) and random effect. A further description of the data and
dark, firm and dry (DFD) meat. In Australia, genetic the analysed traits was given in Hermesch et al.
parameters have been obtained for growth rate and (2000) along with derivation of the appropriate
backfat for a number of herds (Klassen, 1992). model and heritability estimates for each trait.
However, genetic parameters for further performance Variance components together with standard errors
and carcase traits as well as meat quality traits are of genetic correlations were obtained applying an
not available yet and selection for meat quality has average information algorithm (Johnson and
Thomp-only been achieved by selecting against the son, 1995) implemented in DFREML (Meyer, 1997).
halothane gene. In order to include meat quality Only genetic correlations obtained from the
com-traits in breeding decisions knowledge of genetic bined analysis of Large White and Landrace data set
parameters is required. The objective of this study are presented since standard errors for genetic
corre-was to obtain genetic parameters for meat quality, lations estimated for the individual breeds generally
carcase and performance traits as well as reproduc- exceeded differences in genetic correlations between
tive traits of the sow. This paper presents genetic and breeds (Hermesch, 1996). Genetic correlations were
environmental correlations between production, car- obtained by bivariate analyses. The development of
case and meat quality traits. the average information algorithm makes
multi-variate analyses of variance components feasible. However, comparing bivariate estimates with
multi-2. Material and methods variate estimates of genetic correlations showed no significant differences (Hermesch, 1996).
Data were recorded at Bunge Meat Industries between July 1992 and June 1995 and include 1799
Large White and 1522 Landrace boars. Performance 3. Results and discussion
traits comprised of growth rate from 3 to 18 weeks
and from 18 to 22 weeks (ADG1, ADG2), feed Estimates of genetic correlations were mostly of
intake (FDINT) and feed conversion ratio (FCR). higher magnitude than environmental correlations.
dis-cussed explicitly. Lower environmental correlations this low genetic correlation in this study these effects
in comparison to genetic correlations were also were confounded and cannot be distinguished.
found by Cameron (1990), Hovenier et al. (1992) Growth rate during station testing and feed intake
and de Vries et al. (1994). De Vries et al. (1994) were highly correlated (rg: 0.82) while feed
conver-explained these higher genetic correlations in com- sion ratio was moderately correlated with these two
parison to environmental correlations with uncorre- traits (rg: 20.48 with ADG2, rg: 0.19 with FDINT).
lated random measurement errors. These estimates correspond to genetic correlations
presented by van Steenbergen et al. (1990), Mrode
3.1. Production traits and Kennedy (1993), Cameron and Curran (1994),
¨
Hofer and Schworer (1995) and Labroue et al.
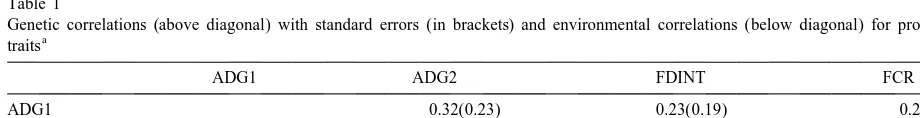
Both growth rate traits (ADG1, ADG2) were only (1997). In contrast, feed intake and feed conversion
lowly correlated (rg: 0.32; Table 1). Two factors ratio were both positively correlated with growth rate
might have caused this low genetic correlation. prior to station testing (rg: 0.23 with FDINT, rg: 0.27
Firstly, animals were at a different stage of growth with FCR). In growing pigs feed intake is higher for
when these two traits were recorded. In the studies of heavier animals (Memmert, 1991; Smith et al., 1991;
Siebrits et al. (1986), Memmert (1991) and Kemm et Thompson et al., 1996). Consequently, feed
conver-al. (1995) boars reached a plateau in growth rate sion ratio increases since growth rate remains at a
between 60 and 80 kg liveweight after which growth constant level or even decreases at the later stage of
rate declined. In this study, animals entered the test the growth curve (Siebrits et al., 1986; Memmert,
station at a fixed age rather than a fixed weight. High 1991; Kemm et al., 1995). Due to the testing
growth animals might have reached the growth procedure pigs with high growth rate entered the test
plateau when they entered the test station. As a station with a higher live weight. As a consequence
consequence their growth rate is reduced. In contrast, feed intake is increased while growth rate is near its
animals with a lower growth rate until 18 weeks plateau leading to an inferior feed conversion ratio.
might not have reached their growth plateau and By incorporating the animal’s weight at test start in
were therefore more likely to have a higher growth the model for feed intake and feed conversion ratio it
rate between 18 and 22 weeks. Secondly, animals was attempted to take these relationships into
ac-were kept in two different housing systems. The count. Apparently this could not be achieved
com-genetic relationship between animals kept in these pletely although genetic correlations were reduced in
two different housing systems, single penned and comparison to the model when these two traits were
group penned, was studied by von Felde et al. not corrected for the animal’s weight at test begin.
(1995). Genetic correlations between growth rate
recorded in these two housing systems were 0.55 for 3.2. Carcase traits
average daily gain recorded over the testing period
and 0.10 for lifetime average daily gain. However, Genetic correlations between backfat
measure-although both differences in growth stage and differ- ments were not significantly different from one
ences in housing systems, may have contributed to (Table 2). Although two muscle depth measurements
Table 1
Genetic correlations (above diagonal) with standard errors (in brackets) and environmental correlations (below diagonal) for production
a
traits
ADG1 ADG2 FDINT FCR
ADG1 0.32(0.23) 0.23(0.19) 0.27(0.24)
ADG2 0.05 0.82(0.11) 20.48(0.21)
FDINT 0.11 0.61 0.19(0.27)
FCR 0.24 20.70 0.02
a
Table 2
a
Genetic correlations (above diagonal) with standard errors (in brackets) and environmental correlations (below diagonal) for carcase traits
LFDP2 LFD3 / 4 LMD3 / 4 FDP2 FD3 / 4 BLW LMW
LFDP2 0.99 (0.01) 20.16 (0.15) 0.93 (0.04) 1.00 (0.03) 20.25 (0.15) 20.63 (0.13) LFD3 / 4 0.73 20.14 (0.16) 0.94 (0.03) 1.0 (0.03) 20.21 (0.16) 20.62 (0.13) LMD3 / 4 20.01 20.07 20.10 (0.18) 0.01 (0.21) 0.54 (0.21) 0.54 (0.21)
FDP2 0.36 0.34 20.02 0.96 (0.04) 20.23 (0.18) 20.70 (0.09)
FD3 / 4 0.00 0.00 20.04 0.48 20.25 (0.20) 20.70 (0.11)
BLW 0.06 0.01 0.18 20.02 20.04 0.86 (0.06)
LMW 20.33 20.35 0.24 20.34 20.38 0.88
a
Abbreviations: LFDP2, backfat depth at P2 measured with real time ultrasound; LFD3 / 4, backfat depth between the third and fourth last ribs measured with real time ultrasound; LMD3 / 4, muscle depth of m. longissimus dorsi between the third and fourth last ribs on the live animal; FDP2, backfat depth at P2 measured with Hennesy Chong grading machine; FD3 / 4, backfat depth between third and fourth last ribs measured with Hennesy Chong grading machine; BLW, weight of whole left back leg; LMW, weight of slash boned left back leg.
were taken (Hermesch et al., 2000), only relation- This corresponds to the high genetic correlation of
ships between muscle depth recorded on the live 0.65 between loin eye area and lean meat percentage
animal (LMD3 / 4) and other carcase traits are pre- presented by Stewart and Schinckel (1990) in their
sented. Standard errors were greater than one for review. Given that muscle depth is measured on the
genetic correlations between the second muscle live animal this measurement together with backfat
depth measurement recorded on the carcase with measurements opens the possibility of selecting
Hennesy Chong equipment and other carcase charac- indirectly for the two weight measurements.
teristics. Muscle depth recorded with real time
ultrasound and backfat measurements were only 3.3. Production and carcase traits
lowly genetically related (rg range: 20.16 to 0.01).
In contrast, Lo et al. (1992) analysed eye muscle 3.3.1. Growth rate traits and carcase traits
area and backfat measurements finding high genetic Estimates of genetic correlations between average
correlations from 20.81 to 20.56. Backfat mea- daily gain recorded prior to station testing and
surements and muscle depth were highly correlated backfat measurements were negative ranging from
with ham weight (absolute rg range50.54–0.70). 20.35 to 20.26 (Table 3). In contrast, genetic
Table 3
Genetic correlations (first row) with standard errors (in brackets) and environmental correlations (second row) between production and
a
carcase traits
ADG1 ADG2 FDINT FCR
LFDP2 20.35 (0.13) 0.31 (0.18) 0.56 (0.11) 0.19 (0.19)
0.06 0.00 0.21 0.17
LFD3 / 4 20.29 (0.14) 0.29 (0.18) 0.54 (0.11) 0.23 (0.19)
0.03 0.02 0.23 0.15
LMD3 / 4 0.18 (0.20) 20.13 (0.25) 20.13 (0.20) 0.07 (0.27)
0.05 20.03 20.06 20.02
FDP2 20.26 (0.16) 0.33 (0.17) 0.62 (0.12) 0.34 (0.20)
0.05 0.03 0.12 0.06
FD3 / 4 20.21 (0.19) 0.48 (0.22) 0.63 (0.14) 0.20 (0.25)
0.13 0.07 0.18 0.11
BLW 0.83 (0.07) 0.48 (0.14) 0.45 (0.24) 20.83 (0.33)
0.74 0.43 0.46 20.48
LMW 0.61 (0.12) 0.23 (0.16) 20.11 (0.18) 20.71 (0.29)
0.66 0.37 0.20 20.44
a
correlations between growth rate recorded during between growth rate during station testing at the later
station testing and backfat measurements were un- stage of the growing period and backfat
measure-favourable (rg range: 0.29–0.48). ments is an indication that pigs at that age have a
In this study feed intake was not restricted by the high feed intake which exceeds their maximum
feeding regime before or during station testing. protein deposition and extra energy is deposited as
Genetic correlations between average daily gain fat tissue. This hypothesis is supported by von Felde
during station testing and backfat and muscle depth et al. (1996) who found that feed intake at the
measurements are in good agreement with literature beginning of the growing period has more favourable
values which are based on ad libitum feeding genetic correlations with leanness than feed intake
systems (van Steenbergen et al., 1990; Kaplon et al., over the entire growing period. The level of
in-1991; Cardellino and Siewerdt, 1992; Lo et al., 1992; sufficient feed intake of young pigs in relation to
Ducos et al., 1993; Mrode and Kennedy, 1993; their protein deposition is further enhanced with the
Cameron and Curran, 1994). In contrast, estimates of use of entire boars in this study which have a higher
genetic correlations between average daily gain protein deposition potential than castrates (Campbell
measured before the test period and these described and Taverner, 1988).
carcase characteristics correspond to genetic correla- Another difference between the two growth rate
tions between growth rate and backfat obtained traits is manifested in different housing systems. Pigs
under restricted feeding (Lundeheim et al., 1980; were group penned prior to station testing and single
Johansson, 1987; McPhee et al., 1988). penned during station testing. Therefore, a higher
Pigs of superior genotype have higher require- percentage of energy might be required for
mainte-ments of dietary protein and amino acids to support nance in the group penning as a result of competition
their higher potential of protein deposition in com- among animals and more movement of pigs. This
parison to pigs with a reduced capacity of lean meat might specially be the case with boars. However,
growth (Campbell and Taverner, 1988). The effect these two explanations were confounded and can not
of protein content in the diet on selection was studied be distinguished in this project.
by Stern (1994) who showed that the genetic po- Estimates of genetic correlations between growth
tential for lean meat growth was expressed more rate and ham weight were positive in the study of
strongly on the high protein diet than on the low Johansson (1987) which was based on a restricted
protein diet. In this project, pigs were performance feeding regime with values of 0.16 for Landrace and
tested on a high protein diet with 1.15% lysine 0.25 for Yorkshire. Based on ad libitum feeding
content which exceeds the lysine content of 0.96% in regimes, estimates of genetic correlations were nega-¨
the high protein diet in the study by Stern (1994). tive (Hofer et al., 1992; Hofer and Schworer, 1995).
Therefore, no limitations on lean meat growth were In this study all genetic correlations between growth
imposed through the protein content of the diet used rate characteristics and weight measurements of the
in this study. The favourable and unfavourable back leg and lean meat weight of the back leg were
relationship between growth rate and lean meat positive. However, further analyses showed that
percentage is therefore dependent on energy intake. these positive genetic correlations were largely due
Studies including restricted and ad libitum feeding to not adjusting both back leg weight measurements
have shown that the genetic correlation between for hot carcase weight. When both weight
measure-growth rate and leanness is more favourable when ments were adjusted for hot carcase weight genetic
feed intake is restricted (McPhee et al., 1988). Since correlations were reduced. Estimates of genetic
younger pigs are limited in feed intake capacity correlations were favourable between back leg
(Campbell et al., 1986) their lean meat growth weight measurements and growth rate prior to station
potential exceeds their appetite which might lead to a testing (rg: 0.46 for BLW; rg: 0.26 for LMW) but
favourable relationship between average daily gain in unfavourable for growth rate during station testing
the period between 3 and 18 weeks and leanness, (rg: 20.09 for BLW; 20.13 for LMW). These
traits closely related to backfat and muscle depth estimates might support the hypothesis that these
¨
to station testing which leads to this stronger favour- Curran, 1994). Only Hofer and Schworer (1995)
able relationship. analysed feed intake and ham weight and found a
stronger relationship between these two traits (rg:
3.3.2. Feed intake and feed conversion ratio with 20.72). In contrast, genetic correlations between
carcase traits feed conversion ratio and ham weight as presented
¨
Genetic correlations between feed intake and by Sonnichsen and Kalm (1984) and Hofer and
¨
carcase traits were consistent and show that a higher Schworer (1995) were of lower magnitude with a
feed intake during the growth period between 18 and mean of 20.52. However, given the high standard
22 weeks is associated with a decrease in lean meat errors of 0.33 and 0.29 for correlations in this study content of the carcase. Genetic correlations between these differences are not significant.
feed intake and backfat measurements ranged from
0.54 to 0.63 and were 20.13 for muscle depth and 3.3.3. Meat quality traits
20.11 for ham weight. A paler colour of the m. longissimus dorsi muscle
Webster (1977) compared the energy required for was associated with a reduced pH (rg with pH45:
protein deposition and fat deposition and concluded 20.23; rg with pH24: 20.83). Colour of the m.
that the same amount of metabolic energy is de- multifidus dorsi was genetically positively correlated
posited in 1 kg of fat as in about 8 kg of fat-free with pH measurements (rg with pH4550.20; rg with
muscle which supports favourable genetic correla- pH2450.03; Table 4). This is an indication that
tions between feed efficiency and backfat measure- these colour measurements of m. longissimus dorsi
ments (rg range: 0.19–0.34). Feed conversion ratio and of m. multifidus dorsi are different traits which is
has a strong genetic relationship with weight of the supported by only a moderate genetic correlation of
whole back leg (rg with BLW: 20.83) and lean 0.47 between these two traits. In addition, Warner et
meat weight of the back leg (rg with LMW: 20.71). al. (1993) showed that meat quality measurements
All three traits, feed conversion ratio and both taken on the m. longissimus dorsi were only reliable
weight measurements are larger in heavier animals indicators of colour and exudate for other muscles in
and were increased by only adjusting feed conver- DFD carcases. In PSE meat quality measurements
sion ratio for weight of the animal. For example, taken on the m. longissimus dorsi were only reliable
genetic correlations were reduced to 20.25 for both indicators of colour and exudate for the four major
traits by also adjusting back leg weight measure- ham muscles which are also white muscles in
ments for hot carcase weight. contrast to the m. multifidus dorsi analysed in this
A number of studies found similar genetic correla- study.
tions between feed intake or feed conversion ratio Drip loss percentage had moderate to strong
and backfat measurements (van Steenbergen et al., genetic correlations with colour and pH
measure-1990; Mrode and Kennedy, 1993; Cameron and ments taken on the m. longissimusdorsi while no
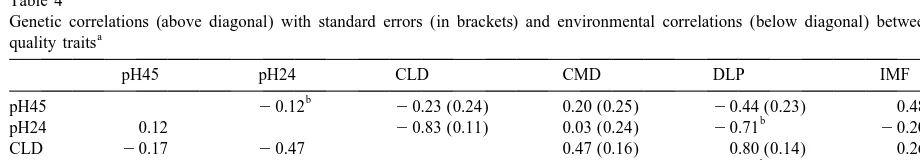
Table 4
Genetic correlations (above diagonal) with standard errors (in brackets) and environmental correlations (below diagonal) between meat
a
quality traits
pH45 pH24 CLD CMD DLP IMF
b
Abbreviations: pH45, pH measured 45 min after slaughter; pH24, pH measured 24 h after slaughter; CLD, L-value of Minolta chromameter of m. longissimus dorsi; CMD, L-value of Minolta chromameter of m. multifidus dorsi; DLP, drip loss percentage; IMF, intramuscular fat content.
b
genetic relationship existed with colour of the m. relationship indicates a potential problem of using multifidus dorsi. The estimated genetic correlations colour as an indicator of PSE meat.
were 20.44 for pH45, 20.71 for pH24 and 0.80 Favourable genetic correlations between
in-for colour of the m. longissimus dorsi. These correla- tramuscular fat content, pH45 and drip loss
per-tions reflect characteristics of PSE and DFD meat. centage are confirmed by Hovenier et al. (1992), de
¨
Meat with a high drip loss percentage has a low pH Vries et al. (1994) and Hofer and Schworer (1995).
and a pale colour (PSE meat) and in DFD meat, a In regard to genetic associations between
in-low drip loss percentage is associated with a high tramuscular fat content and pH24 and colour
mea-ultimate pH and a dark colour. These relationships surements literature values have a wide range with
were stronger between traits measured on the same estimates of genetic correlations ranging from
day (24 h after slaughter). Generally, these genetic 20.18 to 0.39 for pH24 and from 20.33 to 0.07 for
correlations between meat quality traits recorded on colour (Hovenier et al., 1992; Bidanel et al., 1994;
the m. longissimus dorsi agree with estimates pre- de Vries et al., 1994; Goodwin, 1995; Hofer and
¨
sented by Cole et al. (1988), Hovenier et al. (1992), Schworer, 1995).
¨ de Vries et al. (1994) and Hofer and Schworer
(1995). 3.4. Production and meat quality traits
Meat quality is currently not paid for in Australia
but a high drip loss is of direct economical impor- A high growth rate between 3 and 18 weeks was
tance to the processing industry due to the weight related to a darker colour (rg5 20.21 for CLD and
loss during processing. Recording of drip loss per- 20.31 for CMD; Table 5). In contrast, genetic
centage in this project was labour intensive and correlations between average daily gain during
sta-therefore costly. However, drip loss percentage is tion testing and colour measurements were positive.
highly correlated with colour of the m. longissimus Estimates in other studies (Cole et al., 1988; de Vries ¨
dorsi (CLD) which is less costly to measure and et al., 1994; Hofer and Schworer, 1995) showed a
could be used in breeding programs instead. similar range indicating no clear genetic relationship
The merit of a high intramuscular fat content lies between growth rate and meat quality traits.
in its favourable relationship with eating quality Growth rate prior to station testing was genetically
(Cameron, 1990; Lo et al., 1992). The minimum not correlated with intramuscular fat content while
level of intramuscular fat content to improve eating average daily gain during station testing was
nega-quality is somewhat debated. Among studies and tively correlated (rg5 20.21) with intramuscular fat
countries, minimum level of intramuscular fat con- content. These estimates are within the range of
tent ranges from 2.0% to 3.0% (de Vol et al., 1988; genetic correlations (20.16 to 0.27) presented by
Hovenier et al., 1993; Glodek, 1997). However, all (Lo et al., 1992; Knapp et al., 1995).
of these levels of intramuscular fat content are above Feed intake was strongly correlated with pH45
the mean of Large White and Landrace pigs in this (rg50.66) but had no significant genetic
relation-study of 1.69% (Hermesch et al., 2000). Both ships with further meat quality traits. Only two
genetic relationships between intramuscular fat con- studies included these trait combinations (de Vries et ¨
tent and pH measurements were favourable with an al., 1994; Hofer and Schworer, 1995) finding low to
increase in intramuscular fat content leading to a moderate genetic correlations. In the study by de
lower incidence of PSE (rg with pH4550.48) and Vries et al. (1994) a lower feed intake and residual
DFD meat (rg with pH245 20.20). The positive feed intake was associated with a darker colour and a
genetic correlations of 0.26 and 0.20 between in- lower waterholding capacity. De Vries et al. (1994)
tramuscular fat content and colour measurements suggested that it might result from higher
mainte-indicate that a higher intramuscular fat is associated nance requirements. Animals with higher
mainte-with a paler colour. This paler colour should not be nance requirements could have faster glycogen
de-regarded as an indicator of a higher incidence of pletion before slaughter, and therefore a higher risk
PSE. In contrast, the paler colour could be caused by of DFD meat.
Table 5
Genetic correlations (first row) with standard errors (in brackets) and environmental correlations (second row) between production and meat
a
quality traits
ADG1 ADG2 FDINT FCR
pH45 0.00 (0.25) 0.35 (0.31) 0.66 (0.19) 0.40 (0.30)
0.22 0.06 0.02 20.04
pH24 0.05 (0.24) 0.07 (0.30) 20.04 (0.24) 20.16 (0.31)
0.06 20.08 20.02 0.07
CLD 20.21 (0.20) 0.23 (0.24) 20.10 (0.20) 20.59 (0.23)
20.09 0.02 0.02 0.00
CMD 20.31 (0.20) 0.07 (0.23) 20.03 (0.19) 20.19 (0.25)
20.20 20.09 20.04 0.09
DLP 0.02 (0.21) 0.10 (0.25) 20.15 (0.21) 20.58 (0.23)
0.06 0.03 0.01 0.02
IMF 0.01 (0.18) 20.21 (0.18) 0.03 (0.20) 0.21 (0.27)
20.02 0.10 0.17 0.03
a
For abbreviations see Tables 1 and 4.
and meat quality traits indicated that the more feed backfat measurements and pH45 (rg range: 0.49–
efficient pigs have inferior meat quality. Estimates 0.64; Table 6). Selection for reduced backfat will
were moderate to high for traits indicating PSE in the therefore reduce pH45 and thus increase the
inci-m. longissimus dorsi (rg with pH4550.40; rg with dence of PSE meat confirming results from Bidanel
CLD5 20.59; rg with DLP5 20.58). Unfavour- et al. (1994) who found a genetic correlation of 0.26
able genetic correlations between feed conversion between these two traits.
ratio and meat quality traits were also found by de In general, no significant relationship existed
¨
Vries et al. (1994), Hofer and Schworer (1995) and between the meat quality traits pH24 and colour
Knapp et al. (1995). measurements and backfat and muscle depths
mea-surements. In contrast, genetic correlations between
3.4.1. Carcase and meat quality traits drip loss percentage and backfat measurements were
The strongest unfavourable relationships between lowly negative (rg: 20.20 to 20.14). Two
publi-carcase and meat quality traits existed between cations (Hovenier et al., 1992; de Vries et al., 1994)
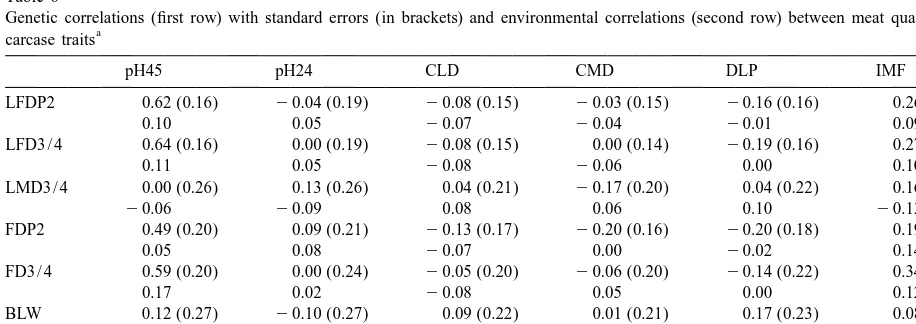
Table 6
Genetic correlations (first row) with standard errors (in brackets) and environmental correlations (second row) between meat quality and
a
carcase traits
pH45 pH24 CLD CMD DLP IMF
LFDP2 0.62 (0.16) 20.04 (0.19) 20.08 (0.15) 20.03 (0.15) 20.16 (0.16) 0.26 (0.15)
0.10 0.05 20.07 20.04 20.01 0.09
LFD3 / 4 0.64 (0.16) 0.00 (0.19) 20.08 (0.15) 0.00 (0.14) 20.19 (0.16) 0.27 (0.16)
0.11 0.05 20.08 20.06 0.00 0.10
LMD3 / 4 0.00 (0.26) 0.13 (0.26) 0.04 (0.21) 20.17 (0.20) 0.04 (0.22) 0.16 (0.21)
20.06 20.09 0.08 0.06 0.10 20.13
FDP2 0.49 (0.20) 0.09 (0.21) 20.13 (0.17) 20.20 (0.16) 20.20 (0.18) 0.19 (0.17)
0.05 0.08 20.07 0.00 20.02 0.14
FD3 / 4 0.59 (0.20) 0.00 (0.24) 20.05 (0.20) 20.06 (0.20) 20.14 (0.22) 0.34 (0.21)
0.17 0.02 20.08 0.05 0.00 0.12
BLW 0.12 (0.27) 20.10 (0.27) 0.09 (0.22) 0.01 (0.21) 0.17 (0.23) 0.08 (0.23)
0.17 0.00 20.07 20.23 0.08 0.00
LMW 20.17 (0.25) 20.28 (0.23) 0.22 (0.19) 0.08 (0.18) 0.36 (0.21) 20.15 (0.18)
0.09 0.02 20.04 20.02 0.06 20.20
a
also obtained low genetic correlations between these was analysed by Wilson et al. (1998) concluding that
traits and de Vries et al. (1994) suggested that the reasonable genetic progress should be possible in
unfavourable relationship between leanness and meat intramuscular fat content using ultrasonic scan
mea-quality might not exist in halothane free populations. surements. Different groups (Ragland et al., 1997;
In contrast, Ducos et al. (1993) found a strong Eggert and Schinckel, 1998) are working on such a
unfavourable genetic correlation between leanness measurement technique in pigs. In addition, selection
and a meat quality index in a halothane free French for intramuscular fat content might be supported by a
Large White population but found no genetic rela- single gene affecting this trait which was indicated in
tionship between leanness and meat quality in French Meishan crossbreeds by Janss et al. (1994) using
Landrace. segregation analyses. Subsequently, the heart fatty
Both weight measurements were negatively corre- acid binding protein (H-FABP) gene, a candidate
lated with pH24 (rg5 20.10 for BLW, rg5 20.28 gene for meat quality traits, has been localised on
for LMW) thus reducing the incidence of DFD with chromosome six by Gerbens et al. (1997).
increasing weight of the whole back leg and higher ham weight. No relationship existed between pH24 and backfat measurements. Drip loss percentage was
4. Conclusions
lowly correlated with weight of the whole back leg (rg50.17) and moderately correlated with lean meat
Average daily gain from 3 to 18 weeks is a
weight of the whole back leg (rg50.36). The
different trait than average daily gain recorded literature provides no comparison for these
correla-during station testing between 18 and 22 weeks. A tions but they indicate that a high ham weight has a
higher average daily gain prior to station testing is stronger unfavourable genetic correlation with drip
associated with an increased leanness, while a higher loss percentage than carcase characteristics
describ-average daily gain in the later part of the growing ing lean meat content of the whole carcase. The
period will reduce leanness. The magnitude of higher magnitude of this unfavourable relationship
genetic correlations between meat quality measured might partly be due to a higher incidence of the
on the second day after slaughter was higher than halothane gene in those pigs that have a high ham
their relationship with pH measured shortly after weight.
slaughter (pH45). Increasing intramuscular fat con-Intramuscular fat content was positively correlated
tent will improve meat quality characteristics related with backfat measurements with genetic correlations
to PSE and DFD meat. Growth rate traits had no ranging from 0.19 to 0.34. A decrease in backfat will
significant genetic relationship with meat quality therefore lead to a reduction in intramuscular fat
traits. A higher feed intake was strongly correlated content. A number of studies confirm this
unfavour-with a higher pH45 while a low feed efficiency was able relationship (Cameron, 1990; Hovenier et al.,
related to a low pH45, a lighter colour and a higher 1992; Lo et al., 1992) with a range of genetic
drip loss percentage. A reduction in backfat and an correlation from 0.05 to 0.60. Intramuscular fat
increase in lean meat weight of the ham is somewhat content is also favourably related to meat quality
unfavourably associated with meat quality traits. traits describing PSE and DFD meat. Therefore, in
order to avoid further deterioration with selection for increased leanness intramuscular fat content should
be considered in breeding programs. In Australia Acknowledgements
facilities to measure intramuscular fat content on the
slaughtered pig are limited and breeders might have This work was funded by the Pig Research and
to rely on in vivo measurements of intramuscular fat Development Corporation under project UNE17P.
content. Wilson et al. (1992) used image analysis of Staff of Bunge Meat Industries are gratefully
ack-ultrasonic scans to measure intramuscular fat content nowledged for data collection. Constructive
com-in vivo com-in cattle. This technology is now used com-in ments from the anonymous referees are greatly
quality, reproduction and feed efficiency traits for Australian References
pigs, PhD thesis, University of New England, Armidale, NSW, Australia.
´
Bidanel, J.P., Ducos, A., Labroue, F., Gueblez, R., Gasnier, C., Hermesch, S., Luxford, B.G., Graser, H.-U., 2000. Genetic 1994. Genetic parameters of backfat thickness, age at 100 kg parameters for lean meat yield, meat quality, reproduction and and meat quality traits in Pietrain pigs. Ann. Zootech. 43 (2), feed efficiency traits for Australian pigs. Livest. Prod. Sci.
141–149. 65(3), 239–248.
Cameron, N.D., 1990. Genetic and phenotypic parameters for Hofer, A., Hagger, C., Kuenzi, N., 1992. Genetic evaluation of carcase traits, meat and eating quality. Livest. Prod. Sci. 26, on-farm tested pigs using an animal model. I: Estimation of
119–135. variance components with restricted maximum likelihood.
Cameron, N.D., Curran, M.K., 1994. Selection for components of Livest. Prod. Sci. 30, 69–82.
efficient lean growth rate in pigs 4. Genetic and phenotypic Hofer, A. and Schworer, D., 1995. Genetic parameters of pro-¨ parameter estimates and correlated responses in performance duction and meat quality traits in station tested Swiss Large test traits with ad-libitum feeding. Anim. Prod. 59, 281–291. White pigs. 46th Annual Meeting EAAP, Prague.
Campbell, R.G., Taverner, M.R., Curic, D.M., 1986. The effects Hovenier, R., Kanis, E., van Asseldonk, Th., Westerink, N.G., of dietary fibre, source of fat and dietary energy concentration 1992. Genetic parameters of pig meat quality traits in halothane on the voluntary food intake and performance of growing pigs. negative population. Livest. Prod. Sci. 32, 309–321. Anim. Prod. 38, 233–240. Hovenier, R., Kanis, E., van Asseldonk, Th., Westerink, N.G., Campbell, R.G., Taverner, M.R., 1988. Genotype and sex effects 1993. Breeding for pig meat quality in halothane negative
on the relationship between energy intake and protein deposi- populations – a review. Pig News Inform. 14, 17N–25N. tion in growing pigs. J. Anim. Sci. 66, 676–686. Janss, L.L.G., van Arendonk, J.A.M., Brascamp, E.W., 1994. Cardellino, R.A., Siewerdt, F., 1992. Genetic parameters of Identification of a single gene affecting intramuscular fat in production traits in Landrace and Large White pigs in Southern Meishan crossbreds using Gibbs sampling. 5th World Congress Brazil. Braz. J. Genet. 15, 575–583. on Genetics Applied to Livestock Production, Guelph, vol. 18,
` ´ ´
Cole, G., Henaff, G.L., Sellier, P., 1988. Parametres genetiques de pp. 361–364.
` ´
quelques caracteres de qualite de la viande dans les races Johansson, K., 1987. Evaluation of station testing of pigs. II. procines Large White, Landrace Franc¸ais et Landrace Belge. J. Multiple trait versus single trait estimation of genetic parame-Rech. Porcine en France 20, 249–254. ters for meat quality measurements. Acta Agric. Scand., Sect. de Vol, D.L., McKeith, F.K., Bechtel, P.J., Novakofski, J., Shanks, A Anim. Sci. 37, 108–119.
R.D., Carr, T.R., 1988. Variation in composition and palatabili- Johnson, D.L., Thompson, R., 1995. Restricted maximum likeli-ty traits and relationships between muscle characteristics and hood estimation of (co)variance components for univariate palatability in a random sample of pork carcasses. J. Anim. Sci. animal models using sparse matrix techniques and average
66, 385–395. information. J. Dairy Sci. 78, 449–456.
de Vries, A.D., van der Wal, P.G., Long, T., Eikelenboom, G., Kaplon, M.J., Rothschild, M.F., Berger, P.J., Healey, M., 1991. Merks, J.W.M., 1994. Genetic parameters of pork quality and Population parameter estimates for performance and reproduc-production traits in Yorkshire populations. Livest. Prod. Sci. tive traits in polish large white nucleus herds. J. Anim. Sci. 69,
40, 277–289. 91–98.
Ducos, A., Bidanel, J.P., Ducroq, V., Boichard, D., Groeneveld, E., Kemm, E.H., Siebrits, F.K., Ras, M.N., Coetzee, S.E., 1995. Feed 1993. Multivariate restricted maximum likelihood estimation of intake, growth and protein deposition of pigs fed three protein genetic parameters for growth, carcass and meat quality traits levels. Livest. Prod. Sci. 41, 163–170.
in French Large White and French Landrace pigs. Genet. Sel. Klassen, D., 1992. A simulation-base algorithm for mixed model Evol. 25, 475–493. estimation of genetic parameters with an application to the Eggert, J.M., Schinckel, A., 1998. Growth and characterization of Australian pig industry. PhD thesis, University of New
Eng-individual backfat layers in swine: a new method for the land, Armidale, NSW, Australia. ¨
prediction of intramuscular fat in the live animal or carcass. Knapp, P., William, A., Solkner, J., 1995. Genetische Beziehungen ¨
National Swine Improvement Federation Conference and An- zwischen dem intramuskularen Fettgehalt und Merkmalen der ¨
nual Meeting, East Lansing, MI, NSIF vol. 23, pp. 69–75. Mast- und Schlachtleistung bei osterreichischen Schweineras-Gerbens, F., Rettenberger, G., Lenstra, J.A., Verkamp, J.H., de Pas, sen. Vortragstagung der DGfZ / GfT, Hannover, Germany.
´
M.F.W., 1997. Characterization, chromosomal localization, and Labroue, F., Gueblez, R., Sellier, F., 1997. Genetic parameters of genetic variation for the porcine heart fatty acid-binding protein feeding behaviour and performance traits in group-housed gene. Mammalian Genome 8, 328–332. Large White and French Landrace growing pigs. Genet. Sel. Glodek, P., 1997. Sicherheit in der Produktion und Ausgeg- Evol. 29, 451–468.
¨
Swedish pig progeny testing stations. Acta Agric. Scand. von genetischen und phanotypischen Korrelationen. ¨
Section A Animal Sci. 30, 183–188. Zuchtungskunde 56, 249–261.
McPhee, C.P., Rathmell, G.A., Daniels, L.J., Cameron, N.D., Stern, S., 1994. Lean meat growth in pigs: Response to selection 1988. Selection in pigs for increased lean growth rate on on high and low protein diets. Ph.D. thesis, Swedish University time-based feeding scale. Anim. Prod. 47, 149–156. of Agricultural Science, Uppsala, Sweden.
¨
Memmert, T., 1991. Mehrfaktorielle Untersuchungen uber die Stewart, T.S., Schinckel, A.P., 1990. Genetic parameters for swine Auswirkungen verschiedener producktionstechnisch relevanter growth and carcass traits. In: Young, L.D. (Ed.), Genetics of
¨
Einflußgrossen auf die Fleischleistungsmerkmale beim Swine. Clay Center, Nebraska, Canada, pp. 77–79.
¨ ¨
Schwein unter okonomischen und prufungsmethodischen As- Thompson, J.M., Sun, F., Kuczek, T., Schinckel, A.P., Stewart, ¨
pekten, Rheinischen Friedrich-Whilhelms-Universitat zu Bonn, T.S., 1996. The effect of genotype and sex on the patterns of Bonn, Germany. protein accretion in pigs. Anim. Sci. 63, 265–276.
Meyer, K., 1997. An ‘average information’ restricted maximum van Steenbergen, E.J., Kanis, E., Steen, H.A.M., 1990. Genetic likelihood algorithm for estimating reduced rank genetic co- parameters of fattening performance and exterior traits of boars variance matrices or covariance functions for animal models tested in central stations. Livest. Prod. Sci. 24, 65–78. with equal design matrices. Genet. Sel. Evol. 29, 97–116. von Felde, A., Roehe, R., Looft, H., Kalm, E., 1995. Multivariate Mrode, R.A., Kennedy, B.W., 1993. Genetic variation in measures genetic analysis of feed intake traits in young boars and its of food efficiency in pigs and their genetic relationships with relation to growth, carcass and behaviour traits under consid-growth rate and backfat. Anim. Prod. 56, 225–232. eration of genotype-environment interaction. 46th Annual
´
Ollivier, L., Gueblez, R., Webb, A.J., van de Steen, H.A.M., 1990. Meeting of the EAAP, Prague.
Breeding goals for nationally and internationally pig breeding von Felde, A., Roehe, R., Looft, H., Kalm, E., 1996. Genetic organisations. 4th World Congress on Genetics Applied to association between feed intake and feed intake behaviour at Livestock Production, Edingburgh, UK, vol. XV, pp. 383–394. different stages of growth of group-housed boars. Livest. Prod. Ragland, K., Brondum, J., Bass, T., Christian, L., 1997. Prediction Sci. 47, 11–22.
of intramuscular fat in live swine using real-time ultrasound. Warner, R.D., Kauffman, R.G., Russell, R.L., 1993. Quality Proceedings of the National Swine Improvement Federation attributes of major porcine muscles: a comparison with the Conference, West Des Moines, Iowa, NSIF vol. 22, pp. 96–99. longissimus lumborum. Meat Sci. 33, 359–372.
Siebrits, F.K., Kemm, E.H., Ras, M.N., Barnes, P.M., 1986. Webster, J.F., 1977. Selection for leanness and the energetic Protein deposition of pigs as influenced by sex, type and efficiency of growth in meat animals. Proc. Nutr. Soc. 36, livemass. 1. The pattern and composition of protein deposition. 53–59.
S. Afr. J. Anim. Sci. 16, 23–27. Wilson, D.E., Graser, H.-U., Rouse, G.H., Amin, V., 1998. Smith, W.C., Ellis, M., Chadwick, J.P., Laird, R., 1991. The Prediction of carcass traits using live animal ultrasound. 6th influence of index selection for improved growth and carcass World Congress on Genetics Applied to Livestock Production, characteristics on appetite in a population of Large White pigs. vol. 23, Armidale, NSW, Australia, pp. 61–68.
Anim. Prod. 52, 193–199. Wilson, D.E., Zhang, H.L., Rouse, G.H., Duello, D.A., Izquierdo,
¨ ¨
Sonnichsen, C.M.L., Kalm, J.E., 1984. Parameterschatzung und M.M., 1992. Prediction of intramuscular fat in the longissimus ¨
Indexkonstruktion fur die Populationen Deutsche Landrasse B dorsi of live beef animals using real-time ultrasound. J. Anim. ¨