THE ROLE OF VEGETATION COVER AND CATCHMENT
CHARACTERISTICS ON BASEFLOW IN BALI ISLAND
Saparis Soedarjanto
Unda Anyar Watershed Management Centre, the Ministry of Forestry
J. Sartohadi
Faculty of Geography,Universitas Gadjah Mada
M.P. Hadi
Faculty of Geography,Universitas Gadjah Mada
P. Danoedoro
Faculty of Geography,Universitas Gadjah Mada
ABSTRACT
Studies of the role of combined vegetation cover and catchment characteristics on base flow condition are required to address the controversy of correlation between vegetation and hydrological properties. Objectives of the research were: 1) to assess the hydrological role of vegetation on baseflow condition; and 2) to study the influence of vegetation cover in relation to catchment characteristics on the baseflow. Field survey, digital filter method, remote sensing technique, and statistical analysis were used to derive and assess the correlation among variables. Results of the research were: 1) a negative significant correlation between vegetation cover and baseflow recession coefficient, despite the fact that it is not a single factor and related to various catchment characteristics; 2) vegetation cover is not a single factor in determining the baseflow characteristics, since it also involves drainage density and infiltration rate.
Keywords:vegetation cover, baseflow, statistical analysis
ABSTRAK
Studi tentang peran tutupan vegetasi gabungan dan karakteristik DAS pada kondisi aliran dasar diperlukan untuk memahami kontroversi mengenai korelasi antara vegetasi dan sifat hidrologis. Tujuan dari penelitian ini adalah: 1) untuk menilai peran hidrologis vegetasi pada kondisi aliran dasar; dan 2) untuk mempelajari pengaruh tutupan vegetasi yang dikaitkan dengan karakteristik DAS pada aliran dasar. Survei lapangan, metode filter digital, teknik penginderaan jauh, dan analisis statistik digunakan untuk mendapatkan dan menilai korelasi antara variabel - variabel. Hasil penelitian ini adalah: 1) korelasi negatif yang signifikan antara tutupan vegetasi dan koefisien resesi aliran dasar, namun bukanlah faktor tunggal dan sejalan dengan hubungannya dengan karakteristik DAS; 2) tutupan vegetasi bukan merupakan faktor tunggal dalam menentukan karakteristik aliran dasar, tetapi juga melibatkan kerapatan drainase dan laju infiltrasi.
Kata Kunci : tutupan kanopi, aliran dasar, analisis statistik
INTRODUCTION
Several studies stated that forest is the major agent in reducing groundwater storage through evapotranspiration mechanism Zadroga, [1976]. [Seyhan, 1977; Fetter, 1980; Chow, 1988; Knapp, 2002; Schipkan et al. 2005; Seiler and Gat, 2007; Dou et al. 2008; Cao et al. 2009]. Inland precipitation transforms into evapotranspiration, and surface/subsurface run-off is. Groundwater and soil moisture consumed by plants are about 50% of the continental water cycle. Seiler and Gat, 2007 report that in humid tropical and temperate climates, 57% of green water is evapotranspirated through forests. Controversially, several researches indicate that forest generates the best possibility in improving soil infiltration capacity [Lee, 1980; Ilstedt et al. 2007;
Bruijnzeel, 2009]. Forest trees produce a lot of mulch that increase organic matters on forest floor. The organic matters made the stable soil structures that provide higher macro pores. In the end, the infiltration capacity of forest soil is much higher than that of non forest land and leads to the improvement of groundwater storage.
Water deficit of 18.8 billion m3 will
happen in Java and Bali Islands in the year 2020. It is increased from the year 2003 with only 13.1 billion m3. Java and Bali
Islands are inhabited by 60% of Indonesian population. In 1986, the population of Java and Bali Island had water provision index of about 1.750 m3/capita/year. That water
provision status was categorized as critical situation based on World Water Resources Institute [Weert, 1994]. Some effort was applied to overcome the water crisis based on re-evaluating the contribution of vegetation cover on baseflow. According to Seyhan, [1977] run-off variation is affected by the relationship between climate and watershed characteristics that can be grouped into two categories: 1) ground factors (topography, soil, geology,
and geomorphology), and 2) vegetation and land cover.
Proportional assessment of vegetation role should consider all the watershed characteristics that include topography, soil, geology, and geomorphology [Seyhan, 1977; Seyhan and Keet, 1981;
Sri-Harto, 1991; Reddy et al. 2004).
There are two objectives to address in this research: 1) to assess the hydrological role of vegetation on baseflow condition; and 2) to study the influence of vegetation cover in relation to catchment characteristics on the baseflow.
Tropical monsoon area and quarter volcanic material of Bali Island absolutely control the correlation among various catchment characteristics. The situation above is the focus of this research.
Researches of the inter-correlation among run-off, forest cover, water loss and evapotranspiration have been done by
Zadroga [1976], Bruijnzeel, [1990] and
Chow, [1988]. Bruijnzeel, [2004] revealed there were no well documented cases that reforestation and soil conservation lead to increase the baseflow. The controversy of forest hydrologic role indicates that our knowledge about the dynamic actions of the vegetative cover on hydrologic and petrologic environment is very limited [Bruijnzeel, 1990].
Water consumed by vegetation is one of the important aspects to be addressed in assessing the forest hydrologic role. In fact, hydrology modelling tends to neglect or to simplify the role of vegetation in hydrologic cycle. The research of Bonell
and Bruijnzeel, [2005] resulted confusing conclusion regarding the role of forest in water reduction. On one side, canopy transpiration and interception were playing double mechanisms of water reduction and of rainfall conservation by forest ecosystem. On the other side, it was concluded that forest conserves water of
about 42% of hydro-electric production value in downstream area.
Furthermore, Weert [1994] reported that run-off coefficient of tropical rain forest is 0,03; that means forest is able to conserve rainfall of about 97% and the rest (3%) is an overland flow. Many facts showed significant relationships between vegetation and direct run-off, although the forest is not a single factor. Forest ability in controlling surface run-off indicates that forest contributes in gaining sub surface water.
The occurrence of vegetation has influenced all run-off components including direct run-off, interflow and baseflow. Groundwater is drained into channel as baseflow, and the baseflow becomes the major component of river stream during dry season. The role of vegetation cover in increasing infiltration and evapotranspiration is the important factor considered in the study of the relationship between vegetation cover and groundwater storage. In the end, baseflow analysis may be applied to assess the relationship between groundwater characteristics and vegetation cover.
THE METHODS
The research was carried out in two steps: field data collection and laboratory data analysis. The field data were collected from 30 watersheds in Bali Island as shown in Fig. 1 Canopy model is applied in this research to assess vegetation cover, instead of plant mechanism and stomata control [Lee, 1980]. Normatively, plant mechanism and stomata control approaches are appropriate for identifying conifer and eucalyptus species. From hy-drological point of view, both species have specific hydrology properties regarding to their capacity in transpiration process [Newson, 1997]. However, these two species are not present in research area.
The watersheds were based on the occurrence of hydrometric instruments. The field data collection has also been done to derive infiltration rate on 21 land systems. The laboratory analysis covered digital filter for baseflow separation from total run-off. The digital image was proposed for canopy density evaluation. The statistical data analysis was applied to assess the correlation among variables.
Baseflow separation and Baseflow recession coefficient
Base flow separation techniques used the time-series record of stream flow to derive the baseflow. The common separation methods were graphical which tend to focus on determining the points of baseflow line that intersects the rising and falling limb of the baseflow response. Graphical methods had limitation of quite subjective and leading to inconsistencies. Base flow separation from the entire hydrograph through digital filter method had suppressed the inconsistency and subjectivity. Two digital filter methods, issued by Lyne Hollick and Chapman [Nathan and McMahon, 1990], were applied in this research. Lyne Hollick equation for baseflow separation is presented in equation (1).
bt qt 1 (1 )
2 (Qt Qt 1)………...(1)
In equation (1), Qt is the stream flow at time step t (day), while qt and bt are the corresponding run-off and baseflow components, is the filter parameter associated with the catchments. Chapman pointed out that the Lyne-Hollick algorithm incorrectly provides a constant stream flow Q or baseflow b respectively when direct run-off has ceased and therefore, he developed the new algorithm in equation (2). ceased, the filter parameter becomes the hydrological recession constant K in equation (3), which is commonly applied to describe baseflow recession during dry season periods.
Qt Q0K
t ………. (3)
Both equation (1) and equation (2) will be evaluated in this this research, and the better one will be applied to separate baseflow from total runoff.
Annual Discharge Publication issued by Bali-Penida Water Resources Service became the source of data.
Vegetation Cover Assessment
Vegetation cover density is a very important indicator in the forest hydrological research. Leaf Area Index (LAI) is the key variable in relation to plant biomass production. Accurate estimation of LAI is required for the prediction of microclimate and various biophysical processes within and below vegetation.
LAI represents a vegetation cover density in the above land surface. The traditional, direct and destructive method of measuring LAI is time-consuming. Modern gap fraction technique may assess LAI fast and easily. LAI application has problem with vegetations of low stratum. Alternatively, remote sensing technique can become the efficient and effective ways to identify LAI.
NDVI (Normalized Difference Vegetation Index) is a widely used spectral reflectance index. NDVI provides good estimation of
LAI and it was applied to estimate LAI
indirectly [Nagler et al. 2004; Fan, 2008]. Landsat 7 ETM+ in path-row 117-066 and 116-066 with spatial resolution 30 m was applied to derive the NDVI. Correlation between LAI and NDVI was computed using simple regression analysis. Indirect non contact LAI measurement by semi hemispherical photograph of vegetation cover was promoted to be more effective
Several researches done by hydrologists showed that morphometry was the key variable in assessing land and water relationship. In this research, there were 4 morphometry variables used to identify geomorphology having contributions toward base flow condition, such as: Length of Watershed (LW), Slope of
Watershed (Sb), Drainage Density (Dd) and Circularity Ratio (Rc).
The 1:25.000 topographic maps
were becoming the source of data and Arc View GIS Software was applied to calculate those variables.
Infiltration
Infiltration Rate (IR) data was collected by direct measurement, using a double ring infiltrometer. Direct Measurement was conducted in the specified land system at such watershed. Infiltration rate at watershed scale was derived by using proportional computation method. All of the research variables are presented in Table 1.
Table 1. List of variables
No. Variable Symbol Unit
Baseflow separation technique
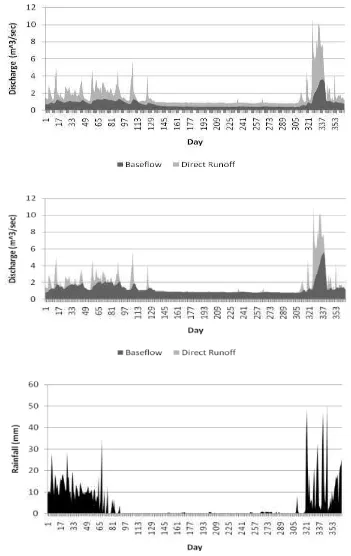
The result of the calculation using equation (1) and equation (2) are presented in Figure 2. Based on the graphical comparison of both methods and clarified by rainfall graphs in Figure 1, it can be application of equation (1) method showed that there was no direct run-off in the dry season (compared to rainfall diagram).
The application of equation (2) was providing different results. There was a significance failure in equation (2) regarding the presence of direct run-off in the dry season. According to Wilson
[1970], stream flow in the dry season is composed mainly by baseflow. In this
season, there is no rainfall contribution and the river flow is contributed by groundwater discharge [Schulz, 1976;
Eckhardt, 2005; de Vries, 1975]. They stated that baseflow is usually associated with water discharged from ground water storage. Considering the theoretical assessment and several hydrologist opinions, it is a reasonable consideration for this research to choose the equation (1) in separating the hydrograph to derive base flow component.
Canopy Density
Figure 2. Hydrograph component of Jogading watershed (Bali Island) derived by equation (1) (upper), equation (2) (middle), and rainfall diagram (lower). All of the graphs present the data
in the year 2003.
Figure 3. Vegetation density assessment using semi hemispherical photograph method in the forest area at Medewi watershed (left, VD = 0.53) and Balian watershed (right, VD = 0.85)
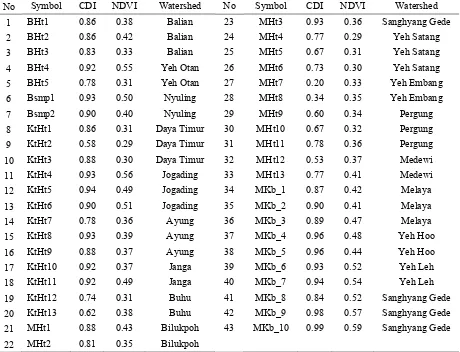
Table 2. Canopy density index (CDI) at various locations with specified NDVI value
No Symbol CDI NDVI Watershed No Symbol CDI NDVI Watershed 1 BHt1 0.86 0.38 Balian 23 MHt3 0.93 0.36 Sanghyang Gede 2 BHt2 0.86 0.42 Balian 24 MHt4 0.77 0.29 Yeh Satang 3 BHt3 0.83 0.33 Balian 25 MHt5 0.67 0.31 Yeh Satang 4 BHt4 0.92 0.55 Yeh Otan 26 MHt6 0.73 0.30 Yeh Satang 5 BHt5 0.78 0.31 Yeh Otan 27 MHt7 0.20 0.33 Yeh Embang 6 Bsmp1 0.93 0.50 Nyuling 28 MHt8 0.34 0.35 Yeh Embang 7 Bsmp2 0.90 0.40 Nyuling 29 MHt9 0.60 0.34 Pergung 8 KtHt1 0.86 0.31 Daya Timur 30 MHt10 0.67 0.32 Pergung 9 KtHt2 0.58 0.29 Daya Timur 31 MHt11 0.78 0.36 Pergung 10 KtHt3 0.88 0.30 Daya Timur 32 MHt12 0.53 0.37 Medewi 11 KtHt4 0.93 0.56 Jogading 33 MHt13 0.77 0.41 Medewi 12 KtHt5 0.94 0.49 Jogading 34 MKb_1 0.87 0.42 Melaya 13 KtHt6 0.90 0.51 Jogading 35 MKb_2 0.90 0.41 Melaya 14 KtHt7 0.78 0.36 Ayung 36 MKb_3 0.89 0.47 Melaya 15 KtHt8 0.93 0.39 Ayung 37 MKb_4 0.96 0.48 Yeh Hoo 16 KtHt9 0.88 0.37 Ayung 38 MKb_5 0.96 0.44 Yeh Hoo 17 KtHt10 0.92 0.37 Janga 39 MKb_6 0.93 0.52 Yeh Leh 18 KtHt11 0.92 0.49 Janga 40 MKb_7 0.94 0.54 Yeh Leh 19 KtHt12 0.74 0.31 Buhu 41 MKb_8 0.84 0.52 Sanghyang Gede 20 KtHt13 0.62 0.38 Buhu 42 MKb_9 0.98 0.57 Sanghyang Gede 21 MHt1 0.88 0.43 Bilukpoh 43 MKb_10 0.99 0.59 Sanghyang Gede 22 MHt2 0.81 0.35 Bilukpoh
1. Linier regression:
with correlation coefficient (r) = 0.56 and determinant coefficient (R2) = 0.3136;
NDVI 0.2946CDI 0.168………...…(4)
2.Exponential regression:
NDVI 0.2234e0.7122KT...(5)
with correlation coefficient (r) = 0.56 and determinant coefficient (R2) = 0.3168.
The results of the correlation test using equation (4) and (5) and Figure 5 do not coincide with the research result of Fan [2008] on correlation between LAI and
that NDVI can be applied to estimate LAI
with correlation coefficient (r) equals to 0.7 and determinant coefficient (R2)
equals to 0.62. Nevertheless, it is still acceptable regarding that the value was higher than the threshold value (0.5) as stated by Gordon [1992].
Carreiras et al. research [2006] in Oak evergreen forest, Portugal proves that
NDVI can be used for identifying canopy density with correlation coefficient (r) = 0.85 and determinant coefficient (R2) =
0.72.
Effectiveness and accuracy of NDVI in assessing canopy density has also been promoted by Martinuzzi et al. [2008] based on their research conducted at dry tropical forest in the Caribbean Islands of Mona, Puerto Rico. He concluded that the
NDVI is a practical tool for identifying vegetation types in areas with a great variety of plant communities and complex relief. NDVI is also possible to be applied to other dry forest habitats of the Caribbean Islands. NDVI is useful for identifying the distribution of forests, woodlands, and shrub land, providing a natural representation of vegetation patterns on the island.
As a result, sixteen land-cover types were mapped over 5,500 ha area, with a kappa coefficient of accuracy equals to 79%. Correlation of Vegetation Cover and
catchment characteristics toward Base flow Characteristics.
The values of all variables to be addressed in this research are presented in Table 3. Simple regression analysis had been applied to assess the inter-correlation among variables. The Correlation matrix of these variables is presented in Table 4.
1. Linier regression:
with correlation coefficient (r) = 0.56 and determinant coefficient (R2) = 0.3136;
NDVI 0.2946CDI 0.168…………..(4)
2. Exponential regression:
NDVI 0.2234e0.7122KT...(5) with correlation coefficient (r) = 0.56 and determinant coefficient (R2) = 0.3168.
The results of the correlation test using equation (4) and (5) and Figure 5 do not coincide with the research result of Fan [2008] on correlation between LAI and
NDVI in Mongolia. Fan research’s showed that NDVI can be applied to estimate LAI
with correlation coefficient (r) equals to 0.7 and determinant coefficient (R2)
equals to 0.62. Nevertheless, it is still acceptable regarding that the value was higher than the threshold value (0.5) as stated by Gordon [1992].
Carreiras et al. research [2006] in Oak evergreen forest, Portugal proves that
NDVI can be used for identifying canopy density with correlation coefficient (r) = 0.85 and determinant coefficient (R2) =
0.72.
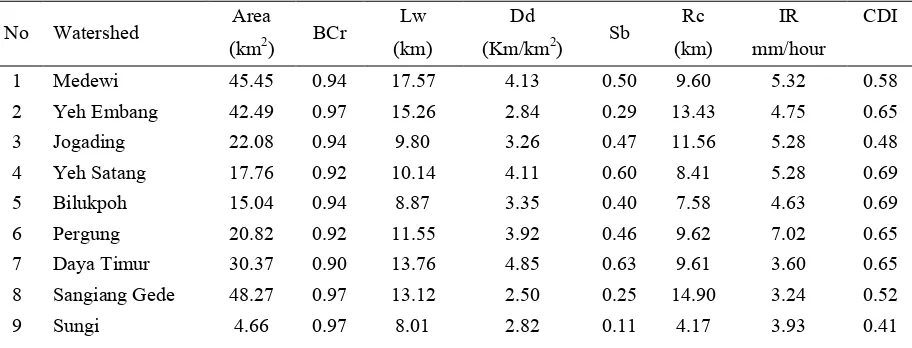
Table 3. Canopy Data recapitulation of all variables
No Watershed Area BCr Lw Dd Sb Rc IR CDI (km2) (km) (Km/km2) (km) mm/hour
1 Medewi 45.45 0.94 17.57 4.13 0.50 9.60 5.32 0.58 2 Yeh Embang 42.49 0.97 15.26 2.84 0.29 13.43 4.75 0.65 3 Jogading 22.08 0.94 9.80 3.26 0.47 11.56 5.28 0.48 4 Yeh Satang 17.76 0.92 10.14 4.11 0.60 8.41 5.28 0.69 5 Bilukpoh 15.04 0.94 8.87 3.35 0.40 7.58 4.63 0.69 6 Pergung 20.82 0.92 11.55 3.92 0.46 9.62 7.02 0.65 7 Daya Timur 30.37 0.90 13.76 4.85 0.63 9.61 3.60 0.65 8 Sangiang Gede 48.27 0.97 13.12 2.50 0.25 14.90 3.24 0.52 9 Sungi 4.66 0.97 8.01 2.82 0.11 4.17 3.93 0.41
10 Yeh Otan 144.87 0.91 16.34 3.73 0.34 13.31 4.22 0.69 11 Yeh Leh 17.40 0.93 7.23 4.22 0.40 11.66 5.49 0.69 12 Yeh Hoo 37.17 0.99 12.59 2.63 0.28 16.09 6.81 0.52 13 Balian 12.10 0.98 6.69 2.53 0.34 7.91 3.44 0.48 14 Sangsang 71.62 0.96 15.03 2.29 0.18 13.55 5.23 0.52 15 Telagawaja 24.14 0.99 11.98 2.53 0.20 11.10 12.83 0.58 16 Janga 29.21 0.98 14.12 2.90 0.33 8.92 15.91 0.48 17 Buhu 7.39 0.92 6.79 4.03 0.35 4.97 3.98 0.52 18 Nyuling 33.17 0.99 8.57 2.46 0.26 9.50 9.48 0.48 19 Sabah Titab 130.46 0.93 15.75 2.58 0.37 12.94 3.13 0.55 20 Daya 78.21 0.96 16.49 3.10 0.43 13.81 7.46 0.52 21 Mendaum 6.84 0.99 5.08 2.28 0.35 4.50 8.27 0.38 22 Penarukan 31.99 0.97 7.98 3.79 0.31 17.57 7.76 0.52 23 Melaya 24.50 0.95 8.49 1.94 0.21 13.07 4.38 0.65 24 Oos 102.49 0.97 16.15 2.41 0.17 17.66 5.42 0.52 25 Banyumala 20.17 0.99 8.01 2.16 0.32 11.66 7.37 0.35 26 Buleleng 12.80 0.91 9.83 4.31 0.43 7.13 4.99 0.72 27 Pakerisan 32.00 0.92 18.68 4.84 0.21 9.63 4.28 0.58 28 Ayung 153.00 0.92 21.93 2.69 0.35 18.05 3.55 0.72 29 Badung 6.73 0.98 6.38 1.74 0.04 5.94 6.80 0.45 30 Petanu 58.41 0.94 18.67 2.63 0.19 11.96 4.94 0.48
Effectiveness and accuracy of NDVI in assessing canopy density has also been promoted by Martinuzzi et al. [2008] based on their research conducted at dry tropical forest in the Caribbean Islands of Mona, Puerto Rico. He concluded that the
NDVI is a practical tool for identifying vegetation types in areas with a great variety of plant communities and complex relief.
Correlation of Vegetation Cover and catchment characteristics toward Base flow Characteristics. The values of all variables to be addressed in this research are presented in the Table 3.
Representation of vegetation patterns on the island. As a result, sixteen land-cover types were mapped over 5,500 ha area, with a kappa coefficient of accuracy equal to 79%.
NDVI is also possible to be applied to other dry forest habitats of the Caribbean Islands. NDVI is useful for identifying the distribution of forests, woodlands, and shrub land, providing a natural.
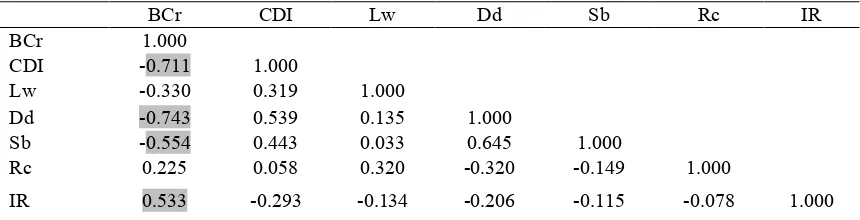
Simple regression analysis had been applied to assess the inter-correlation among variables. The Correlation matrix of these variables is presented in Table 4.
Table 4. Correlation matrix of assessed variables
BCr CDI Lw Dd Sb Rc IR
BCr 1.000
CDI -0.711 1.000
Lw -0.330 0.319 1.000
Dd -0.743 0.539 0.135 1.000
Sb -0.554 0.443 0.033 0.645 1.000
Rc 0.225 0.058 0.320 -0.320 -0.149 1.000
IR 0.533 -0.293 -0.134 -0.206 -0.115 -0.078 1.000
Several explanations can be addressed based on the matrix in Table 4, as follows:
1. There was a negative significant correlation between baseflow recession coefficient and canopy density index. The correlation coefficient value was equal to -0.71. This assessment showed that a canopy density affected groundwater absorption. Increment of canopy density was leading to a reduction of baseflow quantity. These results were in line with several hydrologists’s researches [Smith and Scott, 1992; Dou et al. 2008; Cao et al. 2009; Seiler and
Gat, 2007; Kaimowits, 2004]. According to Bruijnzeel [2009], ’scientific’ perceptions tend to overemphasize high water use of trees.
This result absolutely disputes several opinions which was promoting the positive significance correlation between density of vegetative cover and baseflow quantity as stated by Liu [2004], Dou et al. [2008],
Huang and Zhang [2004] and Dou et al. [2008].
2. The direct influence of vegetation in improving baseflow has not been clearly defined yet. Some hydrologists argue that the indirect role of vegetation is in line with the mulch produced by trees, which is subsequently increasing the organic matter of soil and improving the infiltration capacity [Seyhan, 1975; Lee, 1980; Weert, 1984; Bharati et al. 2002; Davie, 2002].
Improvement of soil infiltration capacity is indicated as driving forces of the baseflow quantity increment. According to Seyhan
[1977], vegetative cover encourages the development of infiltration through overland flow reduction, and leads to a higher opportunity for water transmission to the sub surface zone.
3. The connection between infiltration and base flow condition had been verified in this research. Correlation matrix in Table 4 showed that there was a positive significant correlation between infiltration rate and baseflow recession coefficient (correlation coefficient value is equal to 0.53). The result had proved that soil infiltration was an agent of baseflow development [Ilsted et al. 2007; Yue and Hashino, 2005]. According to Baskent and Keles
[2008], vegetation controls the quantity and quality of water infiltration to the soil, and as a consequence, affects the water supply to groundwater storage and soil moisture. The higher organic matter in the forest floor is leading to the higher infiltration rate in forest land than in non-forest land [Lee, 1980; Weert, 1984;
Purwanto, 1999; Anwar, 2001;
Bharati et al. 2002; Davie, 2002]. Assessment of soil water retention as an impact of soil infiltration capacity is an important watershed hydrology analysis, due to the potency of overland flow and the supply to groundwater storage [Kosugi, 1997].
Groundwater storage is a source of base flow, so that there are some hydromorphometry variables that indicate a weak correlation with the baseflow variable, as shown by the weak correlation between Lw and Rc and Brc.
The hydrologic role of Sb was in line with the potency of drainage event. Sb is the main causative factor in influencing soil water retention [Reddy et al. 2004]. Based on several researches that have been conducted by hydrologists, Dd is a significant hydromorphometry variable in influencing streamflow and water transmission to the lower part of the land surface [Reddy et al. 2004; Seyhan and
Keet, 1981; Soewarno, 1984; Zavoianu, 1985; Talkurputra, 1979]. In principle, the
Dd is a representation of dissection intensity, as a function of the rainfall intensity, geological material, and physiographic response. The Dd
incremental leads to a higher opportunity of water drainage through the channel. The situation affects on the reduction of water infiltration to the lower part of soil horizon, and will decline the baseflow potency. Considering the mechanism of water movement in the earth, Ward [1975] reveals that water movement on the land
surface influences water supply to the groundwater system. The role of morphometry in base flow analysis is very important and it cannot be neglected.
The role of morphometry in influencing Available Water holding Capacity (AWC) of watershed is evidence in Reddy’s research [2004] in Vena watershed, India. His research showed that there were negative significant correlations between
AWC and Dd and Sb. Based on his research, it could be described that the area with intensive surface process tends to locate on a poor AWC site. The analysis reveals that the influence of drainage optometry is very significant in understanding the landform processes, soil physical properties and erosion characteristics.
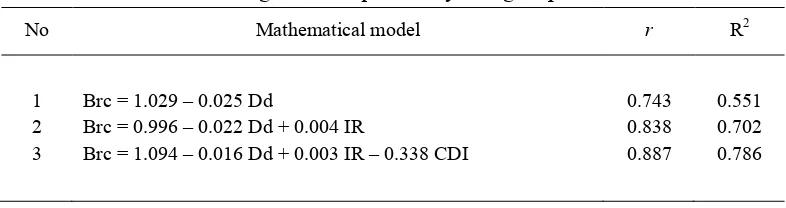
There were significant correlations among independent variables that lead to a difficulty in choosing group of variables for analysis (Table 4). According to the situation above, multi regression analysis was applied by involving all variables to derive the best mathematical model. Mathematical models can be derived using step-wise method as presented in Table 5.
Table 5. Multi regression equation by using step-wise method
No Mathematical model r R2 mathematical model in estimating Brc
value by using significant variables. It was determined based on the highest determinant coefficient value (R2= 0.786).
This result was empirically relevant to the previous researches, in which the finding coincided, establishing and proving several relevance theories, such as:
Dd and Sb values indicate the storage capacity of watershed, and increment of watershed storage capacity affects on the higher quantity of base flow;
2. Vegetation cover density influences the potency of evapotranspiration, and therefore generates the deterioration of groundwater storage and baseflow condition, and increment of canopy cover density quarter volcanic materials of Bali Island, there are two conclusions can be addressed as follows:
1. The enhancement of canopy cover density will generate downward baseflow recession coefficient, despite the fact that it is not a single factor and related to various physical aspects of watershed;
2. Drainage density (Dd), infiltration capacity (IR) and canopy density (CDI) were significance variables in
determining the best
mathematical model of canopy density and base flow recession coefficient correlation, that was:
Brc 1.094 0.016Dd 0.003IR 0.338CDI
REFERENCES
Anwar, S. (2001), The Impact of Different Logging Treatments on Stream flow and Suspended Sediment Concentration in Central Kalimantan, Indonesia, Thesis
submitted for the Degree of Doctor of Philosophy, Unpublished, The University of Edinburgh, (Scotland).
Bharati, L., K.H. Lee, T.M. Isenhart and R.C. Schultz (2002), Soil-Water Infiltration under Crops, Pasture, and Established Riparian Buffer in
Midwestern USA, Agro forestry Systems 56: 249–257.
Bonell, M. and L.A. Bruijnzeel (2005),
Forests, Water and People in the Humid Tropics Past, Present and Future Hydrological Research for Integrated Land and Water Management, Cambridge University Press, Cambridge.
Bruijnzeel, L.A. (2009), Tropical Reforestation and Stream flow: the Need for a Balanced Account, Vrije Universiteit, Amsterdam.
Bruijnzeel, L.A. (1990), Hydrology of Moist Tropical Forests and Effects of Conversion: A State of Knowledge Review, UNESCO
International Hydrology
Programme, Paris.
Bruijnzeel, L.A. (2004), Hydrological Functions of Tropical Forests: not seeing the soil for the trees?
Elsevier Agriculture, Ecosystems and Environment, Science Direct, (104) 185–228.
Carreiras, J. M.B., M.C. Jose´ and J.S. Pereira (2006), Estimation of Tree Canopy Cover in Evergreen Oak Woodlands using Remote Sensing,
Forest Ecology and Management, 223 5–53, doi: 10.1016/ j.foreco. 2005.10.056.
Chow, V.T., D.R. Maidment and L.W. Mays (1988), Applied Hydrology, McGraw-Hill Book Co, Singapore.
Davie (2002), Fundamentals of Hydrology, Routledge 2 Park Square, Milton Park, Abingdon, Oxon, OX14 4RN.
De Vries, J.J. (1975), Groundwater Hydraulics, Communication of Earth Sciences, Free Reformed University, Amsterdam.
Dou, L., M. Huang and Y. Hong (2008),
Statistical Assessment of the Impact of Conservation Measures on Stream flow Responses in a Watershed of the Loess Plateau,
China, Water Resource
Management DOI 10.1007/s11269-008-9361-6.
Eckhardt, K. (2005), How to Construct Recursive Digital Filters for Base flows Separation, Hydro Process, 19, 507–515 (2005), DOI: 10.1002/hyp.5675.
Fan, L.Y. GAO., H. Brück and Ch. Bernhofer (2008), Investigating the Relationship between NDVI and LAI in Semi-arid Grassland in Inner Mongolia Using in - situ Measurements, Theory Appl. Climatology (2009) 95: 151-156. DOI: 10.1007/s00704-007-0369-2 . Fetter, J.J. (1980), Principles of Hydrogeology, McGraw-Hill Book Co, New York.
Gordon, N.D., T.A. McMohan and B.L. Finlayson (1992), Stream Hydrology: An Introduction for Ecologist, John Wiley and Sons, New York.
Ilstedt, Ulrik, Malmer, Anders, Verbeeten, Elke, Murdiyarso, Daniel (2007), the Effect of Afforestation on Water Infiltration in the Tropics: A Systematic Review and Meta-Analysis, Forest Ecology and Management, 251 (2007) 45–51.
Kaimowits, D. (2004), Forests and Water: A Policy Perspective, J For Res
(2004) 9:289–291, DOI
10.1007/s10310-004-0112-0.
Knapp, B. (2002), Elements of Geographical Hydrology, Unwin Hyman, London.
Kosugi, K. (1997), A New Model to
Analyze Water Retention
Characteristics of Forest Soils Based on Soil Pore Radius Distribution, J. For. Res., 2:1-8.
Lee, R. (1980), Forest Hydrology, Columbia University Press, New York.
Martinuzzi, S., W.A. Gould, O.M.R. Gonzalez, A.M. Robles, P.C. Maldonado, N.P. Buitrago and J.J.F. Caban (2008), Mapping Tropical Dry Forest Habitats Integrating Landsat NDVI, Ikonos Imagery, and Topographic Information in the Caribbean Island of Mona. Rev. Biol. Trop. Int. J. Trop. Biol., Vol. 56 (2): 625-639, June 2008.
Nagler P.L., E.P. Glenn, T. L. Thompson and A. Huete (2004), Leaf Area Index and Normalized Difference Vegetation Index as Predictors of Canopy Characteristics and Light Interception by Riparian Species on the Lower Colorado River,
Science Direct – Agricultural and Forest Meteorology,
DOI:10.1016/j.agrformet.-2004.03.008.
Nathan, R.J. and T.A. McMahon (1990), Aassessment of Automated Techniques for Base Flow and Recession Analysis, Water Resources Research, Vol. 26. No. 7, Pages 1465-1473, July 1990.
Newson, M. (1997), Land, Water and Development, Sustainable Management of River Basin Systems, Routledge, London.
Reddy, G.P.O., A.K. Maji and K.S. Gajbhiye (2004), Drainage Morphometry and Its Influence on Landform Characteristics in a Basaltic Terrain, Central India – a
Remote Sensing and GIS
Applied Earth Observation and Geoinformation, 6 (2004) 1–16.
Purwanto (1999), Erosion, Sediment Delivery and Soil Conservation in an Upland Agricultural Catchments in West Java, Indonesia, PhD Thesis, Vrije Universiteit te Amsterdam, Amsterdam.
Schipkan, F., J. Heimann and C. Leuschner (2005), Regional Variation in Canopy Transpiration of Central European Beech Forest,
Oecologia (2005) 143: 260–270 DOI 10.1007/s00442-004-1798-6.
Schulz, E.F. (1976), Problems in Applied Hydrology. Water Resources Publication, Foat Collins, Colorado.
Seiler, K.P. and J.R. Gat (2007),
Groundwater Recharge form Run-off, Infiltration and Percolation, Springer, Dordrecht.
Seyhan, E. (1975), Fundamentals of Hydrology, Geografisch Institute der Rijkuniversiteit, Utrecht.
Seyhan, E. (1977), Mathematical Simulation of Watreshed Hydrologic Processes, Geografisch Institute der Rijkuniversiteit, Utrecht.
Seyhan, E. and Keet (1981), Multivariate Statistical Analysis, Application to Hydromorphometrical Data, Communications of the Institute of Earth Sciences, Free Reformed University – Amsterdam.
Sri-Harto (1991), Hidrologi Terapan, Biro Penerbit Keluarga Mahasiswa Teknik Sipil, Fakultas Teknik UGM, Yogyakarta (in bahasa).
Soewarno (1984), Model for Estimating Flood Discharge of the Java
Rivers, Majalah Geografi Indonesia, No. 14-15 Tahun 8-9.
Yue, S. and M. Hashino (2005), Statistical Interpretation of the Impact of Forest Growth on Stream flow of the Sameura Basin, Japan,
Environmental Monitoring and Assessment, 104: 369–384.
Zavoianu, I. (1985), Morphometry of Drainage Basin, Editura Academiei.
Ward, R.C. (1975), Principles of Hydrology, McGraw-Hill Book Company, London.
Weert, V.D. (1994), Hydrological Conditions in Indonesia, Delft Hydraulics, Delft.