Board of Commissioners
/
Dewan Komisaris
• Adrian Hau Chak (President Commissioner) • Ferenz Cendrawasih (Independent Commissioner) • Julian W. Wong (Commissioner)
Board of Directors
/
Dewan Direksi
• Surojit Ghosh (President Director - Acting)• Frankie Ma Ngon • Chow Chi Keung
• Sujoko Efferin (Non Affiliated)
Independent Audit Committee
/
Komite Audit Independen
• Ferenz Cendrawasih• Lea Buntaran • Hempy Ali
Shareholders
/
Pemegang Saham
• Eastern Cotton Mills Ltd. 25.00 % • South Indonesian Holdings Ltd. 22.50 % • PT Wakala Korpora Indonesia 10.68 % • Continuity Developments Ltd. 2.50 %
• Public 39.32 %
Type of Shares
/
Jenis Saham
• Script Share / Saham Warkat 47.97% • Scriptless Share / Saham Nonwarkat 52.03%
Registered Office
/
Kantor Pusat
• Sentra Bisnis Tanjung Duren
Jl. Tanjung Duren Utara Blok C No. 3B West Jakarta 11470, Indonesia.
Executive Office
/
Kantor Eksekutif
• Jalan Raya Margorejo Indah No.4, Surabaya 60238, Indonesia.
Factory
/
Pabrik
• Jalan Raya Soekarno Hatta No.23, Probolinggo, Indonesia.
Major Bankers
/
Bank Utama
• HSBC • DBS
Auditors
/
Akuntan Publik
• Paul Hadiwinata, Hidajat, Arsono, Ade Fatma & Rekan Registered Public Accountants
Attorneys
/
Penasehat Hukum
• DNC Advocates at Work • Markus Sajogo & Associates
Share Registrar
/
Biro Administrasi Saham
• P.T. Sirca Datapro Perdana Fu
Management
/
Manajemen
• (President Director - Acting) • Frankie Ma Ngon (Chief Operating Officer) • Vincent Luk (Marketing Manager)
No. of Employees
/
Jumlah Karyawan
• 2,079 employees / karyawan
Authorized Capital
/
Modal Dasar
• Rp 196.4 billion / milyar • 392,944,000 shares / saham
Par Value of Share
/
Harga Saham Nominal
• Rp 500 per share / per saham
Paid Up Capital
/
Modal Disetor
• Rp 49.1 billion / milyar
Product Lines
/
Jenis Produk
• Garments / Pakaian Jadi
Marketing & Distribution
/
Pemasaran &
Distribusi
• Export / Ekspor 97 %
• Domestic / Domestik 3 %
Subsidiary Companies
/
Anak Perusahaan
1. P.T. Asiatex Garmindo
Gd. Menara Kadin Indonesia Lt. 30 Jl. HR. Rasuna Said Blok X-5 Kav 2-3 Kuningan Timur, Setiabudi
South Jakarta 12950, Indonesia
93.55 % owned by the Company / 93,55 % dimiliki oleh Perusahaan
2. P.T. Eratex (Hongkong) Limited Registered Office / Kantor Pusat Unit D, 4/F, Effort Industrial Building
2 – 8 Kung Yip Street
Kwai Hing, Kwai Chung, NT, Hong Kong 100% owned by the Company / 100% dimiliki oleh Perusahaan
3. P.T. Eratex Garment
Registered Office / Kantor Pusat Sentra Bisnis Tanjung Duren
Jl. Tanjung Duren Utara Blok C No. 3B West Jakarta 11470, Indonesia
are committed to be a global leader in providing
Quality apparel products
2009 was another difficult year for the garment industry as the economies in the US
and European Union continued to struggle while recovery is not in the near horizon.
For Eratex, phasing out the textile division was a move in the right direction. This has
effectively reduced fixed overhead thus cutting losses by a very significant margin.
As of now, the viability of this operation hangs on the balance subject to the positive
impact of the global economic recovery. On a more upbeat note, I am happy to report
that recently the Company has reached a successful restructuring agreement with its
main lender. This will allow the Company to stabilize its business and grow its
customer base.
At this point our primary lender is supportive despite the many challenges and the
order book for the rest of the year looks encouraging. In this volatile market it would
be speculative to make any further predictions for the future.
Despite the many setbacks we have built a strong management team and their
efforts to operate under extreme adverse market condition and to combat the
financial pressure are little less than remarkable. Last but not least, we owe a round
of thanks to our major banker for their confidence in our efforts.
Adrian H. C. Fu
President Commissioner
Financial Review
The Global Economic Crisis that had started in August 2008 soon gathered pace and by early
2009 the major markets where the Company sells its products were in recession. With the
closure of the Textiles operations in late 2008, the company was entirely focused on
garments revenue which is generated by exports to the North American & European Union
markets.
The financial year ended 31st December year 2009 saw the full impact of the worst drop in
consumer confidence and reduction in the demand in many decades for the company’s core
apparel products in the mid to upper end of the price spectrum. This resulted in a reduction of
sales revenue from Garments sales from Rp 334.3 Billion to Rp 247.1 billion or by 26%.
The reduction of turnover was also accompanied by a trend of reducing gross margins from
13.8% in 2007 to 6.4% in 2008 and a further drop to 5.75% in 2009. The most damaging
trend, however, was that as a result of the pressures on prices many buyers moved their
vendor base to cheaper manufacturing cost nations in South Asia. This significantly reduced
the customer base of your Company.
The Company was in the process of negotiating a restructuring of its debts with the major
lenders. Since this process was not completed till the end of the financial year 2009 the
interest burden for the year was still at a very high level compared to the reduced sales
revenue base. As stated later in this report, this restructuring has since been partly
completed.
The consolidated net loss for the year was Rp 25.3 billion as compared to Rp 110.3 billion in
2008 in spite of the reduced sales largely due to reduction in operating costs, closure of non
profitable manufacturing plants and favorable exchange rates caused by the strengthening
of the Rupiah. The Rupiah exchange rate at the year end was 14% stronger than in the
previous year. While this bodes well for the restatement of foreign currency denominated
liabilities on the Company’s Balance Sheet, it does not assist in competitive marketing as
35% of costs are incurred in the domestic currency.
The consolidated accumulated loss remains high at Rp 208.8 billion and the capital
deficiency is Rp 158.3 billion.
Business Review
The sole business of the company in this financial year was garments as the textiles division
generated little revenue. The reduction in off take & erosion of the Company’s customer base
soon saw that sales turnover drop after the peak season in the first quarter of 2009.
The company suffered severe pressure on prices, smaller order volumes and shortened lead
times enforced by a customer profile where most buyers were operating in a risk averse
environment with the US economy struggling with job losses till end of the year.
• Downsizing and relocation of its Jakarta office to reduce fixed cost & rationalization and
downsizing at its main operational office in Surabaya to reduce overhead costs.
• Addition of new marketing staff to drive the acquisition of new customers along with a
strategic change in the direction in marketing to add large volume buyers to increase
efficiency and productivity at the manufacturing site.
• Flexibility in pricing to ensure that the customer base is increased and risks reduced.
• Work closely with its bankers to enter in to a restructuring plan whereby the interest
bearing debt is reduced significantly and trade facilities kept at adequate levels to grow
the business.
Business Outlook
The successful implementation of this restructuring exercise with its main lender in 2010
has resulted in stabilizing the Company and enabling the management to institute
operational changes to increase revenue & profits
The steps outlined above have resulted in a growth in customer base. The Company has
retained the ability to service the shirts customers by having certain sewing lines capable of
producing shirts as well as other core items like trousers and casual bottoms.
At this point it appears that main markets of the company are showing a small degree of pick
up in consumer confidence and it is hoped that demand for the company’s products will
increase from the third quarter of this year. While the first half of this year has not seen a
positive result. Its is hoped that the actions taken by the management and key strategic
decisions as outlined above will lead to the current year to be better than the year 2009 from
an operational perspective.
It is also to be noted that the higher cost of labour in China and possible strengthening of the
Yuan will in the medium term be beneficial to the prospects of garments manufacturing in
Indonesia. The further strengthening of the Rupiah is a cause for concern as is any signs of
any negative trend in the nascent recovery that we are beginning to see in the USA.
Appreciation
We would like to thank all our employees, customers, suppliers, bankers and shareholders
for their continuous support in this very difficult time and we will strive hard to achieve the
objectives that we have set out to achieve.
Surojit Ghosh
Sincerely,
PT Eratex Djaja Tbk. Audit Committee, whose members include Ferenz Cendrawasih,
Chairman, and Lea Buntaran and Hempy Ali as members, is established by and responsible to
the Board of Commissioners of the Company.
The task of the Audit Committee is to assist the Board of Commissioners in its oversight
responsibilities relating to, among other duties;
1. Accounting and financial reporting principles and procedures for the Company.
2. The adequacy of the Company’s systems of internal control over financial reporting.
3. The quality and integrity of the Company’s financial statements.
4. The practice of good corporate governance in the company.
During the year of 2009-1010, the Audit Committee has conducted several meetings. The
Audit Committee reviewed and discussed the following items during these meetings:
a. The audit plans of the external and internal auditors, the results of their examination and
evaluation of the systems of internal controls and remedial action taken.
b. The financial statements and auditors’ report of the Company before their submission
to the Board of Commissioners.
c. Compliance with the relevant laws and regulations and with the Company’s statement
of Business Conduct.
d. The independence and objectivity of the external auditors.
e. Relevant business issue in so far the related to the management of business risk and
internal controls.
f. Special emphasis is given at the practice and application of the Good Corporate
Governance and Corporate Social Responsibility.
The Audit Committee also expressed concern to the improvement of the financial situation of
the Company, especially the Company has reached a successfully restructuring agreement
with its main lender which shows that the management of PT Eratex Djaja Tbk. have taken
strategic moves.
The Audit Committee has met its duties and responsibilities in accordance with the guideline
required.
Jakarta, 5 July 2010
Audit Committee of PT Eratex Djaja Tbk.
HASIL USAHA
/ Pendapatan 439.977 631.987 580.863 528.108 426.083 / Laba kotor (1.999) 72.462 59.094 68.071 56.988 / Laba (rugi) usaha (59.815) 12.119 2.830 19.997 12.478
/
Laba (rugi) sebelum pajak penghasilan badan (109.901) (30.778) (4.365) (12.032) (24.481) / Laba (rugi) bersih (110.336) (2.511) (6.050) (16.412) (23.253)
248.200
Income (loss) before corporate income tax Net income (loss)
PER SHARE DATA
Operating income (loss) Net income (loss)
No. of shares issued (in thousand)
DATA PER LEMBAR SAHAM
/ Jumlah aktiva 169.256 293.442 307.056 298.199 297.188 / Jumlah kewajiban 303.895 316.128 325.850 310.131 293.074 / Ekuitas (134.648) (22.695) (18.803) (14.518) 1.443 / Modal kerja (151.672) (84.058) (53.620) (49.180) 20.580
97.776 Net income (loss) to total assets Current ratio
Quick ratio
Total debts to total assets
RASIO KEUANGAN
/
Laba kotor terhadap pendapatan 0% 11% 10% 13% 13% /
Laba (rugi) usaha terhadap pendapatan -14% 2% 0% 4% 3% /
Laba (rugi) bersih terhadap jumlah aktiva -65% -1% -2% -6% -8% / Rasio lancar 0,37 0,69 0,78 0,79 1,12
We, the undersigned, in our capacity as the member of Board of Commissioners and Board of Directors of PT.
Eratex Djaja Tbk fully responsible on the printed Annual Report of the Company for the year 2009.
This statement letter is made truthfully.
Date: 6 July 2010
The Board of Commissioners:
Adrian Fu Hau Chak
President Commissioner
Julian Wong Wai Chua
Ferenz Cendrawasih
Commissioner
Independent Commissioner
The Board of Directors:
Surojit Ghosh
Frankie Ma Ngon
President Director (acting)
Director
Norman Chow Chi Keung
Sujoko Efferin
HASIL USAHA
/ Pendapatan 40,181 67,097 64,397 53,724 45,864 / Laba kotor (183) 7,693 6,551 6,925 6,134 / Laba (rugi) usaha (5,463) 1,287 314 2,034 1,343
/
Laba (rugi) sebelum pajak penghasilan badan (10,037) (3,268) (484) (1,224) (2,635) / Laba (rugi) bersih (10,076) (267) (671) (1,670) (2,503)
26,404 1,562 (3,509)
(2,496) (2,699)
as restated as restated
OPERATING RESULTS
Revenue Gross income
Operating income (loss)
Income (loss) before corporate income tax Net income (loss)
PER SHARE DATA
Operating income (loss) per share Net income (loss)
No. of shares issued (in thousand)
DATA PER LEMBAR SAHAM
/
Laba (rugi) usaha per lembar saham (0.06) 0.01 - 0.02 0.01 / Laba (rugi) bersih (0.10) - (0.01) (0.02) (0.03)
/
Jumlah saham beredar (dalam ribuan rata-rata) 98,236 98,236 98,236 98,236 98,236
(0.04) (0.03) 98,236
FINANCIAL POSITION
Total assets Total liabilities
Total shareholders' equity Working capital
POSISI KEUANGAN
/ Jumlah aktiva 15,457 31,154 34,042 30,335 31,990 / Jumlah kewajiban 27,753 33,563 36,125 31,549 31,547 / Ekuitas (12,297) (2,409) (2,085) (1,477) 155 / Modal kerja (13,851) (8,925) (5,945) (5,003) 2,215
10,402 27,246 (16,845)
(7,076)
FINANCIAL RATIOS
Gross income to revenue
Operating income (loss) to revenue Net income (loss) to total assets Current ratio
Quick ratio
Total debts to total assets
RASIO KEUANGAN
/
Laba kotor terhadap pendapatan 0% 11% 10% 13% 13% /
Laba (rugi) usaha terhadap pendapatan -14% 2% 0% 4% 3% /
Laba (rugi) bersih terhadap jumlah aktiva -65% -1% -2% -6% -8% / Rasio lancar 0.37 0.69 0.78 0.79 1.12 / Rasio cepat 0.12 0.20 0.26 0.26 0.34
/
Kewajiban terhadap jumlah aktiva 1.80 1.08 1.06 1.04 0.99
6% -13% -26% 0.42
0.05 2.62
EXCHANGE RATE
/ KURS
ASSETS, LIABILITIES & EQUITY STRUCTURE
Struktur Aset, Kewajiban & Modal
LIQUIDITY RATIOS
Rasio Likuiditas
In million Rupiah
REVENUE
Pendapatan
P.T. Eratex Djaja Tbk.
AVERAGE PRICE OF SHARE 2009
Rata-rata Harga Saham
Highest Lowest Closing Average
250
Highest Lowest Closing Average
Report No. 062/PHAA-S/GA/VI/2010
Independent Auditor’s Report
The Shareholders, Board of Commissioners and Directors
PT ERATEX DJAJA Tbk
We have audited the consolidated balance sheets of PT Eratex Djaja Tbk (the “company”) and its Subsidiaries as of
December 31, 2009 and 2008, and the related consolidated statements of income, changes in equity and cash flows for
the years then ended. These financial statements are the responsibility of the Company’s management. Our
responsibility is to express an opinion on these consolidated financial statements based on our audit. We did not audit
the financial statements of PT Eratex (Hong Kong) Ltd, a consolidated subsidiary, whose statements reflect total assets
and liabilities constituting 5,42% and 0,78%, respectively, of the consolidated total assets and liabilities as of December
31, 2009 and total revenue constituting 3,44% of the consolidated net income for the year then ended. Those financial
statements were audited by other independent auditors, whose report dated April 26, 2010 expressed an unqualified
opinion has been furnished to us, and our opinion, in so far as it relates to the amounts included for PT Eratex (Hong
Kong) Ltd, is based solely on the report of the other independent auditors.
We conducted our audit in accordance with auditing standards established by the Indonesian Institute of Certified Public
Accountants. Those standards require that we plan and perform the audit to obtain reasonable assurance about whether
the financial statements. An audit also includes assessing the accounting principles used and significant estimates
made by management, as well as evaluating the overall financial statement presentation. We believe that our audit
provides a reasonable basis for our opinion.
In our opinion, based on our audit and the report of other independent auditors, the consolidated financial statements
referred to above present fairly, in all material respects, the consolidated financial position of PT Eratex Djaja Tbk and its
Subsidiaries as of December 32, 2009 and 2008, and the consolidated results of their operations and their consolidated
cash flows for the years then ended in conformity with generally accepted accounting principles in Indonesia.
The accompanying consolidated financial statements have been prepared assuming that the company will continue to
operate as a going concern. Note 36 to the consolidated financial statements summarizes the effects of the economic
conditions in Indonesia on the Company, as well as the measure the Company have implemented and plan to implement
in response to these of the economic conditions have contributed to the Company’s consolidated net loss and capital
deficiency. These matters indicate the existence of a material uncertainly about the Company’s ability to continue as a
going concern.
PAUL HADIWINATA, HIDAYAT, ARSONO, ADE FATMA & REKAN
Handriono,CPA
Public Accountant License No. 09.1.1032
Member of PKF International Limited, an association of legally independent member firms.
Surabaya Branch Office Tel +6231 501 2161 (hunting) | Fax +6231 501 2335 Email: [email protected] | www.pkfhadiwinata.com
December 31, 2009
PT. Eratex Djaja Tbk. and subsidiaries
We the undersigned below :
Name
: Surojit Ghosh
Office address
: P.T. Eratex Djaja Tbk. ,
Raya Margorejo Indah no.4, Surabaya
Domicile address/according KTP or
other ID card
: Raya Margorejo Indah no.4, Surabaya
Phone number
: (62 31) 8439004
Position
: Acting President Director
Name
: Frankie Ma Ngon
Office address
: P.T. Eratex Djaja Tbk. ,
Soekarno Hatta no.23, Probolinggo
Domicile address/according KTP or
other ID card
: Soekarno Hatta no.23, Probolinggo
Phone number
: (62 335) 421866
Position
: Director
State that :
1. Responsible for the preparation and presentation of the Company’s financial statements.
2. The Company’s financial statements have been prepared and presented in accordance with generally accepted
accounting principles.
3. a. All Information contained in the Company’s financial statements are complete and correct.
b. The Company’s financial statements do not contain misleading material information or facts,
and do not omit material information and facts.
4. Responsible for the Company’s internal control system.
This statement letter is made truthfully.
Acting President Director
LIABILITIES, MINORITY INTEREST
TOTAL CURRENT LIABILITIES 114,638,800 229,381,048 12,196 20,948
LONG-TERM LIABILITIES
Payables to related parties 2m, 18 18,954,476 21,900,000 2,016 2,000 Consumer finance payable, net of
current maturity portion 20 16,063 - 2 - Long-term loans, net of current
maturity portion 21 112,099,770 31,310,156 11,926 2,859 Provision for employee service entitlements 2o, 23 10,194,583 10,126,028 1,085 925
TOTAL LONG-TERM LIABILITIES 141,264,892 63,336,184 15,028 5,784
TOTAL LIABILITIES 255,903,692 292,717,232 27,224 26,732
MINORITY INTEREST IN
SUBSIDIARIES' NET ASSETS 2b, 24 9,260 9,260 1 1
CAPITAL DEFICIENCY
Share capital:
Nominal value of Rp 500 (in full Rupiah) per share. Authorized capital of 392,944,000 shares.
Issued and fully paid-up
98,236,000 shares. 25 49,118,000 49,118,000 5,225 4,486 Additional paid-in capital, net 26 1,437,950 1,437,950 153 131 Exchange difference due to
financial statement translations 2c (38,058) (1,712,496) (4) (156) Deficits (208,862,748) (183,491,046) (22,219) (16,757)
TOTAL CAPITAL DEFICIENCY (158,344,856) (134,647,592) (16,845) (12,297)
TOTAL LIABILITIES FROM
INTEREST AND CAPITAL DEFICIENCY 97,775,952 169,256,288 10,402 15,457
ASSETS
CURRENT ASSETS
Cash and cash equivalents 2e, 4 1,847,862 1,763,668 197 161 Trade receivables - third parties,
net of provision for doubtful accounts of nil in 2009 and
Rp 217,266 in 2008 2f, 5 3,275,271 15,091,091 348 1,378 Other receivables - third parties,
net of provision for doubtful accounts of Rp 320,505 in 2009
and Rp 338,524 in 2008 6 746,990 4,137,558 79 378 Inventories, net of provision for
declining in value of Rp 203,356 in 2009
and Rp 2,324,324 in 2008 2g, 7 38,638,502 53,133,469 4,110 4,852
Long-term investments, net of provision for declining in value of investment
of Rp 277,500 in 2009 and 2008 2i, 10 - - - -
amortization of Rp 512,271 in 2009
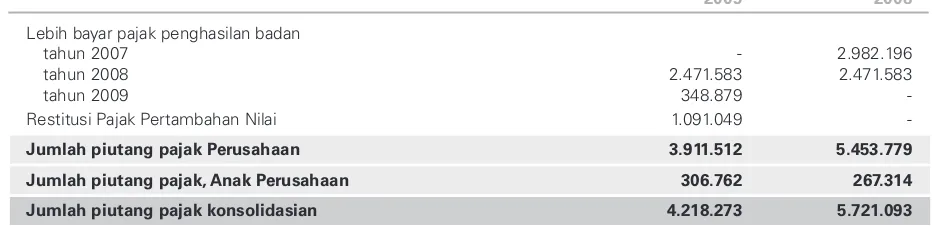
and Rp 386,340 in 2008 2l, 12 1,346,949 1,449,326 143 132 Taxes receivable 22e 4,218,273 5,721,093 449 522 Guarantee deposits 85,647 394,308 9 36 Asset held for sale 2j 489,854 - 52 -
TOTAL NON-CURRENT ASSETS 41,799,842 51,770,077 4,447 4,728
CONTINUING OPERATION
REVENUE 2d, 27 247,105,382 334,279,727 26,288 30,528
COST OF REVENUE 2d, 28, 29, 30 232,880,876 313,029,007 24,775 28,587
GROSS MARGIN 14,224,506 21,250,720 1,513 1,941
OPERATING EXPENSES:
Selling expenses 2d, 31 11,871,444 17,119,221 1,263 1,563 General and administration expenses 2d, 32 35,208,527 33,230,523 3,746 3,035
Total operating expenses 47,079,971 50,349,744 5,009 4,598
OPERATING LOSS (32,855,465) (29,099,024) (3,495) (2,657)
OTHER INCOME (EXPENSES):
Interest income 2d 25,850 36,157 3 3 Interest expense (19,498,626) (16,500,390) (2,074) (1,507) Loss from investments 2i - (246,125) - (22) Foreign exchange gain (loss), net 2c 27,587,958 (18,163,501) 2,935 (1,659) Gain on disposal of fixed assets 11 387,269 1,480,569 41 135 Provision for declining in inventories value 2g, 2q 1,077,103 (1,280,459) 115 (117) Provision for doubtful accounts 2f (320,505) - (34) - Claim (1,477,322) - (157) - Loan waiver 21 1,880,000 - 200 - Others 310,741 (4,181,095) 33 (382)
Total other income (expenses), net 9,972,468 (38,854,844) 1,061 (3,548)
LOSS BEFORE CORPORATE INCOME TAX (22,882,997) (67,953,868) (2,434) (6,206)
Income tax benefits (expenses): 2n, 22c
Current (237,721) (566,287) (25) (52) Deferred (1,168,591) (2,378,005) (124) (217)
LOSS BEFORE MINORITY INTEREST (24,289,309) (70,898,160) (2,584) (6,475)
Minority interest in loss of subsidiaries 2b, 24 - - - -
NET LOSS FROM CONTINUING
OPERATION (24,289,309) (70,898,160) (2,584) (6,475)
DISCONTINUING OPERATION
NET LOSS FROM DISCONTINUING OPERATION 2p, 3 (1,082,393) (39,438,290) (115) (3,602)
Net loss per share from all operations
(full Rupiah amount) 2r (258) (1,123) (0) (0) Net loss per share from continuing operation
(full Rupiah amount) 2r (247) (722) (0) (0)
Notes 2009 2008
(Rp) (Rp) (US$) (US$)
2009 2008
NET LOSS FROM ALL OPERATIONS (25,371,702) (110,336,450) (2,699) (10,076)
Balance as of
December 31, 2007 49,118,000 1,437,950 154,431 160,474 (257,009) (73,309,027) (22,695,181) Net loss for 2008 - - - (110,336,450) (110,336,450) Reversal of assets
revaluation increment due to adoption of
PSAK No.16 (Revised 2007) (154,431) 154,431 - Realized losses on
marketable securities 257,009 257,009 Translation of the
financial statements of foreign Subsidiary
Companies - - - (1,872,970) - - (1,872,970)
Balance as of
December 31, 2008 49,118,000 1,437,950 - (1,712,496) - (183,491,046) (134,647,592)
Net loss for 2009 - - - (25,371,702) (25,371,702) Translation of the
financial statements of foreign Subsidiary
Companies - - - 1,674,438 - - 1,674,438
Balance as of
December 31, 2009 49,118,000 1,437,950 - (38,058) - (208,862,748) (158,344,856)
Balance as of December 31, 2008
in US$ 4,486 131 - (156) - (16,757) (12,297)
Balance as of December 31, 2009
in US$ 5,225 153 - (4) - (22,219) (16,845)
Exchange Unrealized difference losses on Issued Additional Revaluation on marketable
a. Company history
PT ERATEX DJAJA Tbk (the "Company") was established in the framework of Foreign Capital Investment Law No.1, 1967 by Notarial Deed No.7 dated October 12, 1972 based on Deed prepared by Koerniatini Karim, Public Notary in Jakarta. The Company's Articles of Association have been amended several times, made on June 15, 2004 by Notarial Deed No. 79 prepared by Sutjipto, S.H., Public Notary in Jakarta concerning the change of the Company's name from PT Eratex Djaja Ltd Tbk to PT Eratex Djaja Tbk and an increase in the authorized capital to Rp 196,472,000. This amendment was approved by the Minister of Justice and Human Rights of the Republic of Indonesia under decision letter No. C-21010 HT.01.04.TH.2004 dated August 20, 2004; and the latest amendment was made on November 4, 2008, by Notarial Deed No.2 prepared by Wahyu Nuraini, S.H, Public Notary in Jakarta concerning the change of notarial deed of establishment to conform with Corporate Law No.40 Year 2007 on Limited Liabilities Companies. On July 28, 2009, the notarial deed has been approved by the Minister of Regulation and Law with decision letter number AHU-0046846.AH.01.09.
The activities of the Company are integrated textile manufacturing, including spinning, weaving, finishing, garment making and sells its products in both local and export markets.
The Company commenced its commercial operations in 1974.
The Company's factory is located at Jl. Soekarno-Hatta, Probolinggo, East Java. As of December 31, 2009 and 2008, the Company had 2,079 employees and 2,922 employees, respectively. The Company's registered office is in Jakarta with an executive office in Surabaya, and a branch in Hongkong opened in 1990.
On August 21, 1990, the Company registered its shares on the Stock Exchange of Indonesia in accordance with approval of the Minister of Finance of the Republic of Indonesia no. SI-125/SHM/MK.10/1990 dated July 14, 1990. Since 2000, all shares have been registered on the Jakarta Stock Exchange and the Surabaya Stock Exchange (known as Indonesia Stock Exchange in present).
The compositions of the Board of Commissioners, Board of Directors and Independent Audit Committee of the Company as of December 31, 2009 and 2008 were as follows:
December 31, 2009 December 31, 2008
Board of Commissioners Board of Commissioners
President Commissioner : Adrian Hau Chak Fu President Commissioner : Adrian Hau Chak Fu Independent Commissioner : Ferenz Cendrawasih Independent Commissioner : Juergen Ulrich Schreiber Commissioner : Julian Wong Wai Chua Commissioner : Julian Wong Wai Chua Board of Directors Board of Directors
President Director (Acting) : Surojit Ghosh President Director : Joseph Chan Wing Tai Director : Frankie Ma Ngon Executive Director : Frankie Ma Ngon Director : Chow Chi Keung Director : Chow Chi Keung Director Non-Affiliated : Sujoko Efferin Director Non-Affiliated : Sujoko Efferin Independent Audit Committees Independent Audit Committees
Ferenz Cendrawasih Juergen Ulrich Schreiber Hempy Ali Frans P. Iskandar Lea Buntaran Joseph Kwan
The total remuneration of the Board of Commissioners of the Company for the years 2009 and 2008 were amounted to Rp 109,472 and Rp 120,422, respectively, while total remuneration of the Board of Directors of the Company for the years 2009 and 2008 were amounted to Rp 2,445,791 and Rp 3,818,506, respectively.
GENERAL
01
CONTINUED OPERATION
CASH FLOWS FROM OPERATING ACTIVITIES:
Cash received from customers 251,661,125 351,333,069 26,772 32,085 Cash paid to suppliers (132,545,597) (202,048,259) (14,101) (18,452) Cash paid to employees (90,305,787) (98,644,958) (9,607) (9,009) Cash paid for operating expenses (25,014,507) (37,235,598) (2,661) (3,401)
Cash generated from operations 3,795,234 13,404,254 404 1,224
Income tax payment 1,194,007 (4,917,027) 127 (449) Cash received from (paid to) others 6,589,219 (5,086,187) 701 (464)
Net cash provided by operating activities 11,578,460 3,401,040 1,232 311
CASH FLOWS FROM INVESTING ACTIVITIES:
Decrease of short-term investments - 163,270 - 15 Purchases of fixed assets (991,592) (1,259,162) (105) (115) Interest received 25,850 36,157 3 3 Proceeds from sale of fixed assets 5,663,000 3,228,868 602 295 Cash received from proceed of fixed assets - 7,510,589 - 686 Decrease of other assets 102,377 67,448 11 6
Net cash provided by investing activities 4,799,635 9,747,170 511 890
CASH FLOWS FROM FINANCING ACTIVITIES:
Proceed from short-term and long-term
bank loans 3,204,725 3,400,768 341 311 Interest paid (19,498,626) (16,500,390) (2,074) (1,507)
Net cash used in financing activities (16,293,901) (13,099,622) (1,733) (1,196)
NET DECREASE IN CASH AND CASH
EQUIVALENTS CONTINUING OPERATION 84,194 48,589 9 4
DISCONTINUING OPERATION
Net cash used in operating activities (20,947,711) (22,204,294) (2,228) (2,028) Net cash provided by investing activities 17,165,863 26,270,865 1,826 2,399 Net cash used in financing activities (126,405) (2,781,346) (13) (254)
NET INCREASE (DECREASE) IN CASH AND CASH
EQUIVALENTS FROM DISCONTINUING OPERATION (3,908,253) 1,285,225 (416) 117
NET INCREASE (DECREASE) IN CASH AND
CASH EQUIVALENTS FROM ALL OPERATION (3,824,059) 1,333,813 (407) 122
SUMMARY OF SIGNIFICANT ACCOUNTING POLICIES
(continued)
02
a. Basis of Preparation of Consolidated Financial Statements (continued)
The consolidated financial statements, presented in thousands of Rupiah (and the translation in thousands of United States dollars), unless otherwise stated, have been prepared on the accrual basis using the historical costs, except for certain accounts which are measured on the basis described in accounting policies of the related accounts.
The consolidated statements of cash flows have been prepared using the direct method in accordance with the decision letter No. Kep-06/PM/2000 dated March 13, 2000 of the Capital Market Supervisory Board.
b. Principles of Consolidation
The consolidated financial statements, include the Company’s financial statements and the financial statements of all Subsidiaries, are controlled by the Company. Control is presumed to exist when more than 50% of a Subsidiary’s voting power is directly or indirectly controlled by the Company; or the Company is able to govern the financial and operating policies of a Subsidiary; or control the removal or appointment of a majority of a Subsidiary’s board of directors.
In the term of either began or ceased in one certain year during the year, the results included in the consolidated financial statements are limited only by the result when the control commenced or up to the date control ceased.
Inter-company balances and transactions, including unrealized income/loss, have been eliminated to present the financial position and results of operations of the Company and its Subsidiaries as a single company entity.
Minority interest in net income (loss) an equity of the Subsidiaries is presented on a proportional basis with the right of minority shareholders over net income/loss and equity of the Subsidiaries.
c. Foreign Currency Translation
Transactions and balances
The Company maintains its accounting records in Rupiah. Transactions in foreign currencies are recorded at the prevailing rates of exchange in effect on the date of the transactions.
At the balance sheet dates, all foreign currency monetary assets and liabilities are translated in the Rupiah currency using prevailing middle rate of Bank Indonesia on that date. The net foreign exchange gains or losses arise as the result of assets and liabilities translation in foreign currency recognized.
Exchange rates used as of December 31, 2009 and 2008 are as follows:
2009 2008
United States Dollar 1/Rupiah (full amount) 9,400 10,950 EURO 1/Rupiah (full amount) 13,510 15,432 CHF 1/Rupiah (full amount) 9,087 10,349 Japanese Yen 100/Rupiah (full amount) 10,170 12,123 Hongkong Dollar 1/Rupiah (full amount) 1,212 1,413 Singapore Dollar 1/Rupiah (full amount) 6,699 7,607 GBP 1/Rupiah (full amount) 15,114 15,803 Translation of the financial statements of foreign Subsidiary Companies
The financial statements of foreign Subsidiary companies are translated into Rupiah as follows: • Assets and liabilities are translated at prevailing rates of exchange at balance sheet dates.
• Items in the statements of income are translated with monthly weighted average of middle rates of exchange during the year.
• Equity is translated using the historical rates of exchange.
• Resulting exchange differences are recorded directly against shareholders’ interest, as “Exchange difference due to
GENERAL
(continued)
b. Subsidiary Companies
The consolidated Subsidiaries and the percentage of equity held as of balance sheet dates are as follows:
Total assets of subsidiaries as at December 31, 2009 and 2008 are as follows:
2009 2008 2009 2008 PT Asiatex Garmindo, ASA Partners Holdings Ltd and PT Eratex Garment currently do not have any activities.
01
SUMMARY OF SIGNIFICANT ACCOUNTING POLICIES
Accounting and reporting policies adopted by the Company and its Subsidiaries are conform to Generally Accepted Accounting Principles and Practices in Indonesia ("Indonesian GAAP”). The significant accounting principles applied consistently in the preparation of the consolidated financial statements for the years ended December 31, 2009 and 2008 are as follows:
a. Basis of Preparation of Consolidated Financial Statements
The consolidated financial statements have been prepared in accordance with Generally Accepted Accounting Principles and Practices in Indonesia, i.e., the Financial Accounting Standards, BAPEPAM regulations, and Guidelines on Financial Statements Presentation set out by BAPEPAM.
02
Subsidiaries Domicile Nature of business of ownershipPercentage
Year commencing
of operation
c. Convenience Translation of Financial Statements in Rupiah to United States Dollars Currency
SUMMARY OF SIGNIFICANT ACCOUNTING POLICIES
(continued)
d. Revenue Recognition
Revenue is recognized to the extent when it is probable that the economic benefits will flow to the Company and its Subsidiaries and the revenue can be reliably measured. The following specific recognition criteria must also be met before revenue is recognized:
•Sale of goods
Revenue is recognized when the significant risk and rewards of ownership of the goods have been passed to the buyer. •Rendering of services
Revenue is recognized by reference to the stage of completion of the transaction at balance sheet dates and there is no significant uncertainties remain considering any associated cost.
•Interest
Income is recognized as the interest accrues (taking into account the effective yield on the related asset), unless collectability is in doubt.
•Expenses are recognized when incurred (accrual basis).
e. Cash and Cash Equivalents
Cash on hand and in banks and short-term deposits held to maturity are carried at cost.
Cash and cash equivalents are defined as cash on hand and in banks, demand deposits and short-term and highly liquid investments readily convertible to known amounts of cash and subject to insignificant risk of changes in value.
For the purposes of the consolidated statements of cash flows, cash and cash equivalents consist of cash on hand and in banks, and short-term deposits with maturities of less than three months.
f. Trade Receivables
Trade receivables are recognized and carried at original invoice amount less allowance for doubtful accounts. A provision for doubtful accounts is made when collection of the full amount is no longer probable. Bad debts are written off as incurred.
g. Inventories
Inventories are stated at cost or net realizable value, whichever is lower.
Cost is based on the average method and comprises all costs of purchase, costs of conversion and other costs incurred in bringing the inventory to its present location and condition. Finished goods and goods in process are including fixed and variable factory overhead in addition to direct materials and labor.
Net realizable value is the estimated selling price in the ordinary course of business less estimated costs of completion and the estimated costs necessary to make the sale.
Inventory provision are determined by the calculation of inventory value by the end of the accounting period.
h. Lease
Effective January 1, 2008, the Statement of Financial Accounting Standard (PSAK) No. 30 (Revised 2007), "Leases" supersedes PSAK No. 30 (1990). Based on PSAK No. 30 (Revised 2007), the determination of whether an arrangement is, or contains a lease is based on the substance of the arrangement at inception date and whether the fulfillment of the arrangement is depend on the use of a specific asset and the arrangement conveys a right to use the asset. Under this revised PSAK, leases that transfer substantially to the lessee all the risks and rewards incidental to ownership of the leased item are classified as finance leases. Moreover, leases which do not transfer substantially all the risks and rewards incidental to ownership of the leased item are classified as operating leases.
02
h. Lease (continued)
Based on PSAK No. 30 (Revised 2007), under a finance lease, the Company recognize assets and liabilities in its consolidated balance sheets at amounts equal to the fair value of the leased property, if lower, the present value of the minimum lease payments, each determined at inception of the lease. Minimum lease payments are apportioned between the finance expenses and the reduction of outstanding liability. The finance expenses is allocated to each period during the lease term so as to produce a constant periodic rate of interest on the remaining balance of the liability. Contingent rent are changed as expenses in the periods in which they are incurred. Finance expenses are reflected in profit and loss. Capitalized leased assets (presented under the account of property, plant and equipment) are depreciated over the shorter of the estimated useful life of the assets and the lease term, if there is no reasonable certainty that the Company will obtain ownership by the end of the lease term. Under an operating lease, the Company recognized lease payments as an expense on a straight-line method over the lease term.
i. Investments
Short-term deposits with maturities of less than three months but held for collateral or have a restriction and short-term deposits with maturities of more than three months are presented as short-term investments and carried at nominal value. Investments in securities are classified as follows:
(i) Held for trading
Investments, which are classified as “held for trading” are measured at fair value, with unrealized gain or losses as a
result of an increase or decrease of the fair value are reported in the current period profit and loss statement. The difference between sales proceed and the carrying amount are recognized as realized gains or losses.
(ii) Available for sale
Investments which are classified as “available for sale” are measured at fair value. The unrealized gains or losses as a result of an increase or decrease of the fair value are reported as a separate component of equity. The differences between sales proceed and the carrying amount are recognized as gains or losses when the investment is sold, collected or otherwise disposed of. Unrealized gains and losses from this investment at which time the cumulative gain or loss previously reported in equity are recognized as income or expenses when realized.
(iii) Held to maturity
Investments which are intended to be held to maturity, such as bonds, are measured at the acquisition cost after un-amortized premium purchase or discount. Discount and premium is un-amortized using the straight-line method. When there is a permanent decline of fair value below the carrying value, the impairment in value is reported in the current period profit and loss statement.
Investment in shares in other companies with the percentage of ownership as follows: • Less than 20% is stated at the lower of cost or net realizable value.
• From 20% to 50% is stated at cost and will be increased or decreased by the portion of income (loss) resulting from associated companies and the dividend received is deducted from the investment amount (equity method).
• More than 50% is consolidated
j. Fixed Assets
As of January 1, 2009, the Company has been implemented PSAK No. 16 "Fixed Assets" (Revised 2007) as determined by the Indonesian Institute of Accountants. The Company has decided to use cost method concerned to the fixed assets accounting policy.
Based on PSAK No.16 (Revised 2007), an entity must choose between cost model or revaluation model as their fixed assets accounting policy. The Company decided to choose the cost model as their fixed assets accounting policy. The Company had previously revalued its fixed assets before the application of PSAK No.16 (Revised 2007) and has chosen the cost model, thus, the revalued amount of fixed assets is considered as deemed cost and the cost is the value at the time PSAK No.16 (Revised 2007) is applied. All the balance of revaluation increment in fixed assets that still exists at the first time application of PSAK No.16 (Revised 2007) as presented in equity section of the consolidated balance sheet have been reclassified to Retained Earnings in 2008 (Note 11).
j. Fixed Assets (continued)
Depreciation is computed using the straight-line method based on their estimated useful lives of the assets except land as follows:
Buildings and structures 25 years Machinery and equipment 15 years Vehicles 10 years Furniture and fixtures 10 years
The cost of repair and maintenance is charged to income as incurred; significant renewals or betterments are capitalized. When assets are retired or otherwise disposed of, their carrying values and the related accumulated depreciation are removed from the accounts and any resulting gain or loss is reflected in earnings.
Fixed assets which are not in used, will be classified as asset held for sale.
Construction in progress represents the accumulated costs of materials and other costs related to the construction of fixed asset. The accumulated costs will be reclassified to the appropriate fixed asset account when the construction is completed and the asset is ready for its intended use.
k. Impairment of Assets
At each balance sheet date, the Company and subsidiaries review whether there is any indication of asset impairment or not. Fixed assets and other assets, including intangible assets are reviewed for impairment whenever events or changes in circumstances indicate that the carrying amount may not be recoverable. An impairment loss is recognized for the amount by which the carrying amount of the assets exceeds its recoverable amount, which is the higher of an asset's net selling price and value in use. For the purpose of assessing impairment, assets are grouped at the lowest levels for which there are separately identifiable cash flows.
l. Intangible Assets
The expense incurred in relation to the extension of rights are capitalized and amortized over the lifetime of the land-rights which is 20 years.
The expense incurred in relation to the acquisition of software are capitalized and amortized over 10 years.
As of each balance sheet date, the Company and its Subsidiaries assess whether there is any indication of impairment. If any such indication exists, the recoverable amount is estimated.
m. Related Parties
In the ordinary course of business, the Company has transactions with entities which are regarded as having special relationship as defined under PSAK No. 7, “Related Party Disclosures”.
All significant transactions and balances with related parties are disclosed in the notes to the consolidated financial statements.
02
02
SUMMARY OF SIGNIFICANT ACCOUNTING POLICIES
(continued)
n. Income Tax
Under PSAK No.46, current tax expenses will be determined based on profit subject to tax for the current period and calculated using the currently applying tax rates.
Deferred tax assets and liabilities are recognized for temporary differences between the financial and the tax bases of assets and liabilities at each reporting date. Future tax benefits, such as the carry-forward of unused tax losses, are also recognized to the extent that realization of such benefits is probable.
Deferred tax assets and liabilities are measured at the tax rates that are expected to apply to the period when the asset is realized or the liability is settled, based on tax rates (and tax laws) that have been enacted or substantively enacted at the balance sheet date.
Amendments to tax obligations are recorded when an assessments is received or, if appealed against by the Company, when the result of the appeal is determined.
Indonesian tax regulations do not apply a concept of consolidated tax returns. Therefore, the tax balances in the consolidated financial statements represent the combination of the Company’s and its Subsidiaries tax position.
o. Provision for Employee Service Entitlements
The Company recognizes an unfunded employee benefit liability in accordance with Labor Law No. 13/2003 dated March 25, 2003 (“the Law”). Before January 1, 2005, the Company recognized employee benefits obligations based on the actuary assessment under PSAK No.24 "Cost Benefit Pension Accounting" published in 1994.
Under PSAK No. 24 (Revised 2004), "Employee Benefit", the cost of providing employee benefit under the Law is determined using the projected unit credit actuarial valuation method based on projected unit credit. Actuarial gains and losses are recognized as income or expense when the net cumulative unrecognized actuarial gains and losses for each individual plan at the end of the previous reporting year exceeded 10% of the defined benefit obligation and 10% of the fair value of plan assets. These gains or losses are recognized on a straight-line method of the expected average remaining working lives of the employees. Further, past-service costs arising from the introduction of a defined benefit plan or changes in the benefit payable of an existing plan are required to be amortized over the period until the benefits concerned become vested.
p. Discontinuing Operation
The discontinuing of operation for an unknown period of time and unknown management plan for the future to continue its operation in textile industry since its inability to compete in international or local market, the increase of transportation costs, increase of world oil prices and raw material (cotton), where the Company's division activities can be separated operationally and the purpose of financial statement reporting in the Company and its Subsidiaries as a whole, have to be calculated in accordance with PSAK No.58 (Revised 2003) on "Discontinued Operation". PSAK No.58 (Revised 2003) obligate the financial statements prepared in the period where required the financial statements prepared in the period in which there are plans to discontinue actions (preliminary disclosure) must be included in the information related to discontinued operation.
In order to disclose asset valuation, liabilities, income, expenses, gains, losses and cash flows of discontinued operation in accordance with PSAK revealed that those elements of financial statement can be directly attributed to the discontinued operation, if those elements will be sold, left out, expended or eliminated by the time the discontinuing process of operation has finished. In reverse, foresaid elements considered being used continually after the discontinuing process cannot be included in the discontinued operation classification. Comparative information on the prior year should be presented to distinguish between continued and discontinued operation.
02
q. Use of Estimates
The preparation of consolidated financial statements in conformity with Generally Accepted Accounting Principles requires management to make estimates and assumption that effect amounts reported therein. Due to inherent uncertainty in making estimates, actual results reported in future periods may be based on amounts that differ from those estimates.
r. Basic Earnings Per Share
In accordance with PSAK No. 56, "Earning Per Share", net income (loss) from normal operations per share and net income (loss) per share are computed by dividing the respective income (loss) with the weighted average number of shares
outstanding during the year. Earnings per share calculations are based on 98,236,000 shares for the years ended December 31, 2009 and 2008.
s. Segment Information
In accordance with PSAK No. 5 (Revised 2000),"Segment Reporting", business segments provide information of products or services that are subjected to risks and returns that are different from those of other business segments. Geographical segments provide information of products or services within a particular economic environment that are subject to risks and returns that are different from those of components operating in other economic environments.
Revenue, expense, assets and liabilities segments are determined before intra-group balances and transactions within the group are eliminated as part of the consolidation process.
02
SUMMARY OF SIGNIFICANT ACCOUNTING POLICIES
(continued)
DISCONTINUING OPERATION
Based on "Circular Resolutions in Lieu of Board of Commissioners Meeting" of PT Eratex Djaja Tbk on July 14, 2008, the Company's President Director gained authority to discontinue the operation of textile division and announce that discontinuing. The textile division operation has been stopped for unlimited period of time, in terms of decreasing economic stability, prospect of the current business and the loss occurred in effect of the whole company's performance.
The operation of textile division was officially discontinued in August 2008.
The main classifications of assets and liabilities of the discontinued operations are listed below:
03
ASSETS
Cash and cash equivalents (Note 4) 322,874 4,231,128 34 386 Trade receivables - third parties, net (Note 5) 8,155 1,059,006 1 97 Other receivables - third parties, net (Note 6) 106,331 1,924,410 11 176 Inventories, net (Note 7) 203,871 3,063,679 22 280 Advance payments (Note 8) - 1,084,239 - 99 Prepaid expenses (Note 9) 43,940 150,492 5 14 Deferred tax assets (Note 22d) 322,822 824,802 34 75 Fixed assets, net (Note 11) 7,024,395 26,307,766 747 2,403 Intangible assets, net (Note 12) 46,511 49,899 5 5 Guarantee deposits 250,000 1,417,806 27 129
Total 8,328,899 40,113,227 886 3,663
LIABILITIES
Trade payables - third parties (Note 14) 194,220 3,566,598 21 326 Other payables - third parties (Note 15) 13,636 84,981 1 8 Advance received (Note 16) - 6,218,651 - 568 Accrued expenses (Note 17) - 1,307,158 - 119
Total 207,856 11,177,388 22 1,021
REVENUE
Revenue (Note 27) 1,094,315 105,697,715 116 9,653 Cost of revenue (Note 28) (634,666) (128,947,538) (68) (11,776) Operating expenses (Notes 31, 32) (588,912) (7,465,843) (63) (682)
Operating loss (129,263) (30,715,666) (14) (2,805)
OTHER INCOME (EXPENSES)
Interest income 5,340 24,656 1 2 Interest expense (126,405) (2,781,346) (13) (254) Foreign exchange gain (loss), net 2,453,459 (5,800,870) 261 (530) Loss on disposal of fixed assets (3,128,159) (706,979) (333) (65) Provision for declining in inventories value 2,877,841 (3,017,441) 306 (276) Provision for uncollectible receivables - (341,870) - (31) Others, net (2,533,226) 1,392,694 (269) 127
Total other expenses, net (451,150) (11,231,156) (48) (1,026)
Loss before corporate income tax (580,413) (41,946,823) (62) (3,831)
Income tax benefit (expense) (501,980) 2,508,533 (53) 229
2009 2008 2009 2008
(Rp) (Rp) (US$) (US$)
CASH AND CASH EQUIVALENTS
Total cash in banks 1,666,822 1,547,010 177 141
Call deposits:
Interest rates for call deposits in US$ is in the range of 0.004% per annum in 2009 and 0.005% - 0.076% per annum in 2008.
2008 2007
(Rp) (Rp) (US$) (US$)
2008 2007
05
TRADE RECEIVABLES - THIRD PARTIES
This account consists of:
CONTINUING OPERATION
Export sales 2,241,743 14,966,694 238 1,367 Local sales 1,033,528 341,663 110 31
Total trade receivables - third parties 3,275,271 15,308,357 348 1,398
Less: Allowance for doubtful accounts - (217,266) - (20)
Total trade receivables - third parties, net 3,275,271 15,091,091 348 1,378
DISCONTINUING OPERATION
Local sales 615,107 1,665,958 65 152
Total trade receivables - third parties 615,107 1,665,958 65 152
Less: Allowance for doubtful accounts (606,952) (606,952) (65) (55)
Total trade receivables - third parties, net (Note 3) 8,155 1,059,006 1 97
2009 2008 2009 2008
(Rp) (Rp) (US$) (US$)
Details of trade receivables from third parties are as follows:
CONTINUING OPERATION
Aging analysis of trade receivables from third parties since issuance of invoices are as follows:
05
Details of trade receivables from third parties based on currency are as follows:
These receivables are pledged as collateral for the bank loan facility (Note 21).
Management believes that the provision for doubtful accounts on trade receivables is adequate to cover possible losses on uncollectible accounts.
TRADE RECEIVABLES - THIRD PARTIES
(continued)
DISCONTINUING OPERATION
1 - less than 3 months - 1,059,006 - 97 3 - less than 6 months 8,155 - 1 - More than 12 months 606,952 606,952 65 55
Total (Note 3) 615,107 1,665,958 65 152
2009 2008 2009 2008
(Rp) (Rp) (US$) (US$)
CONTINUING OPERATION
Rupiah 1,033,528 341,663 110 31 Foreign currencies 2,241,743 14,966,694 238 1,367
Total 3,275,271 15,308,357 348 1,398
DISCONTINUING OPERATION
Rupiah 615,107 1,665,958 65 152
Total (Note 3) 615,107 1,665,958 65 152
2009 2008 2009 2008
(Rp) (Rp) (US$) (US$)
Movement in allowances for doubtful accounts is as follows:
CONTINUING OPERATION
Balance at beginning of the year 217,266 1,137,314 23 104 Add: Provision during the year - - - - Less: Receivables payment (217,266) (920,048)
Balance at end of the year - 217,266 23 104
DISCONTINUING OPERATION
Balance at beginning of the year 606,952 265,082 65 24 Add: Provision during the year - 606,952 - 55 Less: Receivables payment - (265,082)
Balance at end of the year (Note 3) 606,952 606,952 65 80
2009 2008 2009 2008
(Rp) (Rp) (US$) (US$)
OTHER RECEIVABLES - THIRD PARTIES
INVENTORIES
This account consist of:
06
This account consists of:
07
CONTINUING OPERATION
Temporary advances 459,386 2,467,481 48 225 Others 608,110 2,008,601 65 184
Total other receivables - third parties 1,067,495 4,476,082 113 409
Less allowance for doubtful accounts
Balance at beginning of the year 338,524 338,524 36 31 Add: Provision during the year 320,505 - 34 - Less: Receivables payment (338,524) - (36) -
Balance at end of year 320,505 338,524 34 31
Total other receivables - third parties, net 746,990 4,137,558 79 378
DISCONTINUING OPERATION
Others 106,331 1,924,410 11 176
Total other receivables - third parties (Note 3) 106,331 1,924,410 11 176
Management believes that the provision for doubtful accounts on other receivables is adequate to cover possible losses on uncollectible accounts.
2009 2008 2009 2008
(Rp) (Rp) (US$) (US$)
CONTINUING OPERATION
Finished goods 17,335,436 23,372,128 1,844 2,134 Goods in process 4,561,261 9,311,800 485 850 Raw materials 11,523,723 15,255,298 1,226 1,393 Sundry stores 5,421,438 7,518,567 577 686
Total inventories 38,841,858 55,457,793 4,132 5,064
Less: Provision for declining in value (203,356) (2,324,324) (22) (212)
Total inventories, net 38,638,502 53,133,469 4,110 4,852
DISCONTINUING OPERATION
Finished goods - 634,807 - 58 Sundry stores 343,471 5,446,313 37 497
Total inventories 343,471 6,081,120 37 555
Less: Provision for declining in value (139,600) (3,017,441) (15) (276)
Total inventories, net (Note 3) 203,871 3,063,679 22 28
2009 2008 2009 2008
INVENTORIES
(continued)
Movements in provision for declining in value of inventories are as follows:
Details of provision for the declining in value of inventories as of balance sheet dates are as follows:
07
CONTINUING OPERATION
Balance at beginning of the year 2,324,324 5,338,868 247 488 Add: Provision during the year 203,356 2,324,323 22 212 Less: Utilization of provision during the year (2,324,324) (5,338,867) (247) (488)
Balance at end of the year 203,356 2,324,324 22 212
DISCONTINUING OPERATION
Balance at beginning of the year 3,017,441 1,316,673 321 120 Add: Provision during the year - 3,017,441 - 276 Less: Utilization of provision during the year (2,877,841) (1,316,673) (306) (120)
Balance at end of the year (Note 3) 139,600 3,017,441 15 276
2009 2008 2009 2008
(Rp) (Rp) (US$) (US$)
CONTINUING OPERATION
Finished goods 203,356 2,324,324 22 212
Total provision for declining in value 203,356 2,324,324 22 212
DISCONTINUING OPERATION
Finished goods - 317,403 - 29 Sundry stores 139,600 2,700,038 15 247
Total provision for declining in value (Note 3) 139,600 3,017,441 15 276
Inventories as of December 31, 2009 have been insured for fire and other risks for a total coverage of Rp 103 Billion (full Rupiah amount) for 2009 and Rp 241 Billion (full Rupiah amount) for 2008.
Management believes that this insurance is adequate to cover the possibility of losses. These inventories are pledged as collateral for the bank loan facility (Note 21).
Management believes that the provision for declining in value is adequate to cover the possible losses due to decrease in value of inventory.
2009 2008 2009 2008
(Rp) (Rp) (US$) (US$)
08
ADVANCE PAYMENTS
This account consists of:
PREPAID EXPENSES
LONG-TERM INVESTMENTS
This account consist of:
The balances of long-term investments as of December 31, 2009 and 2008 are as follows:
09
10
CONTINUING OPERATION
Raw materials 1,533,208 305,586 163 28 Others 771,649 1,399,136 82 128
Total advance payments 2,304,857 1,704,722 245 156
DISCONTINUING OPERATION
Others - 1,084,239 - 99
Total advance payments (Note 3) - 1,084,239 - 99
Others consist of advance payments for the purchase of accessories and spare parts.
2009 2008 2009 2008
(Rp) (Rp) (US$) (US$)
CONTINUING OPERATION
Insurance 46,762 150,054 5 14 Others 764,638 1,129,716 81 103
Total prepaid expenses 811,400 1,279,770 86 117
DISCONTINUING OPERATION
Others 43,940 - 5 -
Total prepaid expenses (Note 3) 43,940 - 5 -
2009 2008 2009 2008
(Rp) (Rp) (US$) (US$)
Investment in associates (at cost):
PT Pasifik Marketama (less than 20%) 277,500 277,500 30 25 Less: Provision for declining in value of investment (277,500) (277,500) (30) (25)
Total long-term investments - - -
-The Company has also invested shares in PT Pasifik Marketama, which is engaged in the marketing of garment products.
2009 2008 2009 2008
FIXED ASSETS
Machineries and equipment 37,124,965 466,729 4,404,393 4,969,843 38,157,144 Vehicles 2,947,289 463,940 312,050 (270,110) 2,829,069 Furniture and fixtures 9,154,210 427,322 - (1,677,174) 7,904,358 Finance lease asset:Machineries 4,969,843 - - (4,969,843) -
Sub-total 71,375,037 1,357,991 12,232,637 (1,947,284) 58,553,107
Construction in progress 268,876 - - (268,876) -
Total acquisition cost 71,643,913 1,357,991 12,232,637 (2,216,160) 58,553,107
ACCUMULATED DEPRECIATION:
Direct ownership:
Land leasehold 111,642 - - - 111,642 Buildings and structures 5,588,519 374,939 2,240,463 - 3,722,995 Machineries and equipment 15,170,211 1,223,519 4,404,393 1,049,355 13,038,692 Vehicles 2,159,095 194,927 312,050 (243,507) 1,798,465 Furniture and fixtures 6,188,936 576,296 - (1,213,923) 5,551,309 Finance lease asset:
Machineries 717,866 331,489 - (1,049,355) -
Total accumulated depreciation 29,936,269 2,701,170 6,956,906 (1,457,430) 24,223,103
NET BOOK VALUE 41,707,644 34,330,004
EQUIVALENT (US$) 3,809 3,652
TOTAL ACQUISITION COST 74,098,131 - 54,314,935 1,001,729 20,784,925
ACCUMULATED DEPRECIATION:
Total accumulated depreciation 47,790,365 - 34,029,641 (194) 13,760,530
Balance Reclassification/ Balance Jan 1, 2009 Additions Disposals correction Dec 31, 2009
Balance Reclassification/ Balance Jan 1, 2009 Additions Disposals correction Dec 31, 2009
Total accumulated depreciation 27,671,274 3,894,077 1,629,081 - 29,936,269
NET BOOK VALUE 46,090,859 41,707,644
EQUIVALENT (US$) 4,893 3,809 Machineries and equipment 115,703,512 1,393,355 56,418,606 - 60,678,261 Vehicles 1,722,788 - 52,550 - 1,670,238 Machineries and equipment 70,570,722 3,730,504 34,345,139 - 39,956,087 Vehicles 1,511,557 71,288 52,550 - 1,530,295 Furniture and fixture 1,093,855 6,853 - - 1,100,708
Total accumulated depreciation 78,068,325 4,119,729 34,397,689 - 47,790,365
Balance Reclassification/ Balance Jan 1, 2008 Additions Disposals correction Dec 31, 2008
Balance Reclassification/ Balance Jan 1, 2008 Additions Disposals correction Dec 31, 2008