ISSN: 2088-8694 31
Multi-objective Optimization Scheme for PID-Controlled DC
Motor
Gunawan Dewantoro
Departement of Electronics and Computer Engineering, Satya Wacana Christian University
Article Info ABSTRACT
Article history:
Received Jun 12th, 2016 Revised Aug 20th, 2016 Accepted Aug 26th, 2016
DC Motor is the most basic electro-mechanical equipment and well-known for its merit and simplicity. The performance of DC motor is assessed based on several qualities that are most-likely contradictory each other, i.e. settling time and overshoot percentage. Most of controllers optimization problems are multi-objective in nature since they normally have several conflicting objectives that must be met simultaneously. In this study, the grey relational analysis (GRA) was combined with Taguchi method to search the optimum PID parameter for multi-objective problem. First, a L9 (33) orthogonal array
was used to plan out the processing parameters that would affect the DC motor’s speed. Then GRA was applied to overcome the drawback of single quality characteristics in the Taguchi method, and then the optimized PID parameter combination was obtained for multiple quality characteristics from the response table and the response graph from GRA. Signal-to-noise ratio (S/N ratio) calculation and analysis of variance (ANOVA) would be performed to find out the significant factors. Lastly, the reliability and reproducibility of the experiment was verified by confirming a confidence interval (CI) of 95%.
Keyword:
DC Motor Taguchi Method Grey Relational Analysis Multi-objective Optimization PID Controller
Copyright © 2016 Institute of Advanced Engineering and Science. All rights reserved.
Corresponding Author:
Gunawan Dewantoro
Departement of Electronics and Computer Engineering, Satya Wacana Christian University,
Jl. Diponegoro 52-60, Salatiga, Central Java 50711, Indonesia. Email: [email protected]
1. INTRODUCTION
PID speed controller for separately excited DC motor has been examined on the basis of output response, i.e. minimum settling time, and minimum overshoot for speed demand application of DC motor [1]-[3]. Since the characteristic responses are often contradictory each other, then PID tuning is of multi-objective optimization problem. Some methods have been applied to perform PID multi-multi-objective problem, such as: Genetic Algorithm [4]-[6], Ant Colony Optimization [7], etc. Taguchi method is an effective way to optimize multi-parameter combination because it significantly reduces the number of experiments. However, Taguchi method is appropriate for single-objective optimization problems. Thus, some modifications have been done to overcome such problems [8]-[9].
the overshoot percentage are KP and KI. Finally, the reliability and reproducibility of the experiment was
verified by confirming a confidence interval (CI) of 95%.
2. DC MOTOR MODELING
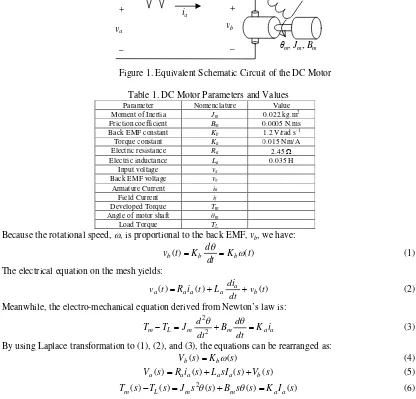
The plant to be controlled in this study is the separately-excited DC motor [10]. The motor velocity relies on voltage across the armature while the field current is set constant. The modeling DC servo motor is carried to mimic the actual DC motor. The equivalent schematic circuit of the DC motor is shown in Figure 1. Table 1 gives the parameter and values for motor simulation used in this study [11].
Figure 1. Equivalent Schematic Circuit of the DC Motor
Table 1. DC Motor Parameters and Values
Parameter Nomenclature Value
Moment of Inertia Jm 0.022 kg.m2
Friction coefficient Bm 0.0005 N.ms
Back EMF constant Kb 1.2 V/rad s-1
Torque constant Ka 0.015 Nm/A
Electric resistance Ra 2.45
Electric inductance La 0.035 H
Input voltage va
Back EMF voltage vb
Armature Current ia
Field Current if
Developed Torque Tm
Angle of motor shaft θm
The electrical equation on the mesh yields:
)
Meanwhile, the electro-mechanical equation derived from Newton’s law is:
a
Figure 2. Block Diagram of the DC Motor in s-domain
3. RESEARCH METHODS
3.1. The Taguchi Method
The Taguchi method is an effective technique in single-objective optimization problem [12]. The characteristic of the Taguchi method is to utilize an orthogonal array to plan out the experiment and to use the signal-to-noise ratio (SN ratio) to analyze the data obtained from the experiment. The orthogonal array is used to reduce the number of design experiments required in any design process. In this study, there are three factors each at three levels, so the Taguchi method needs only nine experiments (L9) while the full factorial design method needs 33 = 27 experiments.
Since the settling time and overshoot percentage have a direct effect on the performance with respect of DC motor’s speed, therefore this study primarily looks into the relationship between the PID parameters and quality characteristics, using the Taguchi method and GRA to find the optimum PID parameter combination for DC motor’s speed, with the goal of making the settling time and overshoot percentage as close to the ideal as possible. First, the quality characteristics are set for the DC motor’s speed, and then the control factors and their levels are planned out. After choosing a suitable orthogonal array, the experiments according to the orthogonal array are conducted. Next, ANOVA is performed, at the same time performing relational analysis on double quality characteristics using GRA, and then the optimum PID parameter combination can be obtained through main effect analysis. Finally, a verification experiment is carried out, and the reliability and reproducibility of the experiment are verified with a 95% CI.
3.1.1 Orthogonal Array
In establishing an orthogonal array, three factors A, B, and C are considered. A is the proportional gain, B is the integral gain, and C is the derivative gain. To determine the factor levels, an initial guess must be established from the traditional Nichols method using Matlab's SISO design tool. The Ziegler-Nichols method gives the values of Kp, Ki, and Kd of 1.5865, 1.0018, and 0.62811, respectively. Then, the
three levels of three control factors were identified as presented in Table 2.
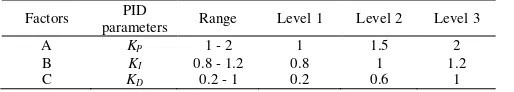
Table 2. PID Parameters with Their Ranges and Values at Three Levels
Factors PID
parameters Range Level 1 Level 2 Level 3
A KP 1 - 2 1 1.5 2
B KI 0.8 - 1.2 0.8 1 1.2
C KD 0.2 - 1 0.2 0.6 1
3.1.2. Signal-to-Noise Ratio
Taguchi experiment design employs quality loss as a base to plan a statistical measurement for the evaluation of performance, called the SN ratio. In this study, the performance indexes of PID optimization are the settling time and overshoot percentage. The aim of the optimization is to make the performance indexes as close as to their target values. So, the quality characteristics are chosen to be the smaller-the-better, and the SN ratio is:
MSD
SN10log (7)
and the mean squared deviation is:
a
as R
L
1
a K
B Js
1
b
K
+ _ + +
Va(s)
Vb(s)
3.1.3. Main Effect Analysis
After proceeding with the experiment plan according to the L9 orthogonal array, the data produced by various processing parameter combinations can be obtained to obtain the response table and the response graph. The data obtained from the experiments are used to calculate the main effect values F as follows:
into a response table, and the effect of each factor is analyzed. If the main effect value of a factor ΔF is large, then that given factor’s effect on the system is much greater than that of the other factors.
3.2. Grey Relational Analysis [13]
An appropriate mathematical model must be established to describe the relationship between the two objectives and their target values. The first step is to analyze the difference in each objectives caused by each processing parameter, and find their relationships with their target values. The GRA method used in this study is based on the Grey Theory to find the relationship between actual values and their target values throughout all trials in the orthogonal array. The GRA of the settling time and overshoot percentage is defined as follows:
The target value of settling time and overshoot percentage:
Reference sequence X0=(x0(1), x0(2))
The settling times and overshoot percentages obtained from the various experiments in the orthogonal array:
Xi =(xi(1),xi(2)), i=1,2,...,9
The relation between the target value and the observed experiment value is the correlation coefficient
4. RESULTS AND ANALYSIS
4.1. PID Optimization
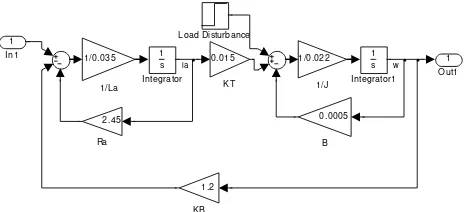
Figure 3. DC Motor schematic in MATLAB-Simulink
Table 3. Simulation Results
Trial Kp Ki Kd Settling
S/N ratios were computed in each of the trial combination and the values were displayed in the last two columns of Table 3. Since the experimental design is orthogonal, the effect of each factor is separable. Therefore the average S/N Ratio of each level (1, 2, 3) of three control factors (KP, KI and KD) can be
obtained using Equation 7.
The ANOVA table was calculated out of the SN ratios in Table 3, as shown in Table 4 and 5. From the ANOVA table that with regard to the settling time, control factors B have a smaller effect and are therefore categorized as pooled errors; on the other hand, control factors A and C have a profound F-ratio, meaning that the effects of these factors are all significant. Whereas, the significant factors for the overshoot percentage is factors A and B.
Table 4. ANOVA Analysis for Settling Time
Source SS d.f MS F-ratio SS' %P
A 41.9801 2 20.99005 8.336039 36.94413 53.11675
B* 2.993788 2 1.496894
C 17.50063 2 8.750313 3.47512 12.46465 17.92116
error 7.078167 2 3.539084
pooled error 10.07196 4 2.517989 28.96209
total 69.55269 8 100
*=pooled terms
Table 5. ANOVA Analysis for Overshoot Percentage
Source SS d.f MS F-ratio SS' %P
A 151.7815 2 75.89074 22.68487 145.0906 60.37541
B 75.15085 2 37.57543 11.23185 68.45998 28.48771
C* 7.922014 2 3.961007
error 5.459721 2 2.729861
pooled error 13.38173 4 3.345434 11.13687
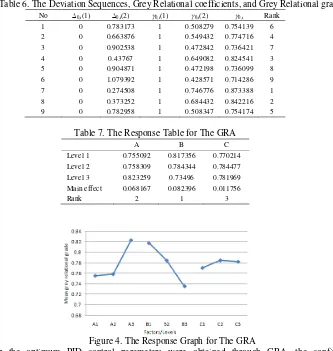
Then, GRA was utilized to carry out optimum PID parameter combination analysis. The target values for settling time and overshoot percentage were X0 = (2, 0). The deviation sequence for the reference
sequence and the sequences in the orthogonal array, the grey relational coefficients, and grey relational grade calculation results are shown in Table 6. Next, the GRA response table and response graph could be obtained using main effect analysis, as shown in Table 7 and Figure 4. From the response table and response graph, the optimum PID combination for DC motor’s speed was determined, which is A3, B1, C2. In other words, the KP of 2, KI of 0.8, and KD of 0.6. This PID combination was obtained beyond the search space within the
L9 orthogonal array. After the optimum PID parameter combination was obtained through GRA, the verification experiments were conducted. First, the theoretical predicted values could be figured out through the significant factors in the ANOVA table.
Table 6. The Deviation Sequences, Grey Relational coefficients, and Grey Relational grades No 0,i(1) 0,i(2) 0,i(1) 0,i(2) 0,i Rank
1 0 0.783173 1 0.508279 0.754139 6
2 0 0.663876 1 0.549432 0.774716 4
3 0 0.902538 1 0.472842 0.736421 7
4 0 0.43767 1 0.649082 0.824541 3
5 0 0.904871 1 0.472198 0.736099 8
6 0 1.079392 1 0.428571 0.714286 9
7 0 0.274508 1 0.746776 0.873388 1
8 0 0.373252 1 0.684432 0.842216 2
9 0 0.782958 1 0.508347 0.754174 5
Table 7. The Response Table for The GRA
A B C
Level 1 0.755092 0.817356 0.770214 Level 2 0.758309 0.784344 0.784477
Level 3 0.823259 0.73496 0.781969
Main effect 0.068167 0.082396 0.011756
Rank 2 1 3
Figure 4. The Response Graph for The GRA
After the optimum PID control parameters were obtained through GRA, the confirmation simulations were conducted. First, the theoretical predicted values could be figured out through the significant factors in the ANOVA table using the following formula:
ni
i
T
F
T
SN
1 ^
(13)
where T is the average of all the SN ratios and Fi is the SN ratio of significant factor level values. In order to
effectively evaluate the various observed values, their Confidence Interval (CI) must be calculated. Its calculation is shown below:
eff v
n
MSE
F
CI
1
2
, 1 ,
1
(14)Whilst, The CI of the calculated experiment value is:
effective observed value, and r is the number of verification experiments.
According to (13), the predicted value for the settling time and overshoot percentage were is -20.6449 dB and -8.843 dB, respectively; whereas according to (14), the expected average value of 95% CI of the settling time and overshoot percentage were 3.2838 and 3.7851 dB, respectively.
Then, the settling time and overshoot percentage under optimum PID parameter (KP=2, KI=0.8, KD=0.6) were
calculated. The simulation showed that the calculated settling time and percentage overshoot were -14.322 and -5.4266 dB, respectively; whereas according to (15), the expected average value of 95% CI of the settling time and overshoot percentage were 5.4948 and 6.3371 dB, respectively. The diagram for the CI of the settling time and overshoot percentage verification experiment values and theoretical predicted values are shown in Figure 5. From the diagrams, the CI from the verification experiment and the theoretical predictions did indeed coincide; therefore the results from our experiment are indeed reliable had been proven.
Figure 5. Diagram for the CI of the verification experimental value and theoretical predicted value for (a) settling time and (b) overshoot percentage
4.2. Time Response Performance
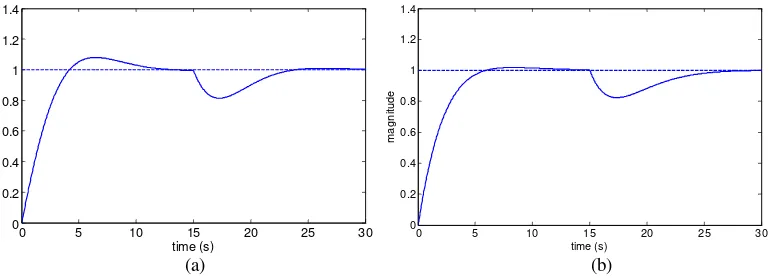
Figure 6(a) and (b) demonstrates the disturbed step responses of the DC motor speed with PID parameter obtained from the traditional Ziegler-Nichols method, and Taguchi-GRA, respectively. The load disturbance is 0.005 Nm at t=15 s.
(a) (b)
Figure 6. Unit step responses with disturbance using (a) Ziegler-Nichols and (b) Taguchi-GRA method
It is shown that the PID parameter optimization using Taguchi-GRA method improves the time response characteristic and system robustness against disturbance compared to that using Ziegler-Nichols conventional
5. CONCLUSION
A Taguchi method combined with the GRA was successfully employed to seek the optimum PID parameters beyond the search space in the orthogonal array. The proportional gain, the integral gain, and the derivative gain were chosen to define the search space for the multi-objective optimization problem, while the objective is to minimize the settling time and overshoot percentage of DC motor’s speed. From the response table and response graph, the optimum PID parameter combination was concluded as: KP of 2, KI of
0.8, and KD of 0.6. From the ANOVA analysis, the factor that more significantly affected the settling time are
KP and KD, meanwhile the factor that more significantly affected the overshoot percentage are KP and KI .
After carrying out verifying simulations, the 95% CI diagrams for the verification values coincides with that of the theoretical predicted values. It means that the results of this method possess reproducibility. The unit response using this method demonstrated the superiority over the traditional Ziegler-Nichols PID tuning, in terms of both the transient response and robustness.
REFERENCES
[1] P. M. Meshram and R. G. Kanojiya, “Tuning of PID Controller using Ziegler-Nichols Method for Speed Control of
DC Motor,” International Conference on Advances in Engineering, Science and Management, 2012, pp. 117-122.
[2] H. B. Shin and J. G. Park, “Anti-Windup PID Controller With Integral State Predictor for Variable-Speed Motor
Drives,” IEEE Transactions on Industrial Electronics, vol. 59 (3), pp. 1509-1516, Aug 2011.
[3] G. Dewantoro, “Robust Fine-Tuned PID Controller using Taguchi Method for Regulating DC Motor Speed,”
International Conference on Information Technology and Electrical Engineering, 2015, pp. 173-178.
[4] P. Kumar, et al., “Design of PID Controllers using Multiobjective Optimization with GA and Weighted Sum Objective Function Method,” International Journal of Technical Research, vol. 2 (2), pp. 52–56, Jul 2013. [5] I. Chiha, et al., “Tuning PID Controller using Multiobjective Ant Colony Optimization,” Applied Computational
Intelligence and Soft Computing, vol. 2012, pp. 1-7, Jan 2012.
[6] D. Singh, et al, “Performance Indices Based Optimal Tuning Criterion for Speed Control of DC Drives Using GA,”
International Journal of Power Electronics and Drive System, vol. 4 (4), pp. 461-473, Dec 2014.
[7] H. M. Hasanien, “Design Optimization of PID Controller in Automatic Voltage Regulator System Using Taguchi
Combined Genetic Algorithm Method,” IEEE Systems Journal, vol. 7 (4), pp. 825-831, Dec 2013.
[8] C. F. J. Kuo, et al, “Optimization of Injection-Molded Light Guide Plate with Microstructures by Using Reciprocal Comparisons,” Journal of Intelligent Manufacturing, vol. 26 (4), pp. 677-690, Aug 2015.
[9] M. Sarshenas and Z. H. Firouzeh, “A Robust Hybrid Taguchi-Gradient Optimization Method for the Calculation of
Analytical Green’s Functions of Microstrip Structures,” IEEE Antennas and Wireless Propagation Letters, vol. 14, pp. 1366-1368, 2015.
[10] G. Haung and S. Lee, “PC based PID Speed Control of DC motor,” International Conference on Audio, Language
and Image Processing, 2008, pp. 400-407.
[11] N. Thomas and P. Poongodi, “Position Control of DC Motor using Genetic Algorithm Based PID controller,” The
World Congress on Engineering, vol. 11, 2009.
[12] R. K. Roy, Design of Experiments Using the Taguchi Approach. New York: Wiley-Interscience, 2001.
[13] C. F. J. Kuo, and T. L. Su, “Optimization of Injection Molding Processing Parameters for LCD Light-Guide Plates,” Journal of Materials Engineering and Performance, vol. 16 (5), pp. 539-548, Oct 2007.
BIBLIOGRAPHY OF AUTHOR