PLEASE SEE ANALYST CERTIFICATIONS AND IMPORTANT DISCLOSURES & DISCLAIMERS BEGINNING ON PAGE 5.
MNC Investama
(BHIT IJ)
The diamond in the rough
This report is an extended version of our Daily Focus write up, titled “Diamond or a broken glass?” dated August 5. Through this report, we aim to draw investor attention to MNC Investama (BHIT) which is on our focus list.
A proxy to Indonesia’s domestic growth story
We consider BHIT to be a proxy to Indonesia’s domestic growth story. Established in 1989, MNC Investama (BHIT) is the ultimate listed holding company of the MNC group. The group operates in three main areas of businesses: integrated media, financial services, and property. The company and its subsidiaries are less affected by the on-going external noises (e.g., geopolitical risks, etc), given its earnings are mostly domestically driven (revenue generated from its media-related subsidiaries accounted for 84.5% of the group’s consolidated figures).
Strong core earnings growth to gain investor attention
BHIT recorded a consolidated net loss of IDR159.4bn in 2Q14. However, weak bottom line earnings were not driven by deterioration of its core operations. Indeed, BHIT’s revenue and operating profit both hit historical high for the quarter with IDR3,286.7bn and IDR905.9bn, respectively. The main culprit behind BHIT’s weak bottom line earnings was losses incurred from weakening of the local currency (BHIT reflected foreign exchange losses of IDR413.7bn in 2Q14). However, we consider BHIT’s bottom line earnings to be non-operational and expect to see stability as FX rates normalize.
Attractive growth at compelling price
Given its diversified business lineup, we believe BHIT is well positioned to capture the domestic growth agenda. Given positive demographics profile of Indonesia and rising middle class, we think its media subsidiaries are able to generate sustainable growth over the longer horizon. Despite the fact that its financial units are less likely to drive top line earning growth, we believe they will generate cost synergies for the group. We also expect to see stable earnings flow from its property business, on the back of a favorable property market outlook. From a valuation perspective, we do not think current share price correctly reflects BHIT’s earnings generating ability. In our view, there has been a sharp divergence between earnings and valuations since 1Q13. Furthermore, our analysis shows that BHIT’s valuations (P/OP of 12.7x) are relatively discounted against its subsidiaries (P/OP: BMTR 37.2x, MNCN 47.8x, KPIG 356.5x). From a historical perspective, current valuations are lower than its post crisis average of 17.3x.
Holding companies
Company report
August 20, 2014
Not Rated
Target Price (12M, IDR)
N/A
Share Price (8/20/14,IDR)
372
Expected Return
N/A
Market Cap (IDRbn) 13,389.9
Shares Outstanding (mn) 35,994.4
52-Week Low 298
Share price trajectory vs. valuations
Note: In calculating our P/E. we compared BHIT’s share price to operating profit per share Source: Company data, KDB Daewoo Securities Indonesia Research
0
Company snapshot
MNC Investama (BHIT) is the ultimate listed holding company of the MNC group listed in the Indonesian market (ticker: BHIT IJ). The company was established in 1989 under the name Bhakti Investama (which was later renamed as MNC Investama) and is mainly engaged in investments. MNC group has three main businesses, namely, integrated media, financial services, and property. Well-known subsidiaries include Global Mediacom (BMTR IJ), Media Nusantara Citra (MNCN IJ), MNC Kapital Indonesia (BCAP IJ), MNC Land (KPIG IJ) and others. In addition to the group’s key area of businesses, the company owns various companies as portfolio investments.
Figure 1. MNC group structure
Source: Company data, KDB Daewoo Securities Indonesia
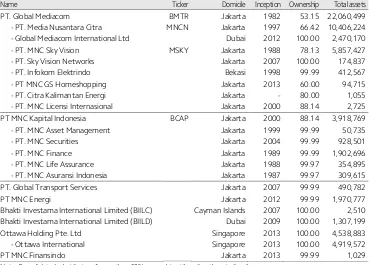
Table 1. Consolidated subsidiaries (2Q14) (%, IDRmn)
Name Ticker Domicile Inception Ownership Total assets
PT. Global Mediacom BMTR Jakarta 1982 53.15 22,060,499
- PT. Media Nusantara Citra MNCN Jakarta 1997 66.42 10,406,224 - Global Mediacom International Ltd Dubai 2012 100.00 2,470,170 - PT. MNC Sky Vision MSKY Jakarta 1988 78.13 5,857,427
- PT. Sky Vision Networks Jakarta 2007 100.00 174,837
- PT. Infokom Elektrindo Bekasi 1998 99.99 412,567
- PT MNC GS Homeshopping Jakarta 2013 60.00 94,715
- PT. Citra Kalimantan Energi Jakarta - 80.00 1,055
- PT. MNC Licensi Internasional Jakarta 2000 88.14 2,725
PT MNC Kapital Indonesia BCAP Jakarta 2000 88.14 3,918,769
- PT. MNC Asset Management Jakarta 1999 99.99 50,735
- PT. MNC Securities Jakarta 2004 99.99 928,501
- PT. MNC Finance Jakarta 1989 99.99 1,902,696
- PT. MNC Life Assurance Jakarta 1988 99.97 354,895
- PT. MNC Asuransi Indonesia Jakarta 1987 99.97 309,615
PT. Global Transport Services Jakarta 2007 99.99 490,782
PT MNC Energi Jakarta 2012 99.99 1,970,777
Bhakti Investama International Limited (BIILC) Cayman Islands 2007 100.00 2,510 Bhakti Investama International Limited (BIILD) Dubai 2009 100.00 1,307,199
Ottawa Holding Pte. Ltd Singapore 2013 100.00 4,538,883
- Ottawa International Singapore 2013 100.00 4,919,572
PT MNC Finansindo Jakarta 2013 99.99 1,029
On a consolidated basis, the company’s assets are heavily concentrated towards the media sector. According to the latest company filings (2Q14), Global Mediacom and its subsidiaries accounted for 64.3% of the group’s total assets. On the earnings side, revenue generated from its media-related subsidiaries accounted for 84.5% of the group’s consolidated figures (aggregated sum of content and advertising-based media and subscribers-based media).
Figure 2. Asset decomposition (2Q14) Figure 3. Revenue decomposition (2Q14)
Source: Company data, KDB Daewoo Securities Indonesia Source: Company data, KDB Daewoo Securities Indonesia
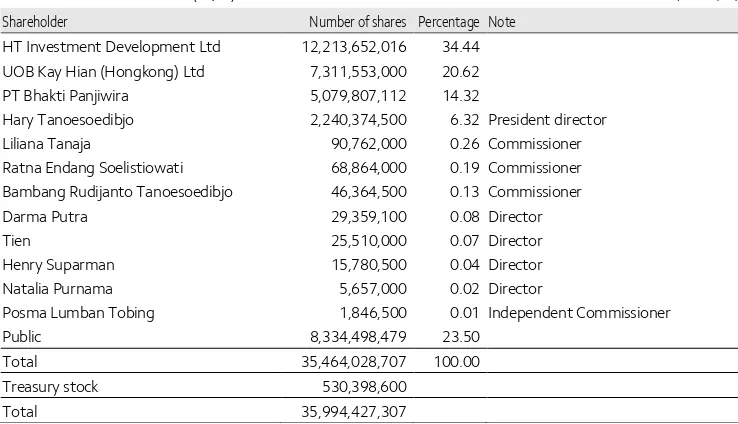
Among the top 4 largest shareholders, HT Investment Development, PT Bhakti Panjiwira and Mr. Hary Tanoesoedibjo collectively owns 55.1% stake (or 19.5bn shares) in the company. According to our findings from multiple press reports, they are known to be directly or indirectly related to Mr. Tanoesoedibjo.
Most of the BHIT’s senior management team has stake in the company (representing 7.1% of the outstanding shares). In our view, management team’s ownership in the company is a clear indication that the management’s interest is aligned well with shareholder value.
Table 2. Shareholder structure (2Q14) (Shares, %)
Shareholder Number of shares Percentage Note HT Investment Development Ltd 12,213,652,016 34.44 UOB Kay Hian (Hongkong) Ltd 7,311,553,000 20.62
PT Bhakti Panjiwira 5,079,807,112 14.32
Hary Tanoesoedibjo 2,240,374,500 6.32 President director
Liliana Tanaja 90,762,000 0.26 Commissioner
Ratna Endang Soelistiowati 68,864,000 0.19 Commissioner Bambang Rudijanto Tanoesoedibjo 46,364,500 0.13 Commissioner
Darma Putra 29,359,100 0.08 Director
Tien 25,510,000 0.07 Director
Henry Suparman 15,780,500 0.04 Director
Natalia Purnama 5,657,000 0.02 Director
Posma Lumban Tobing 1,846,500 0.01 Independent Commissioner
Public 8,334,498,479 23.50
Total 35,464,028,707 100.00
Treasury stock 530,398,600
Total 35,994,427,307
Source: Company data, KDB Daewoo Securities Indonesia
58.8 25.7
7.0 6.9
0.9 0.7
Content and Advertising Based Media
Subscribers Based Media
Mining
Multifinance
Media Shopping
Telecommunication and Information Technology (%)
64.3
11.4 1.4
5.7 3.8
13.2 Global Mediacom
MNC Kapital Indonesia
Global Transport Services
MNC Energi
BIIL (D)
Since marking a trough during last April, BHIT’s transaction volume has started to pick up. As of July, monthly transaction volume leaped 237.7% to IDR237.7bn from IDR70.3bn in April. What is notable is that BHIT’s transaction volume increased significantly while market (JCI) transaction volume was trending downwards. Uncovering the trends, we underscore that foreigners were actively accumulating BHIT shares since the start of 2014. We believe foreign investors were behind the recent transaction volume increase.
Figure 4. BHIT monthly transaction volume Figure 5. Foreign net purchase (daily & cumulative)
Source: HOTS, KDB Daewoo Securities Indonesia Source: Bloomberg, KDB Daewoo Securities Indonesia
Well-diversified domestic play
In our view, BHIT is a well-diversified company with most of the earnings coming from the domestic market, which embeds ample growth potential. In other words, the company and its subsidiaries are less affected by the on-going external noises (e.g., geopolitical risks and others), given its core earnings are mostly domestically driven (i.e., media, financial services, property). That said, we consider BHIT to be a good proxy to Indonesia’s growing domestic market.
Table 3. BHIT's business strategy
Sector Key subsidiary Ticker Business strategy
Media Global Mediacom BMTR
Focus on our core business and reinforce our market leading position - Increase audience share in FTA Television
- Increase the number of channels in pay TY to increase the number of subscribers - Develop internet-based contents (e.g., WeChat application)
Financial services
MNC
Kapital BCAP
Grow our own financial services business as a "financial supermarket" - Acquisition of a bank to increase synergy
- Broaden our product offers with prudent risk management
Property MNC Land KPIG
Become one of the most integrated and trustworthy property companies in Indonesia - Focus on establishing an integrated resort to be "The most integrated resort and
entertainment property development"
- Deliver high-quality properties to increase market competitiveness
Portfolio investments
Pursue other strategic portfolio companies
- Focus on strategic investments that benefits from fast growing Indonesia's macro economy - Accelerate exploration to increase coal reserves
- Accelerate the establishment of supporting infrastructures - Improve efficiency to increase profit margin
Source: Company data, KDB Daewoo Securities Indonesia
-150
Media
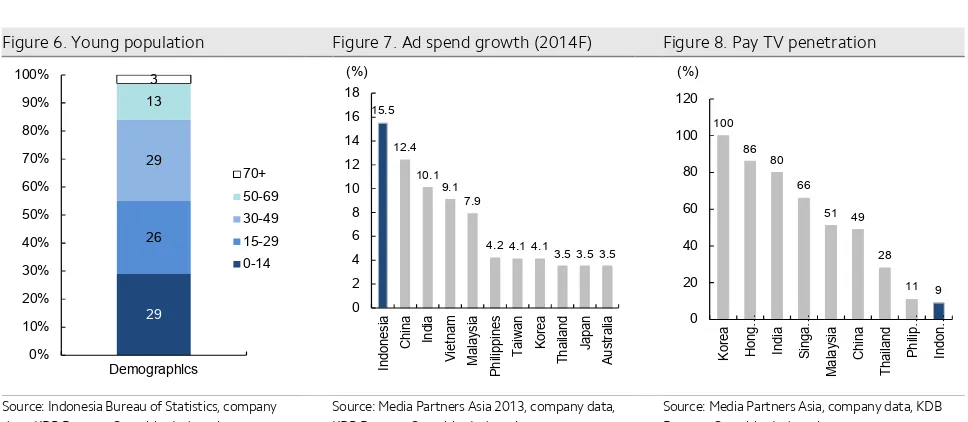
The large population base in Indonesia is a strong foundation for robust and sustainable economic growth. Moreover, a young demographic profile of Indonesia is quite promising. According to Indonesia Bureau of Statistics, 84% of Indonesian population is below 50 years old. A fast-growing economy is expected to lead to higher household income, which should broaden the consumption base. At the end of the day, we expect BHIT to be able to capture the growing middle class agenda given higher income will lead to more audiences. According to the company, the average daily TV viewing time per person in Indonesia is c. 300min, which is similar to US (293min), but relatively higher than Russia (238min), Brazil (216min), Australia (186min) and China (164min).
This favorable macro backdrop is expected to drive advertisement spending. According to Media Partners Asia, ad spend growth in 2014 is expected to be paced at 15.5%, which should be one of the highest within the region. We also believe that TV is one of the most efficient medium to expand companies’ brand (product) awareness. Furthermore, given low base, there is ample room for growth, in our view. Its Pay TV business (through MNC Skyvision and others) is also expected to generate solid earnings growth. Given low pay TV penetration (lowest among Asian peers), we believe pay TV market also embeds ample organic growth potential. Collectively, we consider its media subsidiaries to generate stable earnings growth going forward.
Table 4. Financial summary of Global Mediacom (IDRbn)
2008 2009 2010 2011 2012 2013
Revenue 5,384.6 5,034.9 6,326.5 7,162.9 8,925.4 10,020.0
Operating profit 572.7 612.9 1,383.6 1,930.1 2,645.3 2,857.3
Net profit 425.7 157.2 578.9 779.4 1,299.1 620.4
ROE (%) 6.1 2.2 8.0 10.1 14.0 6.3
Source: Company data, KDB Daewoo Securities Indonesia
Figure 6. Young population Figure 7. Ad spend growth (2014F) Figure 8. Pay TV penetration
Source: Indonesia Bureau of Statistics, company data, KDB Daewoo Securities Indonesia
Source: Media Partners Asia 2013, company data, KDB Daewoo Securities Indonesia
Source: Media Partners Asia, company data, KDB Daewoo Securities Indonesia
Table 5. Top 20 channels (As of 1Q14)
No. Channel No. Channel
1 Cartoon Network 11 MNC Infotainment
2 Disney Junior/Playhouse 12 MNC Life Style
3 Cinemax 13 S-One
Financial services
MNC group provides a wide range of comprehensive financial services. Under the umbrella of the financial arm of the group, MNC Kapital (BCAP IJ), MNC provides consumer finance, brokerage, life/non-life insurance, and asset management services. MNC Kapital also owns 39.75% stake in PT Bank ICB Bumiputera (as of July 25), which management plans to consolidate in the near horizon.
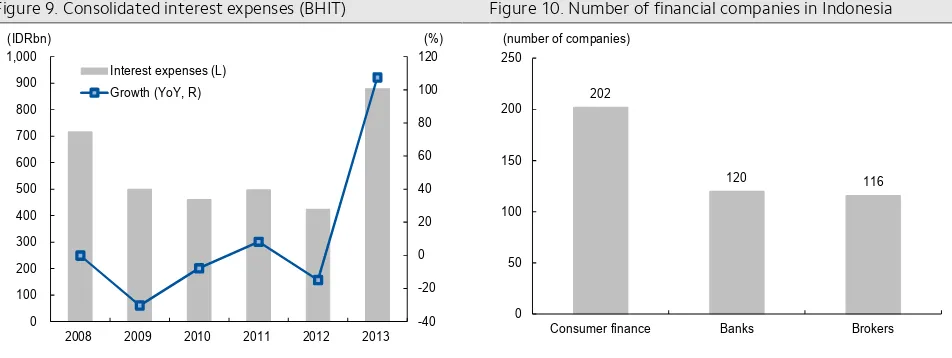
However, we do not expect the financial services units to be the group’s key revenue driver in the near term. While the management showed keen interest in strengthening its finance units, we think chances are low for the group to significantly outperform market growth. While MNC Kapital’s consolidated assets contribute 11.4% of the group’s total assets, revenue contribution stood at 6.9%. Our key arguments are: 1) its financial subsidiaries have weaker footprints in the local market compared to its well-reputed media subsidiaries. 2) Furthermore, despite high entry barriers, market is highly fragmented and competition is fierce. To elaborate further, even if the company delivers a meaningful Q increase, P is likely to remain squeezed. Collectively, we think achieving organic growth is an elusive ideal for the group. We consider in-organic growth to be a better fit strategy for the group to gain exposure to the fast-growing financial market.
Despite our expectations that its financial arm is unlikely to drive top line growth for the group, we believe that its financial companies can contribute to reducing the group’s unnecessary expenses related to the group’s financial activities. We highlight that the group has a full line up of financial companies which enables the group to capture any leakages.
Given the nature of the financials industry being highly regulated and capital intensive, we believe prudent capital management is highly important. We think it is imperative for the management to identify potential segment(s) of growth and deploying capital to capture the growth on their financial statements. The price tag on the license should also be a key consideration for both the management and investors as potential overpayment risk in pursuing its in-organic strategy should deteriorate investor sentiment.
Table 6. Financial summary of MNC Kapital (IDRbn)
2008 2009 2010 2011 2012 2013
Revenue 162.7 133.7 239.7 298.7 603.6 592.4
Operating profit 201.0 61.1 779.3 508.0 1,776.1 319.0
Net profit 16.1 6.9 90.3 50.5 161.7 5.6
ROE (%) 4.4 1.8 21.3 10.3 25.0 0.7
Source: Company data, KDB Daewoo Securities Indonesia
Figure 9. Consolidated interest expenses (BHIT) Figure 10. Number of financial companies in Indonesia
Source: Company data, KDB Daewoo Securities Indonesia Source: Bank Indonesia, IDX, APPI, KDB Daewoo Securities Indonesia
-40 -20 0 20 40 60 80 100 120
0 100 200 300 400 500 600 700 800 900 1,000
2008 2009 2010 2011 2012 2013 Interest expenses (L)
Growth (YoY, R)
(IDRbn) (%)
202
120 116
0 50 100 150 200 250
Property and others
MNC Land is a listed arm of the group (KPIG IJ) engaging in property business. Its revenue sources stem from its hotels (74.8%), office space rental (20.1%), and property management services (5.1%). On June 28, 2013, BHIT acquired 26.6% stake in KPIG increasing its stake holding in the company to 41%. The company is currently recognized as investment in associates.
The company believes that the outlook for the property market is favorable. Indeed, according to recent trends, home prices are still heading north while office rent prices remain stable with low vacancy rate. Its existing commercial property portfolios are strategically located in Jakarta (Grand Hyatt, Keraton At the Plaza) and Bali (Westin Hotel, Pan Pacific Nirwana Bali Resort). Furthermore, KPIG has a number of on-going commercial projects in Surabaya, Jakarta which are expected to contribute to its earnings upon completion.
All in all, we believe KPIG’s earnings contribution will reduce the group’s earnings volatility over the long-term as most of the earnings generated from its business are likely to be recurring earnings. Reduced earnings volatility should reinforce investor confidence on BHIT, we think.
Figure 11. Home price index (Indonesia main 13 cities) Figure 12. Commercial property price and vacancy trends
Source: Bloomberg, KDB Daewoo Securities Research Source: Cushman & Wakefield, KDB Daewoo Securities Research
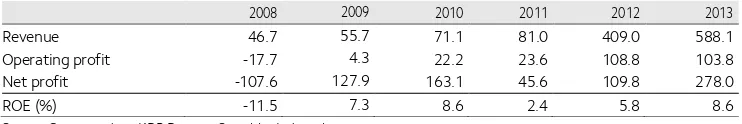
Table 7. Financial summary of MNC Land (IDRbn)
2008 2009 2010 2011 2012 2013
Revenue 46.7 55.7 71.1 81.0 409.0 588.1
Operating profit -17.7 4.3 22.2 23.6 108.8 103.8
Net profit -107.6 127.9 163.1 45.6 109.8 278.0
ROE (%) -11.5 7.3 8.6 2.4 5.8 8.6
Source: Company data, KDB Daewoo Securities Indonesia
Through its subsidiary, MNC Energi (not listed), BHIT is exploring new business opportunities in energy and natural resources, in particular coal, oil and gas mining. While MNC Energi is considered a new comer to the group (inception: 2012), its earnings contribution to the group was quite impressive. MNC Energi contributed 6.0% of the group’s consolidated revenues as of 2013 (6.9% in 2Q14). MNC Energy holds 8 Mining Business Licenses in South Sumatera (1 mining concession at production stage, 7 mining concession at exploration stage) and 1 Mining Business License in East Kalimantan which is currently at the production stage. According to the company, it will focus on production development in 2014. Although relatively small in size, we believe its coal business can generate solid earnings amid recent discussions of the new administration planning to lift domestic consumption of coal.
0.0 1.0 2.0 3.0 4.0 5.0 6.0 7.0 8.0
0 10 20 30 40 50 60
4Q12 1Q13 2Q13 3Q13 4Q13 1Q14 2Q14 Grade A office rent (R)
Vacancy (L)
(USD/sqm per month) (%)
0.0 1.0 2.0 3.0 4.0 5.0 6.0 7.0
115 120 125 130 135 140 145 150
3/10 9/10 3/11 9/11 3/12 9/12 3/13 9/13 3/14 Home price index (L)
Change (YoY, R)
Solid core earnings growth to gain investor attention
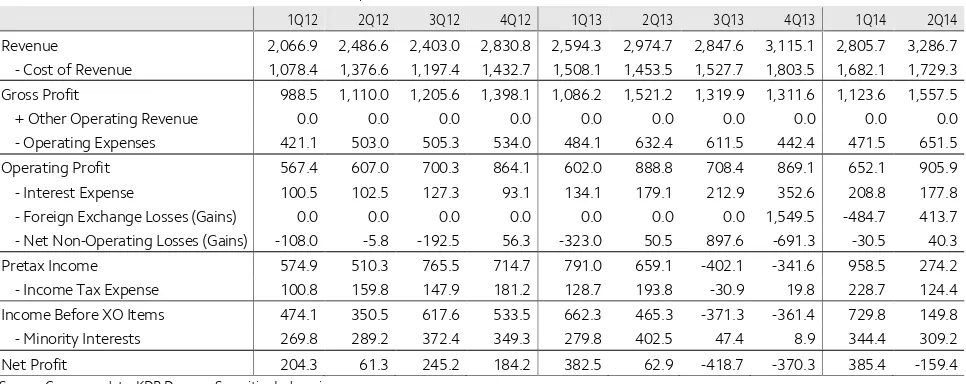
BHIT recorded a consolidated net loss of IDR159.4bn in 2Q14. We suspect that 2Q14 earnings were a disappointment to investors after delivering solid earnings rebound in 1Q14. However, we would like to make note of the fact that weak bottom line earnings were not driven by deterioration of its core operations. Indeed, BHIT’s revenue and operating profit both hit historical high for the quarter with IDR3,286.7bn and IDR905.9bn, respectively.
The main culprit behind BHIT’s weak bottom line earnings was losses incurred from weakening of the local currency (BHIT reflected foreign exchange losses of IDR413.7bn in 2Q14). According to the latest company filings, BHIT has two significant USD liabilities exposures: 1) Senior secured notes (USD365mn; Note 26. Bonds Payable – Net) and 2) Syndication loans (USD215mn; Note 25. Long-Term Loans). We consider BHIT’s bottom line earnings to be non-operational and expect to see stability as FX rates normalizes. Quick details regarding the FX exposures are as follows:
nSenior secured notes (USD365mn): On May 16, 2013, Ottawa Holding issued senior
secured notes of USD365mn embedding a fixed rate of 5.875% per annum with maturity of 5 years. The proceeds were used to pay off the bridge loan which was borrowed to acquire new shares issued by MNC Land and other general purposes.
nSyndication loans (USD215mn): On November 19, 2013, MNC Sky Vision signed a
syndication loan agreement of USD215mn (interest rate: LIBOR+4.25%) from a syndication of banks. The loan has a maturity of 3 years with 25% of the principle due on the 33rd month and the remaining on the 36th month from the first utilization.
Table 8. Consolidated income statement of BHIT (Quarterly) (IDRbn)
1Q12 2Q12 3Q12 4Q12 1Q13 2Q13 3Q13 4Q13 1Q14 2Q14
Source: Company data, KDB Daewoo Securities Indonesia
Figure 13. Core earnings marked record high in 2Q14 Figure 14. Bottom line earnings swing driven by non-op items
Source: Company data, KDB Daewoo Securities Indonesia Source: Company data, KDB Daewoo Securities Indonesia
0
1Q12 2Q12 3Q12 4Q12 1Q13 2Q13 3Q13 4Q13 1Q14 2Q14 Revenue
Attractive domestic growth story at compelling price
We consider BHIT to be a proxy to Indonesia’s domestic growth story. Also, given its diversified business lineup, we believe BHIT is well positioned to capture the domestic growth agenda, we think. Our view on its businesses are summarized below
n Its media business is expected to deliver solid growth as rising middle class should
translate into higher revenue. Since post-GFC, BMTR and its subsidiaries exhibited resilient revenue growth evident by its average growth pace of 18.9% per annum. In 2013, BMTR posted revenue and operating profit of IDR10.0tr and IDR2.9tr respectively which both came in at record highs.
n Although we do not consider BHIT’s financial subsidiaries to drive top line earnings,
through its well-diversified financial lineup of businesses, we think the group’s financial units will generate cost synergies. Prudent capital management is the key in achieving in-organic growth. However, given the management team’s ownership in the company, we believe BHIT’s strategic approach is less likely to be value destructive, in our view.
n The outlook for Indonesia’s property market is favorable. We consider most of the
revenue to be recurring supported by the fact that its revenue delivery was not in any way affected by the recent GFC. That said, we believe KPIG’s earnings contribution to the group will lead to reduced volatility which should reinforce investor confidence.
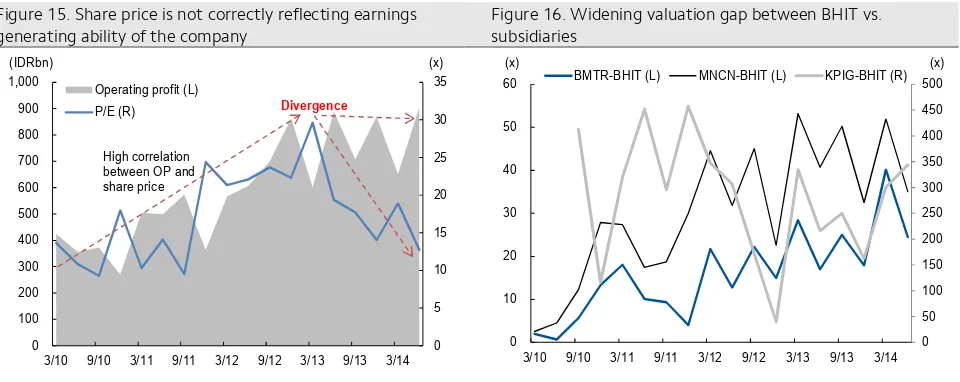
Given BHIT recorded a net loss for the full year of 2013 and quarterly net loss in 2Q14, we believe assessing (or valuing) its core earnings generating ability is more relevant than using the traditional net profit method. To get a brief sense of how the company is valued, we are comparing the core earnings generating ability of BHIT and its subsidiaries by using operating profit per share. Below are some of our findings:
n According to our analysis, the correlation between BHIT’s share price and its operating
profit has been broken since 1Q13. In other words, BHIT’s share price does not correctly reflect its core earnings generating ability, we think (figure 15).
n Although coming off the peak, we note that the valuation gap between BHIT and its
subsidiaries are still wide. Valuation gaps between BMTR, MNCN, and KPIG stand at 24.5x, 35.0x and 343.8x, respectively vs. post GFC average at 16.0x, 30.5x, and 283.0x (figure 16).
n As of last trade on June 30, the company’s shares are trading at 12.7x current price to operating profit, which represents a 26.6% discount to post GFC average of 17.3x.
Figure 15. Share price is not correctly reflecting earnings generating ability of the company
Figure 16. Widening valuation gap between BHIT vs. subsidiaries
Source: Company data, KDB Daewoo Securities Research Source: Company data, KDB Daewoo Securities Research
0
3/10 9/10 3/11 9/11 3/12 9/12 3/13 9/13 3/14 Operating profit (L)
3/10 9/10 3/11 9/11 3/12 9/12 3/13 9/13 3/14 BMTR-BHIT (L) MNCN-BHIT (L) KPIG-BHIT (R)
Important Disclosures & Disclaimers
Stock Ratings Industry Ratings
Buy Relative performance of 20% or greater Overweight Fundamentals are favorable or improving
Trading Buy Relative performance of 10% or greater, but with volatility Neutral Fundamentals are steady without any material changes Hold Relative performance of -10% and 10% Underweight Fundamentals are unfavorable or worsening
Sell Relative performance of -10%
* Ratings and Target Price History (Share price (----), Target price (----), Not covered (■), Buy ( ), Trading Buy ( ), Hold ( ), Sell ( )) ▲ ■ ● ◆
* Our investment rating is a guide to the relative return of the stock versus the market over the next 12 months.
* Although it is not part of the official ratings at Daewoo Securities, we may call a trading opportunity in case there is a technical or short-term material development.
* The target price was determined by the research analyst through valuation methods discussed in this report, in part based on the analyst’s estimate of future earnings.
The achievement of the target price may be impeded by risks related to the subject securities and companies, as well as general market and economic conditions.
Analyst Certification
The research analysts who prepared this report (the “Analysts”) are registered with the Korea Financial Investment Association and are subject to Korean securities regulations. They are neither registered as research analysts in any other jurisdiction nor subject to the laws and regulations thereof. Opinions expressed in this publication about the subject securities and companies accurately reflect the personal views of the Analysts primarily responsible for this report. Daewoo Securities Co., Ltd. policy prohibits its Analysts and members of their households from owning securities of any company in the Analyst’s area of coverage, and the Analysts do not serve as an officer, director or advisory board member of the subject companies. Except as otherwise specified herein, the Analysts have not received any compensation or any other benefits from the subject companies in the past 12 months and have not been promised the same in connection with this report. No part of the compensation of the Analysts was, is, or will be directly or indirectly related to the specific recommendations or views contained in this report but, like all employees of Daewoo Securities, the Analysts receive compensation that is impacted by overall firm profitability, which includes revenues from, among other business units, the institutional equities, investment banking, proprietary trading and private client division. At the time of publication of this report, the Analysts do not know or have reason to know of any actual, material conflict of interest of the Analyst or Daewoo Securities Co., Ltd. except as otherwise stated herein.
Disclaimers
This report is published by Daewoo Securities Co., Ltd. (“Daewoo”), a broker-dealer registered in the Republic of Korea and a member of the Korea Exchange. Information and opinions contained herein have been compiled from sources believed to be reliable and in good faith, but such information has not been independently verified and Daewoo makes no guarantee, representation or warranty, express or implied, as to the fairness, accuracy, completeness or correctness of the information and opinions contained herein or of any translation into English from the Korean language. If this report is an English translation of a report prepared in the Korean language, the original Korean language report may have been made available to investors in advance of this report. Daewoo, its affiliates and their directors, officers, employees and agents do not accept any liability for any loss arising from the use hereof. This report is for general information purposes only and it is not and should not be construed as an offer or a solicitation of an offer to effect transactions in any securities or other financial instruments. The intended recipients of this report are sophisticated institutional investors who have substantial knowledge of the local business environment, its common practices, laws and accounting principles and no person whose receipt or use of this report would violate any laws and regulations or subject Daewoo and its affiliates to registration or licensing requirements in any jurisdiction should receive or make any use hereof. Information and opinions contained herein are subject to change without notice and no part of this document may be copied or reproduced in any manner or form or redistributed or published, in whole or in part, without the prior written consent of Daewoo. Daewoo, its affiliates and their directors, officers, employees and agents may have long or short positions in any of the subject securities at any time and may make a purchase or sale, or offer to make a purchase or sale, of any such securities or other financial instruments from time to time in the open market or otherwise, in each case either as principals or agents. Daewoo and its affiliates may have had, or may be expecting to enter into, business relationships with the subject companies to provide investment banking, market-making or other financial services as are permitted under applicable laws and regulations. The price and value of the investments referred to in this report and the income from them may go down as well as up, and investors may realize losses on any investments. Past performance is not a guide to future performance. Future returns are not guaranteed, and a loss of original capital may occur.
Disclosures
Distribution
United Kingdom: This report is being distributed by Daewoo Securities (Europe) Ltd. in the United Kingdom only to (i) investment professionals falling within Article 19(5) of the Financial Services and Markets Act 2000 (Financial Promotion) Order 2005 (the “Order”), and (ii) high net worth companies and other persons to whom it may lawfully be communicated, falling within Article 49(2)(A) to (E) of the Order (all such persons together being referred to as “Relevant Persons”). This report is directed only at Relevant Persons. Any person who is not a Relevant Person should not act or rely on this report or any of its contents.
United States: This report is distributed in the U.S. by Daewoo Securities (America) Inc., a member of FINRA/SIPC, and is only intended for major institutional investors as defined in Rule 15a-6(b)(4) under the U.S. Securities Exchange Act of 1934. All U.S. persons that receive this document by their acceptance thereof represent and warrant that they are a major institutional investor and have not received this report under any express or implied understanding that they will direct commission income to Daewoo or its affiliates. Any U.S. recipient of this document wishing to effect a transaction in any securities discussed herein should contact and place orders with Daewoo Securities (America) Inc., which accepts responsibility for the contents of this report in the U.S. The securities described in this report may not have been registered under the U.S. Securities Act of 1933, as amended, and, in such case, may not be offered or sold in the U.S. or to U.S. persons absent registration or an applicable exemption from the registration requirements.
Hong Kong: This document has been approved for distribution in Hong Kong by Daewoo Securities (Hong Kong) Ltd., which is regulated by the Hong Kong Securities and Futures Commission. The contents of this report have not been reviewed by any regulatory authority in Hong Kong. This report is for distribution only to professional investors within the meaning of Part I of Schedule 1 to the Securities and Futures Ordinance of Hong Kong (Cap. 571, Laws of Hong Kong) and any rules made thereunder and may not be redistributed in whole or in part in Hong Kong to any person.
All Other Jurisdictions: Customers in all other countries who wish to effect a transaction in any securities referenced in this report should contact Daewoo or its affiliates only if distribution to or use by such customer of this report would not violate applicable laws and regulations and not subject Daewoo and its affiliates to any registration or licensing requirement within such jurisdiction.
KDB Daewoo Securities International Network
PT. Daewoo Securities Indonesia Daewoo Securities Co. Ltd. (Seoul) Daewoo Securities (Hong Kong) Ltd. Equity Tower 50th Floor
Jl.Jend Sudirman, SCBD Lot 9 Jakarta 12190
Head Office
14, Eunhaeng-ro, Yeongdeungpo-gu Seoul 150-973
Korea
Suites 2005-2012
Two International Finance Centre 8 Finance Street, Central Hong Kong
Tel: 62-21-2553-1000 Tel: 82-2-768-3026 Tel: 85-2-2514-1304
Daewoo Securities (America) Inc. Daewoo Securities (Europe) Ltd. Daewoo Securities (Singapore) Pte. Ltd. 320 Park Avenue, 31st Floor.
New York, NY 10022 United States
41st Floor, Tower 42 25 Old Broad Street London EC2N 1HQ United Kingdom
Six Battery Road #11-01 Singapore, 049909
Tel: 1-212-407-1000 Tel: 44-20-7982-8000 Tel: 65-6671-9845
Tokyo Representative Office Beijing Representative Office Shanghai Representative Office 7F, Yusen Building, 2-3-2
Marunouchi, Chiyoda-ku Tokyo 100-0005 Japan
2401A, 24th Floor. East Tower
Twin Tower, B-12 Jianguomenwai Avenue Chaoyang District, Beijing 100022 China
Room 38T31, 38F SWFC
100 Century Avenue, Pudong New Area, Shanghai, 200120
China
Tel: 81-3- 3211-5511 Tel: 86-10-6567-9699 Tel: 86-21-5013-6392
Ho Chi Minh Representative Office Daewoo Investment Advisory (Beijing) Co., Ltd Daewoo Securities (Mongolia) LLC Suites 901B. Centec Tower
72-74 Nguyen Thi Minh Khai St, Ward 6 District 3, HCMC
2401B,24th Floor. East Tower
Twin Tower, B-12 Jianguomenwai Avenue Chaoyang District, Beijing 100022 China