Report 2: March 2015
Western Australian
Auditor General’s Report
Office of the Auditor General
Western Australia
7th Floor Albert Facey House 469 Wellington Street, Perth
Mail to:
Perth BC, PO Box 8489 PERTH WA 6849
T: 08 6557 7500
F: 08 6557 7600
W: www.audit.wa.gov.au
National Relay Service TTY: 13 36 77
(to assist people with hearing and voice impairment) On request, we can deliver this report in an alternative format for those with visual impairment.
© 2015 Office of the Auditor General Western Australia. All rights reserved. This material may be reproduced in whole or in part provided the source is acknowledged.
WESTERN AUSTRALIAN AUDITOR GENERAL’S REPORT
Main Roads Projects to Address
Traffic Congestion
THE PRESIDENT THE SPEAKER
LEGISLATIVE COUNCIL LEGISLATIVE ASSEMBLY
MAIN ROADS PROJECTS TO ADDRESS TRAFFIC CONGESTION
This report has been prepared for submission to Parliament under the provisions of section 25 of the Auditor General Act 2006.
Performance audits are an integral part of the overall audit program. They seek to provide Parliament with assessments of the effectiveness and efficiency of public sector programs and activities, and identify opportunities for improved performance.
This audit assessed whether Main Roads infrastructure and traffic management projects are effective in addressing traffic congestion in metropolitan Perth.
My report finds that Main Roads is delivering congestion projects on time and budget and with effect. However, I have identified a number of weaknesses and have made a number of recommendations that if implemented will allow Main Roads and other transport agencies to better manage traffic congestion.
I wish to acknowledge the staff at Main Roads for their cooperation with this audit and for the valuable role they play in managing traffic congestion in our growing city.
Contents
Auditor General’s Overview ... 4
Executive Summary ... 5
Demand on the road network has increased and traffic congestion is predicted to get worse ...12
Rapid population growth has impacted the road network ... 12
Traffic congestion is expected to get worse ... 12
Main Roads does not know if its activities to improve congestion provide the best use of resources ...16
There are no agreed measures or targets for traffic congestion or Main Roads performance ... 16
The transport planning framework has not been finalised ... 16
Main Roads has a Traffic Congestion Management Strategy, but there is no clear delivery program or budget ... 17
Main Roads does not have good information to inform traffic congestion decision-making ...19
Main Roads does not know the extent of traffic congestion across its road network ... 19
Seven uncoordinated systems collect data for different operational and planning purposes across the agency ... 20
Main Roads has mitigated traffic congestion on parts of the road network and within the CBD ...22
Main Roads’ congestion projects vary in scale and type ... 22
Projects were delivered under budget, within reasonable timeframes and had the desired local impact ... 22
Capacity to manage traffic congestion is growing ...24
Main Roads is changing its focus from road building to network managing ... 24
New data collection and analysis will improve understanding ... 24
Appendix 1: Main Roads is directly responsible for 850 kilometres of freeways, highways and arterial roads in the metropolitan area ...26
Auditor General’s Overview
Many benefits come with living in a growing modern city like Perth; from
economic opportunities to a more cosmopolitan ‘vibe’. However, there are
also challenges that come with bigger city life.
One of the most contentious issues is traffic congestion. Put simply, more people means more traffic, and in times of rapid expansion, more traffic means more congestion. Managing congestion is important, and challenging, not least because there is no simple agreed definition of when
congestion starts to become a problem. And everyone who travels, by road, or bike or public transport has their own experience and their own ideas about the problem and the solution. Decisions made by many government organisations impact on congestion. These include new land releases for residential development, locations of major employment hubs, public transport and road infrastructure choices, the availability of bike paths, and parking availability. This audit looked at one important part of government activity to manage congestion. Main Roads is responsible for developing and maintaining major roads in metropolitan Perth. As such, it has a prominent role in dealing with congestion. We assessed whether Main Roads had good information about congestion, how it prioritised congestion projects, and whether its projects were on time, on budget, and achieved the desired outcomes.
I found that Main Roads is undergoing significant organisational change and this will affect how it manages congestion. It is moving from an agency that builds and manages assets to a road network manager responsible for traffic flow. When completed, this will bring it into line with better practice in managing congestion, and should also improve the information provided by Main Roads to other policy makers.
I also found that Main Roads is delivering congestion projects on time and budget and with effect. However, the way Main Roads prioritises its project choices was not always clear, and as a result, I could not be certain the most effective or efficient projects were getting priority. Also, the capacity to effectively prioritise was limited by having comprehensive performance information available for only a small portion of the freeway network. Finally, Main Roads and other key transport agencies including the Department of Transport had not determined clear congestion targets, outcomes or performance levels.
Executive Summary
Introduction
This report provides an assessment of whether Main Roads infrastructure and traffic management projects are effective in addressing traffic congestion in metropolitan Perth. Our focus was on the information collection systems used by Main Roads to make decisions, how it prioritised congestion projects and if its projects were on time, on budget and successful.
Background
There is wide public agreement that traffic congestion in Perth has increased in the last 10 years and has become a major issue for Western Australia and its Government. However, there is no simple way to define the ‘problem’ or its causes, and nor is there any simple solution. High population growth in the last decade has increased pressure on Perth’s road infrastructure and public transport network. Several transport challenges within the Perth metropolitan area compound this pressure. These include:
the low density of the population distribution
limited availability of public transport options in outlying suburbs
concentration of employment in and around the Perth Central Business District (CBD)
limited river crossings and routes in and out of the CBD
the high reliance on cars; over 80 per cent of trips taken in the metropolitan region are made by private car
low vehicle occupancy.
Consequences of congestion include increased costs to the community and businesses through longer, less predictable travel times, lost productivity, additional running costs of vehicles and environmental pollution.
In 2007, the Commonwealth Government Bureau of Infrastructure, Transport and Regional Economics (BITRE) estimated that by 2020 congestion in Perth could cost the Western Australian economy $2.1 billion. In 2005, it reported this figure as $900 million.
International experience shows that addressing congestion is complex, and involves managing supply and demand. Encouraging less car commuting at peak times, more people per vehicle, and more use of public transport can reduce demand on the system. Doing this can include closing parts of the network to cars, increasing public transport capacity or imposing costs on people using roads. Managing supply can relieve congestion by adding extra road space and improving the efficiency and reliability of the existing road network.
Main Roads is directly responsible for 850 kilometres of freeways, highways and arterial roads in the metropolitan area (Appendix 1). The other 13 312 kilometres of roads in Perth are controlled by 30 local government authorities.
Audit Conclusion
Demand on the road network has increased and although difficult to define, Main Roads predicts that traffic congestion will get worse. Part of the solution requires Main Roads to manage the road network to minimise the effects of congestion and to provide information for other policy makers.
Main Roads could not demonstrate that its projects and activities to address congestion have made the best use of resources. The broad transport-planning framework is incomplete. There are no agreed traffic congestion priorities, performance levels, measures and targets across Main Roads and its partner agencies, such as DoT. Although Main Roads collects a lot of data, coherent congestion information is limited to a small part of the freeway network, and not reported to DoT or publicly. While effective strategic and operational transport decisions require comprehensive, consistent and real time information, this is a challenge in many jurisdictions.
Main Roads has delivered a number of projects that have mitigated congestion on parts of the network and within the CBD. They have been delivered under budget, within expected time and they have achieved their intended localised outcomes. Modelling suggests Main Roads’ activity has helped slow the increase of congestion.
Main Roads has recognised it does not have the capacity to manage traffic congestion effectively and is introducing significant changes to the way it does business. It has begun the process of changing from an agency that builds roads and manages assets to one that manages a road network and is responsible for traffic flow. This will bring Main Roads in line with better practice in managing traffic congestion. These changes should also allow government to make more informed transport decisions.
Key Findings
Demand on the road network has increased and traffic congestion has worsened as Perth has grown, but the picture is not straightforward:
national analysis continues to rank Perth in ‘mid-table’ of Australian capital cities
there are an estimated 2.1 million vehicles on WA roads, up 17 per cent from 2009
peak hour trips take longer than 10 years ago, but performance against four nationally agreed indicators improved slightly in early 2014
Main Roads modelling in 2013 suggested that by 2020 significant parts of the Main Roads network will be heavily congested during peak hour travel. However, updated modelling shows a less severe picture
travel away from the CBD has improved, while travel into the city in the morning has worsened.
Of its 850 kilometres of metropolitan road network, Main Roads only has comprehensive traffic congestion information on 78.5 kilometres of the Kwinana, Mitchell and Graham Farmer freeways. Data from this section of road forms the entire set of information provided as national performance indicators for metropolitan Perth. Information about the rest of the network is collected through six other systems or approaches, but is not analysed to give a whole-of-network view.
Traffic congestion information is not well shared or analysed within Main Roads and is not regularly reported to DoT or publicly. It does not consistently measure or report the volume of cars and freight vehicles on the whole network, vehicle occupancy levels or the percentage of recurrent and non-recurrent congestion. We expected this information to be readily available and reported. We note that Main Roads is investigating the use of GPS based systems, such as Tom Tom and Google, and has entered into an initial contract to obtain this information while investigating other data sources.
Main Roads projects have mitigated congestion on parts of the road network. Extra lanes on the three main freeways have eased peak hour travel away from the CBD. New traffic signals have improved traffic flows around the Mounts Bay Road-freeway interchange at Point Lewis. Trials to optimise traffic signals on Canning Highway have proved effective. These projects achieved the immediate desired impacts, were under budget and, with one exception, completed within expected timeframes.
Main Roads has extended its influence to improve congestion in the CBD, where the great majority of roads are the responsibility of the City of Perth. Although it has a very limited formal mandate, it has contracted tow-away services for clearways, and has established incident response services to clear crashes on parts of the freeway system. It has also tested new pedestrian signals to increase vehicle flow.
Recommendations
Main Roads and the Department of Transport should:
develop an integrated approach to managing congestion that will clearly define agency roles and responsibilities
formally agree on performance measures and targets for network performance
agree public and inter-agency reporting requirements for congestion information.
Main Roads should implement the changes outlined in its organisational review. Specifically, by the end of 2015 it should:
finalise how it will manage congestion as part of its future operating structure
determine staffing needs once its structural planning is complete
set internal performance measures that align with overall measures agreed with DoT
complete its review of data and information capabilities
Agency Response
Combined response from Main Roads and Department of Transport
Main Roads Western Australia (Main Roads) acknowledges that the purpose of the Audit was to provide an assessment of whether Main Roads infrastructure and traffic management projects are effective in addressing traffic congestion in metropolitan Perth in this moment of time. Main Roads agrees with point 3 of the findings, being that congestion is a major issue in Western Australia and there is no simple, single way to define the ‘problem’ or its causes and nor is there any simple solution.
In order to plan for and begin to address this problem, in August 2013 Main Roads established the Traffic Management Congestion Strategy and, as recognised during the Audit, has since successfully implemented several prioritised projects to address congestion. During this time Main Roads has also implemented structural organisational change and a review of its corporate strategy. Main Roads recognises congestion as a key driver of Keeping WA Moving – the new strategic direction transitioning Main Roads from a delivery agency whose primary purpose was to build and maintain road assets to an agency that provides world class outcomes for the customer through a safe, reliable and sustainable road based transport system.
Main Roads accepts that it is in a period of transition that includes the need for greater integration with the other agencies that form the transport portfolio. Main Roads also accepts all of the eight recommendations of the Audit. These recommendations are work in progress for Main Roads.
Expected timelines and milestones for implementing the recommendations are as follows: In relation to collective recommendations (R) for Main Roads and Department of Transport: R1: Develop an integrated approach to managing traffic congestion that will clearly define agency roles and responsibilities.
The current structure sees the Department of Transport responsibilities lying with demand management and policy and Main Roads managing network operations and providing input into policy.
An inter-agency workshop will be held before end June 2015 to clarify and more clearly articulate these roles and responsibility.
R2: Formally agree on performance measures and targets for network performance.
In order to agree on measures and targets we must first ensure the right data is being captured. A comprehensive study is being scoped to identify the road map and delivery plan for data fusion considering all data sources and portfolio user outcome requirements. This plan will be completed by December 2015.
R3: Agree public and inter-agency reporting requirements for traffic congestion information.
The agreement of these requirements forms part of the study referred to in R2 With regards to Main Roads specific recommendations:
R4: Finalise how congestion will be managed under Main Roads’ future operating structure.
R5: Determine staffing needs once structural planning is complete.
A structure and resource recommendation will be formed as part of the review.
A draft operating structure will be ready by October 2015.
R6: Set internal performance measures aligned to the overall measures agreed with DoT.
Interim performance measures are in place based on current available data.
Corporate performance measures relating to congestion will be set following the completion of the technology plan in December 2015.
R7: Complete review of data and information capabilities.
This review will be completed as detailed in R2.
R8: Finalise Main Roads’ five-year traffic congestion program plan including an implementation plan with budgets and timelines for each project.
Main Roads will complete a business case including strategic rationale to secure funding for a five year congestion program by December 2015.
These recommendations will form part of Main Roads four-point plan to change our approach to managing the network, including dealing with congestion, which will:
a) get the right people in place
b) measure performance and set targets
c) optimise the performance of the arterial road and freeway networks d) select the right projects.
Main Roads is committed to improving the mobility of people and efficiency of freight. This
performance audit will play an important part in shaping Main Roads’ response to traffic
Audit focus and scope
The objective of the audit was to assess if Main Roads infrastructure and traffic management projects are effective in addressing traffic congestion in metropolitan Perth.
The audit focused on three lines of inquiry:
Does Main Roads have a comprehensive information collection system to inform traffic congestion decision-making?
Does Main Roads prioritise its management of traffic congestion?
Are Main Roads infrastructure projects and initiatives to address traffic congestion delivered on time and on budget, and have they achieved desired outcomes?
As part of the audit, we looked at eight projects that Main Roads had identified as specifically addressing traffic congestion.
Demand on the road network has increased and
traffic congestion is predicted to get worse
Rapid population growth has impacted the road network
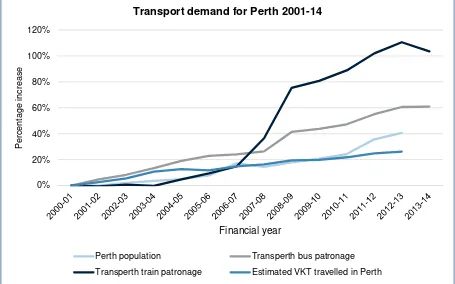
The population of Perth has grown significantly, leading to increased road use. The Australian Bureau of Statistics (ABS) reports there were 1.97 million people in greater Perth in June 2013, up four per cent from 2012. Perth has been the second-fastest growing capital city in Australia after Brisbane, and the ABS estimates its population could reach 5.5 million by 2061.Rapid population growth has resulted in more cars on the road. In 2014, the vehicle fleet in Western Australia reached 2.1 million vehicles, up nearly 315 000 vehicles, or 17 per cent, from 2009. Figure 1 details the percentage change in Perth’s population, bus and train patronage, and estimated vehicle kilometres travelled (VKT). Although there was a reported seven per cent drop in train use in 2013-14, Main Roads has not assessed its causes and impact on road traffic.
Source: OAG analysis, data from BITRE, ABS and PTA
Figure 1: Percentage change in Perth’s population, bus and train patronage, and estimated vehicle kilometres travelled
Traffic congestion is expected to get worse
There is broad agreement that traffic congestion in Perth has increased over the last decade. However, there is no single or simple measure of ‘congestion’. As a result, Main Roads uses many different measures and analyses to describe the situation, making clear comparisons or statements almost impossible. Different indicators show different performance, sometimes contradicting each other.
Common measures of congestion for peak time travel compared to off-peak travel include:
the delay per hour travelled during a nominated period, both as a percentage and in minutes
the decreased average speed over a nominated trip.
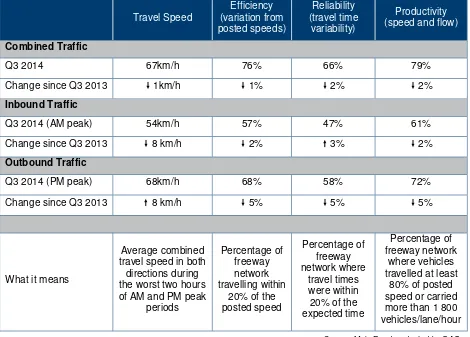
Main Roads monitors and reports to its executive on four nationally agreed indictors of congestion. These are travel speed, variation from speed limit (known as efficiency), variability from expected travel time (known as reliability) and a combined measure of speed and traffic
‘flow’.
Table 1 shows performance on the measured sections of the network dropped marginally in 2014 compared to 2013. This included a decrease in speed travelling towards the CBD but an increase in speed travelling away from the CBD. This is based on 78.5km of the Graham Farmer, Kwinana and Mitchell freeways. It does not include the rest of the Main Roads network.
Travel Speed
Source: Main Roads, adapted by OAG
Table 1: Perth’s reported freeway congestion at October 2014
Austroads1 has reported increased delays during peak periods between 2003-04 and 2012-13. This measure calculates the extra time a nominal trip takes in peak times compared with non-peak travel. The Perth morning non-peak delay increased from 25 to 45 seconds per kilometre travelled. This means that a 20-kilometre trip in peak hour would take up to 15 minutes longer than in non-peak periods. By comparison, the afternoon delay increased less, from 22 to 30 seconds per kilometre, taking the delay up to 10 minutes. This echoes other measures of higher congestion on into-Perth journeys and reflects funding priorities given to ease outward congestion.
In 2014, Tom Tom International data showed that while Perth’s congestion has worsened over
time, the city has generally held its place ‘mid-table’ among Australian capital cities. Table 2
shows Perth among most capital cities by ‘congestion index’ (the percentage increase in trip time taken compared to non-congested periods), the delay per hour travelled at peak times, and the change rate.
City Congestion Delay per hour driven
in peak period
Congestion change 2012 to 2013
Sydney 34% 38 minutes 1%
Melbourne 27% 30 minutes 1%
Perth 27% 28 minutes 3%
Adelaide 25% 26 minutes 3%
Brisbane 23% 25 minutes 2%
Canberra 17% 20 minutes 1%
Source: Tom Tom International, adapted by OAG
Table 2: Congestion in selected capital cities, 2013
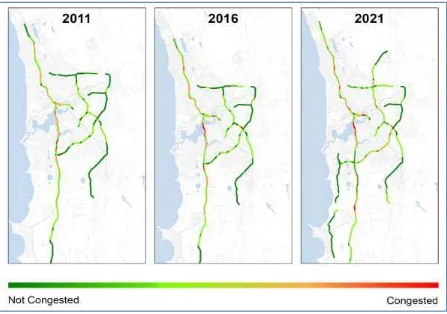
Until recently, Main Roads has used the Regional Operations Model (ROM) system to estimate future traffic congestion. This gives point-in-time modelling, taking data from other systems, including detailed national census data and customer surveys. The last main modelling took place in 2013, and predicted results for 2016 and 2021 against 2011 results. This predicted that the performance of the road network and traffic congestion on Perth metropolitan roads would get worse (Figure 2). In particular, it predicted that by 2021, a significant and increased proportion of the freeway and highway network during peak periods would be critically overloaded (shown in red).
Source: Main Roads, adapted by OAG
During our audit, we asked Main Roads to run this modelling on the new version of the ROM system. This included extra information about public transport use, and included expected outcomes from current projects. The results (Figure 3) show a much smaller increase in congestion, and an almost total absence of critically overloaded roads. This new prediction suggests that the activities undertaken by Main Roads and others will have a positive impact on congestion. However, the new modelling also suggests that the 2011 picture was less severe shown by the 2013 modelling. We note that Main Roads is in the process of introducing a new business intelligence system called STREAMS, which will improve data coordination within the Agency.
Source: Main Roads, adapted by OAG
Main Roads does not know if its activities to improve
congestion provide the best use of resources
There are no agreed measures or targets for traffic
congestion or Main Roads performance
Although Main Roads has a Traffic Congestion Management Strategy and a Traffic Congestion Management Program listing 49 projects, it has not set overall traffic congestion objectives, agreed service performance standards or targets. Projects are assessed individually for value and broad economic impact, and often on a local level for congestion. However, the absence of objectives makes it difficult for Main Roads to assess whether these choices have been the most economical, efficient or effective use of its resources.
Main Roads is part of a portfolio of key transport agencies that also includes DoT and the PTA. Historically, these agencies have shared little formal information, and despite their overlapping roles, they have not agreed any formal overarching measures of congestion or targets for performance. Agreed key metrics would allow them to focus information and project decisions, and to take a holistic view of programs and works. Conversely, their absence increases the likelihood of ad hoc information gathering and analysis, and decreases the chance of comparable analysis and decision-making.
Main Roads is considering how best to use the four nationally agreed congestion performance indicators of reliability, speed, efficiency and productivity. Travel reliability is emerging as a key measure of performance in many cities across the world. It is a measure of how close to expected travel time any given journey takes, against realistic estimates of expected time,
rather than posted speed limits or ‘perfect cases’.
The transport planning framework has not been finalised
A complex issue like congestion is more manageable if it operates within a sound and coordinated framework. Such a framework would include:
high-level planning policies and instruments that consider congestion in decision-making
an overarching congestion strategy with clear outcomes and measures
coordinated transport polices including private, freight, and public transport issues.
While the foundation of a broad framework exists, important aspects of it have not been finalised, increasing the risk of ineffective and even counterproductive decisions. Until the strategic transport planning framework is finalised, Main Roads and other transport agencies are limited in their ability to manage congestion effectively.
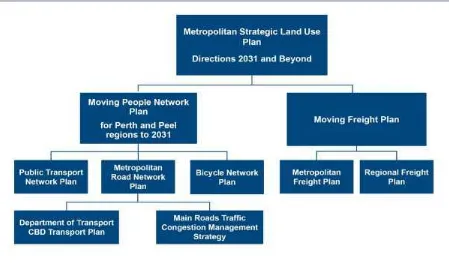
Source: Department of Transport
Figure 4: The planned transport management framework
An important part of the framework should be DoT’s Moving People Network Plan aimed at defining the function of the road network and improving the design for road based transit and cycling infrastructure. It was intended to support the whole-of-government land use strategy Directions 2031 and Beyond to ensure that transport and land use are linked to provide sustainable outcomes.
We found that the Moving People Network Plan has been in draft since September 2013 but has not been approved. The supporting Metropolitan Road Network Plan, which was to provide initiatives and strategies for network management has not been completed, although other
plans and polices have been created. These include DoT’s Perth CBD Transport Plan and
Main Roads’ Traffic Congestion Management Strategy.
The four core elements of the Moving People Network Plan are: identifying road use priority, establishing network operating plans, assessing operating performance and using network assessment to evaluate benefits of concepts and projects. These are key to ensuring decisions that impact on congestion are only made after considering strategic and wider network efficiency.
Main Roads has a Traffic Congestion Management Strategy,
but there is no clear delivery program or budget
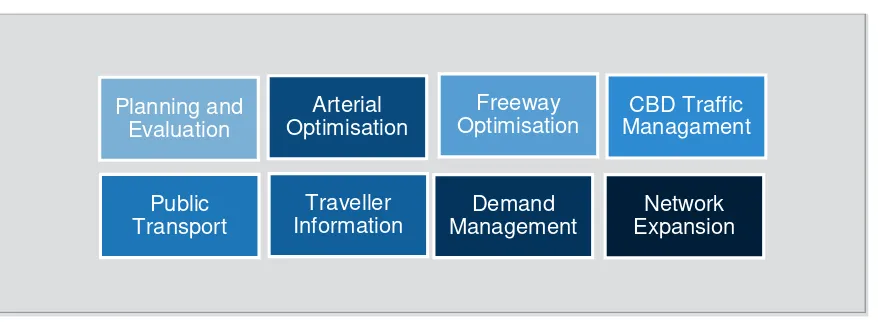
In August 2013, Main Roads established the Traffic Congestion Management Strategy. It was intended to fit into the high-level framework, to deliver an efficient, sustainable and safe road network. Prior to this, there had been no specific congestion policy or strategy.
Source: Main Roads
Figure 5: Main Roads congestion management focus areas
From these eight themes, Main Roads identified 49 metropolitan initiatives which, subject to available funding, it intends to deliver by 2018 (Appendix 2). They include optimising traffic light functions on sections of the network, working with the City of Perth on CBD traffic
management, and developing an improved ‘managed freeway’ approach for the Kwinana,
Mitchell and Graham Farmer freeways. The three major capital intensive freeway widening projects were not included. These were carried out when Commonwealth funding became available.
Main Roads has identified high, medium and longer-term priorities, and advised that it has targeted improving the afternoon, outbound journey along the freeway network and mitigating congestion within the CBD and known congested corridors. However, the reason for this targeting is not well documented and there are no criteria for prioritising projects. This increases the risk that they will not be ranked on the basis of the best use of resources. In addition, the projects are not delivered under a formal program that has a separate budget. This has meant that Main Roads cannot easily track or prioritise these projects, or seek funding for a program of work.
The Traffic Congestion Management Strategy envisaged a systematic review of the operation of the road network to maintain optimal performance. Main Roads planned to target investment into projects that would:
assist in relieving traffic bottlenecks and congestion hot spots
improve traffic signal coordination and optimisation
provide real time information (allowing road users to make informed travel choices)
improve integration of transport modes
implement active traffic management initiatives.
Main Roads does not have good information to inform
traffic congestion decision-making
Main Roads does not know the extent of traffic congestion
across its road network
Main Roads controls 850 kilometres of the metropolitan road network but has comprehensive traffic congestion information for less than 10 per cent of this network.
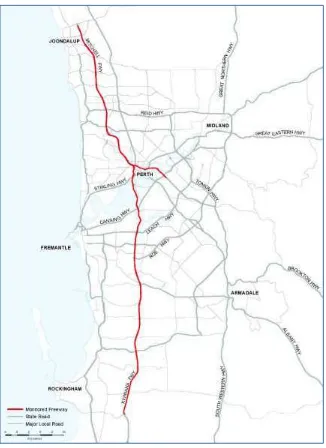
Main Roads collects considerable data from across the road network for separate reasons, in different forms, using different measures, although most does not relate to congestion. In part, this is expected, given that congestion has only recently appeared as a significant management issue. Currently, detailed performance information is available for just 78.5 km of the Mitchell/Kwinana/Graham Farmer freeway system (Figure 6).
Source: Main Roads and OAG
Having consistent, real time information is key to optimising network performance and informing strategic and operational decision-making. Without this information, there is a heavy reliance on traffic modelling to predict future demand and network capacity constraints, and a risk that major transport decisions will not address traffic congestion effectively. It is also very difficult to demonstrate that projects to improve congestion provide the best use of resources. While consistent and comprehensive information is the goal, we acknowledge that creating this information is a challenge. However, evaluating performance across the whole network would let Main Roads:
measure if the road network is operating as planned and designed
calibrate traffic models
benchmark performance against agreed service performance levels
target network improvement
inform strategic decision-making
provide better traveller information
establish priorities, and assess effectiveness and cost-benefits for operations and network expansion.
Seven uncoordinated systems collect data for different
operational and planning purposes across the agency
Main Roads uses seven data collection systems for different operational and planning purposes across the agency. The systems measure different traffic metrics across different parts of the road network and are managed by different divisions. However, only data from the Vehicle Detection System (VDS) is used to monitor traffic congestion and is regularly reported to Main Roads executive.
Two directorates within Main Roads manage the seven systems:
Road Network Services use:
o VDS to measure real time network performance and provide planning information.
There are 1 600 sensors at 140 points on the freeways system collecting real-time data
o community perception surveys and customer complaint information to measure
performance and inform the management of traffic congestion
o the Traffic Operations Centre (TOC) to monitor and manage operations of the Perth
metropolitan road network. TOC is the central point for real-time traffic information across the State. It uses intelligent transport system devices such as variable message signs and closed circuit television cameras (CCTV) to ensure the efficiency of the road network during peak commuter travel times, special events and unplanned incidents, including 273 CCTV cameras and 65 cameras in the Northbridge Tunnel. It also uses the Sydney Coordinated Adaptive Traffic System (SCATS) to manage all 955 traffic signals across the State (885 in metropolitan Perth). SCATS is used operationally to control traffic signals and improve traffic flow and hence resolve congestion issues. It is not used for monitoring and reporting congestion over time
o Tom Tom Global Positioning System (GPS) to monitor travel times and speed, since
Planning and Technical Services uses:
o its new ROM24 system to generate traffic flow predictions and to estimate future traffic
congestion
o ‘stop watch tests’ (known as Floating Car Surveys) to measure regular travel time
information along 11 routes in the metropolitan area. This is reported to Austroads which publicly reports on the information annually
o fixed and temporary road counters are also used to count the number of cars across
points in the network. This provides an indication of increased demand on the network. Traffic volumes and speeds from VDS are used to report traffic congestion to Main Roads Corporate Executive every three months. The information is also sent to Austroads. Four National Performance Indicators (NPIs) are reported (travel speed, efficiency, reliability and productivity). However, this information is limited to 78.5km of the Graham Farmer, Kwinana and Mitchell freeways (Figure 6) and focuses exclusively on the daily commute into and out of the CBD. No congestion information is reported for the rest of the road network, or for high value transport modes like buses and freight vehicles. We note that Austroads has not publicly reported on NPIs since 2009.
Main Roads believes that most of Perth’s traffic congestion is recurring rather than incident based and occurs when vehicle use exceeds available road capacity. In particular, the freeway system that runs more than 100km from Joondalup in the north, through the CBD and south to Mandurah, experiences congested conditions daily during the morning and evening peak times. Significant delays occur along vital routes including primary freight routes, high frequency bus routes and control-of-access highways. Perth’s roads are generally free flowing outside peak hours.
In 2011, Main Roads estimated that 17 per cent of freeway congestion results from crashes, but congestion itself is one of many contributing factors. The Perth figure is on the lower end of international experience. Main Roads plans to analyse this data in 2015-16.
Main Roads does not use the data it has to its full potential or analyse data to provide meaningful consideration of trends and performance. It does not consistently measure or report the volume of cars and freight vehicles on the whole network (this can be measured as
‘vehicle-kilometres’ travelled), vehicle occupancy levels or the percentage of recurrent and non-recurrent congestion. We expected this information to be readily available and reported. Main Roads and DoT are working to define a performance metric (or suite of metrics) for congestion. Once these are agreed, and a baseline established, targets can be set and performance monitored and reported to DoT and Parliament. Determining what should be achieved will enable Main Roads to measure reliability, which is widely considered one of the key measures of success in managing traffic congestion.
Main Roads has mitigated traffic congestion on parts
of the road network and within the CBD
Main Roads’ congestion projects vary in scale and type
Main Roads has delivered a number of construction projects and operational improvements that have specifically addressed traffic congestion. The projects included: building additional road capacity:
o a third traffic lane in both directions through the Graham Farmer Freeway Tunnel o an extra lane to the Mitchell Freeway northbound, from the Tunnel to Hutton Street o a third lane to the Mitchell Freeway northbound between Hepburn Avenue and Hodges
Drive
o additional lanes on the Kwinana Freeway southbound from Leach Highway to Roe
Highway
providing improved traffic management capability in and around the CBD; the Active Traffic Management initiative, the Incident Response Service to assist broken down vehicles and the Towing Contract to remove vehicles illegally parked in clearways
coordinating road works in and around the CBD
traffic metering signals on the Point Lewis roundabout (Mounts Bay Road and Narrows Bridge interchange) to manage congestion in peak hours
optimising the performance of traffic signals along sections of Canning Highway.
Main Roads is progressing a number of other initiatives under its Traffic Congestion Management Strategy (Appendix 2), which it developed in 2013. These projects cover many areas, from phone apps for road users to adding road capacity.
Projects were delivered under budget, within reasonable
timeframes and had the desired local impact
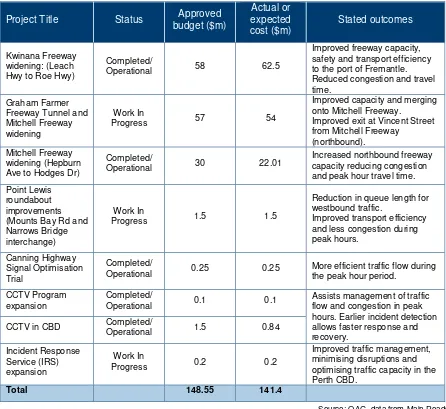
We looked at eight projects that Main Roads had identified as specifically addressing congestion. Five of these were included in the Traffic Congestion Management Strategy. The
other three were ‘badged’ as congestion projects (Table 3), but did not form part of the strategy. Overall, the eight projects were mostly completed or are expected to be completed on or under budget and delivered close to the expected timeframes, although we note that the Kwinana Freeway widening took nearly six months longer than expected to complete. This was because additional work pushed the project into winter, which slowed road works. Despite a general lack of post project evaluation, we were able to verify that completed projects had their desired impact of reducing congestion on parts of the local network and within the CBD. The eight projects included infrastructure projects and initiatives to improve the efficiency of the existing road network.
provided funding for the other projects. Fund money can only be spent on activities affecting the City of Perth.
Project Title Status Approved
budget ($m)
Operational 0.25 0.25 More efficient traffic flow during the peak hour period.
CCTV Program
Source: OAG, data from Main Roads
Table 3: Sampled Traffic Congestion Management Strategy projects
All the projects had a business case, and all infrastructure projects included a benefit cost analysis and predicted return on investment. Linking project business cases to traffic congestion management objectives and priorities will help to demonstrate value for money and provide assurance that resources are directed to areas of greatest need.
Capacity to manage traffic congestion is growing
Main Roads is changing its focus from road building to
network managing
Main Roads is currently undertaking a major review of its organisational capacity to manage traffic congestion and is working with DoT to implement a more integrated transport strategy and planning framework.
It has developed a four-point plan to change its approach to managing its network, including dealing with congestion. The main points are to:
get the right people in place
measure performance and set targets
optimise the performance of the arterial and freeway networks
select the right projects.
While this program of action is in its early phase, Main Roads has made significant progress already. The expected changes should allow Main Roads to more successfully manage congestion as part of its many priorities and responsibilities.
Main Roads has already appointed new senior staff to newly created roles to shape its transition. It has appointed a new Director Network Operations who was previously responsible for network performance in London. A Congestion Programme Director has been recruited specifically to develop a dedicated funding stream for a five-year congestion program.
Main Roads aims to better measure network performance and set operational targets, develop information technology systems and upskill staff. A Capability Development and Change Manager, appointed in late 2014, will oversee this. In practice, it plans to deliver this by splitting its service into three metropolitan areas (North, South and CBD) and establish Corridor Performance Managers within those regions. These managers will be supported by:
an expanded signal timing review program and optimisation capability development
the new STREAMS system which is set to go live in mid-2015
an operational modelling and traffic analysis centre for cause-effect analysis, performance reporting and optimisation support. This would allow current performance to be reported more often, both against predetermined targets for each corridor, regions, and the whole network
a common operating picture across the business through spatial and temporal geographic information system based tools.
When Main Roads completes these changes, its organisational capacity will be more consistent with what is regarded in other jurisdictions as better practice.
New
data
collection
and
analysis
will
improve
understanding
As part of this review, Main Roads is assessing the benefits and possibilities of accessing more GPS information, enhancing its VDS system, and the role of surveys and other manual systems. It is also reviewing options for other types of information collection, such as automatic number plate recognition technology or Bluetooth collection of mobile device GPS data. However, these may need legislative change.
In 2014-15, Main Roads made an unsuccessful budget submission for $56 million to build on the VDS system to introduce a managed freeway approach. It plans to apply again for funding in 2015-16.
The new change management plan has set a mid-2015 date for determining overall congestion performance measures – trip reliability being the leading contender. It also expects to deliver monthly performance reporting to senior management.
There is a three-year plan to review and update the use of SCATS data across the metropolitan area, towards integrating and optimising the impact of these signals. The 2014-15 plan involves assessing 93 sets of signals, increasing to 400 by 2016-17. Main Roads also has plans for more road capacity increases on the freeway network, as well as new approaches to traffic management.
Main Roads has acknowledged the need to improve how it coordinates its assessment and prioritisation of projects. While it will continue to check return on investment for projects, it will also need to assess wider impacts on corridor and network performance. This will increase the information provided to other stakeholders in the transport area.
Appendix 2: Main Roads’
Congestion Management
Auditor General
’s Reports
Report
Number Reports 2015 Date Tabled
1 Regulation of Real Estate and Settlement Agents 18 February 2015
Report
Number Reports 2014 Date Tabled
22 Opinion on Ministerial Notification 18 December 2014
21 Training and Support for Justices of the Peace 26 November 2014
20 Ensuring Compliance with Conditions on Mining – Follow-up 19 November 2014 19 Purchasing Through Common Use Agreements - AGBA 12 November 2014
18 Audit Results Report – Annual 2013-14 Financial Audits 12 November 2014
17 Opinions on Ministerial Notifications 25 September 2014
16 Our Heritage and Our Future: Health of the Swan Canning River System
13 August 2014
15 Working with Children Checks 30 June 2014
14 Information Systems Audit Report 30 June 2014
13 Royalties for Regions – are benefits being realised? 25 June 2014
12 Government Funded Advertising 25 June 2014
11 Licensing and Regulation of Psychiatric Hostels 25 June 2014
10 Universal Child Health Checks Follow-Up 18 June 2014
9 Governance of Public Sector Boards 18 June 2014
8 Moving On: The Transition of Year 7 to Secondary School 14 May 2014
7 The Implementation and Initial Outcomes of the Suicide Prevention Strategy
7 May 2014
6 Audit Results Report – Annual 2013 Assurance Audits (Universities and state training providers – Other audits completed since 1 November 2013)
7 May 2014
5 Across Government Benchmarking Audits – Controls Over Purchasing Cards – Debtor Management – Timely Payment of Invoices
1 April 2014
4 Behaviour Management in Schools 19 March 2014
3 Opinion on ministerial decision not to provide information to Parliament about funding for some tourism events
18 March 2014
2 Charging Card Administration Fees 12 March 2014
Office of the Auditor General
Western Australia
7th Floor Albert Facey House 469 Wellington Street, Perth
Mail to:
Perth BC, PO Box 8489 PERTH WA 6849
T: 08 6557 7500 F: 08 6557 7600
E: [email protected] W: www.audit.wa.gov.au
Follow us on Twitter @OAG_WA