Full Terms & Conditions of access and use can be found at
http://www.tandfonline.com/action/journalInformation?journalCode=cbie20
Bulletin of Indonesian Economic Studies
ISSN: 0007-4918 (Print) 1472-7234 (Online) Journal homepage: http://www.tandfonline.com/loi/cbie20
The Impact of the Crisis on Internal Population
Movement in Indonesia
Graeme Hugo
To cite this article:
Graeme Hugo (2000) The Impact of the Crisis on Internal Population
Movement in Indonesia, Bulletin of Indonesian Economic Studies, 36:2, 115-138, DOI:
10.1080/00074910012331338913
To link to this article:
http://dx.doi.org/10.1080/00074910012331338913
Published online: 18 Aug 2006.
Submit your article to this journal
Article views: 186
View related articles
THE IMPACT OF THE CRISIS ON INTERNAL
POPULATION MOVEMENT IN INDONESIA
Graeme Hugo
University of Adelaide
One of the ways in which Indonesians have adapted to economic change over recent decades is through permanent and temporary movement within and outside the country. This paper focuses on the effects which the crisis that started in 1997 has had upon population mobility among different groups and in different areas within the country. It begins by summarising the employment effects of the crisis, as indicated by the 1997 and 1998 National Labour Force Surveys. It then uses results from a number of surveys to identify the changes that have occurred in population mobility in Indonesia during the crisis. In particular it looks at the extent and nature of urban to rural movement, and at patterns of movement between Java and the Outer Islands. Although comprehensive data are lacking, it is argued that population mobility has become an important coping mechanism for confronting the crisis.
INTRODUCTION
positive one. The present paper focuses on the effects of the crisis on internal migration; its influence on international migration is discussed in a companion paper (Hugo 1999a).
There were significant problems in measuring internal population mobility in Indonesia even in pre-crisis times (Hugo 1982), but there is even less information available about the post-crisis situation, because no census or other major data collection involving migration has been carried out. The major sources employed here to investigate changes in internal mobility are:
• a 1998 study of 42 villages in 7 kabupaten covering 1,662 migrant households (Gantjang et al. 1999) initiated by the United Nations Development Programme;
• the first round of a central bureau of statistics (BPS) 100 village study reported on elsewhere in this paper (Urip 1998);
• a number of case studies of the impact of the crisis in villages (e.g. Breman 1998, Romdiati et al. 1998);
• the Indonesian Family Life Survey (IFLS) undertaken by the University of Indonesia, the Rand Corporation and the University of California, Los Angeles; this involved a baseline survey of 7,000 households in 13 provinces in 1993, and two follow-ups in August 1997 – February 1998 and August–December 1998 (Frankenberg, Thomas and Beegle 1999; Frankenberg, Beegle, Thomas and Suriastini 1999);
• interviews with key respondents, field visits to villages affected by the crisis in Java and discussions with government officials and international agencies with field experience of the effects of the crisis. One of the most distinctive features of Indonesia’s krismon (monetary crisis) is the ‘patchy’ nature of its impact. A great deal of debate about the effect of the crisis has been influenced by the fact that parts of Indonesia appear to have been little affected by it. In particular, areas of the Outer Islands dependent upon cash crops or resource extraction activities have been less subject than Java to the decline in domestic demand, and continue to export to world markets. Similarly, agricultural landowners in Java, especially those who did not suffer from El Niño-induced droughts in 1997, may not have had their incomes reduced by the crisis.
however. Before the crisis, more than a quarter of rural householders in Java were dependent at least in part on income earned in urban areas by circulating family members, or on remittances from urban-based relatives. This reliance on urban-origin funds was heaviest among landless rural households and those with very small landholdings. Accordingly, a crisis influencing urban-based employment will have a substantial impact in rural Java, and it is clear that the crisis has hit many parts of rural Java in a substantial way.
The last three decades have seen a massive increase in population mobility. Internal migration data collected in censuses capture only a part of this mobility, since they do not detect movement within Indonesia’s provinces, and detect only long-term and permanent movement (Hugo 1982). The proportion of Indonesian males who had ever lived in another province increased from 6.3 to 11.2% between 1971 and 1995 and that for females from 5.1 to 10.0% (Hugo 1999b). The literature on internal migration in Indonesia in the pre-crisis period is unanimous in stressing the significance of employment trends in shaping population movement patterns (e.g. Spaan 1999; Hugo 1978; Mantra 1981). Hence, since one of the most distinctive features of the financial crisis in Indonesia is its patchy impact, it is likely that a key response to regional and local losses of employment will be substantial movements of people away from areas that are hard hit to areas where there is some opportunity to gain employment on a permanent or temporary basis.
In the present paper the limited information available is analysed to investigate the extent to which internal migration is being employed as a strategy to cope with the effects of the crisis. We begin by summarising some of the employment effects of the crisis that have impinged upon population movement.
EMPLOYMENT EFFECTS OF THE CRISIS
Teruel 1999; Sumarto, Wetterberg and Pritchett 1999; Silvey 1998). However, the crisis has also impacted upon rural areas for a number of reasons.
First, a high proportion of rural-based households have over several decades relied for a significant part of their income on remittances from urban-based relatives or on off-farm work carried out by family members, often in rural areas. Hence, the effect of loss of jobs and loss of purchasing power in urban areas will immediately flow through to the rural sector, directly through a fall in remittances to households, and indirectly through the consequent reduction in spending in rural areas.
Second, it is true that to some extent land-rich households have been protected from the effects of the crisis through the increase in food prices and through buoyant markets for cash crops such as cocoa and cloves. However, land-rich families make up a minority of the population working in rural areas. The 1995 Intercensal Population Survey (Supas) indicates that before the crisis, 28% of Indonesia’s rural households were landless (53% in West Java!), and the 1993 Agricultural Census showed a further 5% owned less than 0.1 ha of land (Ahmed 1999). In West Java, the largest province by population, 64% of rural households are landless or land poor. Hence, a substantial part of the nation’s rural population
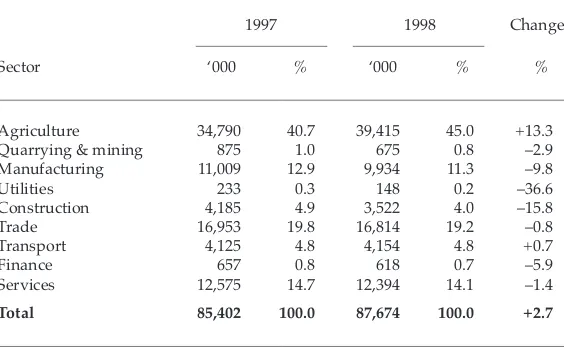
TABLE 1 Employment ofPersons Aged 15 Years and Over by Sector, 1997–98
1997 1998 Change
Sector ‘000 % ‘000 % %
Agriculture 34,790 40.7 39,415 45.0 +13.3 Quarrying & mining 875 1.0 675 0.8 –2.9 Manufacturing 11,009 12.9 9,934 11.3 –9.8 Utilities 233 0.3 148 0.2 –36.6 Construction 4,185 4.9 3,522 4.0 –15.8 Trade 16,953 19.8 16,814 19.2 –0.8 Transport 4,125 4.8 4,154 4.8 +0.7
Finance 657 0.8 618 0.7 –5.9
Services 12,575 14.7 12,394 14.1 –1.4
Total 85,402 100.0 87,674 100.0 +2.7
cannot take advantage of higher prices for agricultural products and indeed is disadvantaged by higher food prices and increased competition for work in the village.
Third, the El Niño drought in 1997–98 affected many rural areas, and it is not clear that all areas and households affected have fully recovered from this.
Accordingly, it is clear that the effect of the crisis has been felt in both rural and urban areas. Ahmed (1999: 12–13) has assembled evidence to support the contention that overall urban–rural differences in the impact of the crisis are not great, while Islam (1999) shows that crisis effects vary considerably in the Outer Islands.
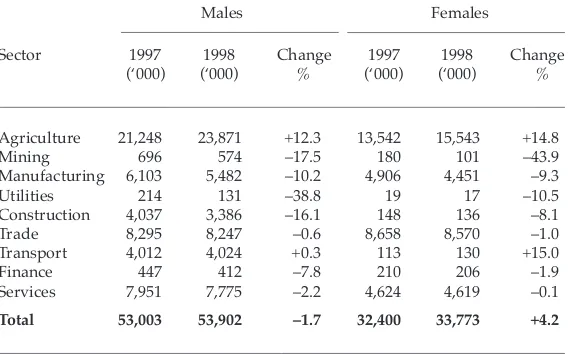
Agriculture has absorbed a substantial proportion of workers displaced by the crisis, and on the surface this would suggest that there has been a redistribution of workers from urban to rural areas. Table 1 compares the results of the 1997 and 1998 National Labour Force Surveys (Sakernas) and indicates that while the overall number of Indonesians employed increased by 2.7% over this period, there was a decline in the number working in all industries except agriculture and transport, with only a minor increase in the latter.
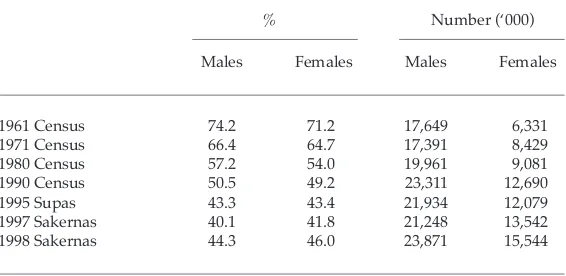
With agriculture absorbing the bulk of labour displaced from other sectors, as well as new entrants to the labour force, we see a significant reversal of the pre-crisis pattern in which a falling share of the workforce was employed in agriculture. Table 2 shows that the proportion of male workers in agriculture fell from 74.2% in 1961 to 40.1% in 1997, but rose
TABLE 2 Proportion of Workforce Employed in Agriculture, 1961–98
% Number (‘000)
Males Females Males Females
during the crisis to 44.3%. In absolute terms, the number of males employed in agriculture declined to 21.3 million in 1997 from 23.3 million in 1990, but increased to 23.9 million in 1998.
Agriculture was the main absorber of labour until recent times. Geertz (1963) coined the term ‘agricultural involution’ for the distinctive characteristic of sawah (wet rice) agriculture in Java, which allowed population increases to be absorbed because:
• increased labour resulted in increased productivity of sawah through activities such as transplanting, micro control of irrigation and weeding; and
• there was an associated culture of ‘shared poverty’ whereby the systems used in sawah were open to all to participate in and were highly labour intensive.
With increased commercialisation of agriculture the latter aspect began to break down, and a large share of the workforce came to be involved in non-agricultural activity. The early 1990s saw the absolute decline in numbers employed in agriculture already noted. The crisis has seen a return to exploitation of this involutionary/absorptive capacity of agriculture, but the question remains whether, given the new commercialised ways in which it is organised, agriculture can absorb large numbers of workers on a permanent basis if the crisis continues over a long period.
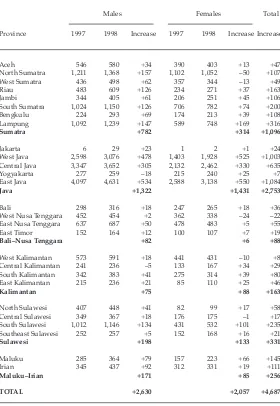
TABLE 3 Change in Agricultural Employment by Province, 1997–98 (‘000)
Males Females Total
Province 1997 1998 Increase 1997 1998 Increase Increase
Aceh 546 580 +34 390 403 +13 +47
North Sumatra 1,211 1,368 +157 1,102 1,052 –50 +107 West Sumatra 436 498 +62 357 344 –13 +49
Riau 483 609 +126 234 271 +37 +163
Jambi 344 405 +61 206 251 +45 +106
South Sumatra 1,024 1,150 +126 706 782 +74 +200
Bengkulu 224 293 +69 174 213 +39 +108
Lampung 1,092 1,239 +147 589 748 +169 +316
Sumatra +782 +314 +1,096
Jakarta 6 29 +23 1 2 +1 +24
West Java 2,598 3,076 +478 1,403 1,928 +525 +1,003 Central Java 3,347 3,652 +305 2,132 2,462 +330 +635
Yogyakarta 277 259 –18 215 240 +25 +7
East Java 4,097 4,631 +534 2,588 3,138 +550 +1,084
Java +1,322 +1,431 +2,753
Bali 298 316 +18 247 265 +18 +36
West Nusa Tenggara 452 454 +2 362 338 –24 –22 East Nusa Tenggara 637 687 +50 478 483 +5 +55
East Timor 152 164 +12 100 107 +7 +19
Bali–Nusa Tenggara +82 +6 +88
West Kalimantan 573 591 +18 441 431 –10 +8 Central Kalimantan 241 236 –5 133 167 +34 +29 South Kalimantan 342 383 +41 275 314 +39 +80 East Kalimantan 215 236 +21 85 110 +25 +46
Kalimantan +75 +88 +163
North Sulawesi 407 448 +41 82 99 +17 +58 Central Sulawesi 349 367 +18 176 175 –1 +17 South Sulawesi 1,012 1,146 +134 431 532 +101 +235 Southeast Sulawesi 252 257 +5 152 168 +16 +21
Sulawesi +198 +133 +331
Maluku 285 364 +79 157 223 +66 +145
Irian 345 437 +92 312 331 +19 +111
Maluku–Irian +171 +85 +256
TOTAL +2,630 +2,057 +4,687
One aspect of the increase in agricultural employment between 1997 and 1998 is that the number of agricultural workers living in urban areas rose by 45%, while the increase in rural areas was 11%. This meant an increment of 1.0 million in urban areas and of 3.6 million in rural areas. It is apparent that temporary movement is involved. On the one hand, in rural areas the increment includes new entrants to the labour force, returnees from urban areas and workers displaced from other sectors in rural areas. Among urban residents employed in agriculture, many in fact work in agriculture in rural areas through circular migration, while others farm the many empty lands in and near major urban areas.
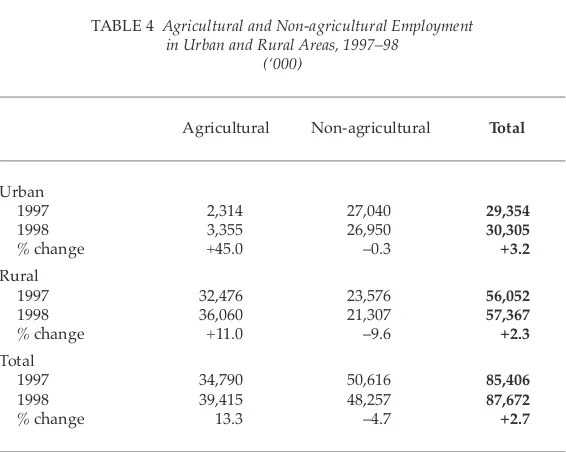
Table 4 shows that in urban areas there was a net loss of 90,000 jobs from the non-agricultural sector between 1997 and 1998. This relatively small decline reflected the fact that most of the net loss of 1.4 million displaced by the crisis from the formal sector were able to gain some employment in the urban informal sector. Geertz (1963) has shown that the urban informal sector shares many of the involutionary characteristics of the sawah system.
TABLE 4 Agricultural and Non-agricultural Employment in Urban and Rural Areas, 1997–98
(‘000)
Agricultural Non-agricultural Total
Urban
1997 2,314 27,040 29,354
1998 3,355 26,950 30,305
% change +45.0 –0.3 +3.2
Rural
1997 32,476 23,576 56,052
1998 36,060 21,307 57,367
% change +11.0 –9.6 +2.3
Total
1997 34,790 50,616 85,406
1998 39,415 48,257 87,672
% change 13.3 –4.7 +2.7
The decline in non-agricultural employment in the rural sector was much more substantial, with a net loss of 2.3 million jobs. The crisis greatly reduced the flow of cash into rural areas, as remittances from urban-based relatives fell and off-farm work opportunities for village-urban-based landless people, many of which had been based in urban areas, declined. As a result, demand for services such as small-scale selling and house improvement dried up in villages. The resulting loss of non-agricultural jobs was made up by a net gain of 3.6 million jobs in agriculture in the rural sector. The agricultural sector absorbed not only displaced workers from the non-agricultural sector in rural areas, but also new entrants to the labour force and returnees from urban areas.
The absorptive capacity of the agricultural sector has historically been substantial, and it would appear that, while some of the rise in numbers of agricultural workers in the Outer Islands is due to expansion of cash crops, much of the increase in Java has been involutionary. The question remains how far agriculture—especially in Java—can reverse the trend
TABLE 5 Changes in Employment by Industry, 1997–98 (‘000)
Males Females
Sector 1997 1998 Change 1997 1998 Change (‘000) (‘000) % (‘000) (‘000) %
Agriculture 21,248 23,871 +12.3 13,542 15,543 +14.8 Mining 696 574 –17.5 180 101 –43.9 Manufacturing 6,103 5,482 –10.2 4,906 4,451 –9.3 Utilities 214 131 –38.8 19 17 –10.5 Construction 4,037 3,386 –16.1 148 136 –8.1 Trade 8,295 8,247 –0.6 8,658 8,570 –1.0 Transport 4,012 4,024 +0.3 113 130 +15.0 Finance 447 412 –7.8 210 206 –1.9 Services 7,951 7,775 –2.2 4,624 4,619 –0.1
Total 53,003 53,902 –1.7 32,400 33,773 +4.2
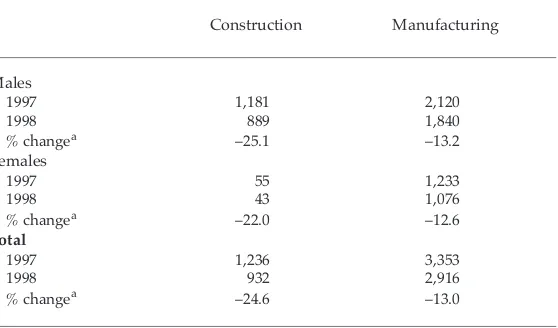
of recent decades towards increasing productivity per worker and displacement of labour, and restore the former pattern of absorbing the bulk of the increment in new workers, albeit at a low level of productivity. Table 5 examines the gender patterns of crisis period employment changes by sector. It shows that female employment increased faster than male employment in 1997–98, suggesting that women became more involved in the workforce outside the home as a response to the crisis. The bulk of the net increase in female participation was in the agricultural sector. In considering the migration implications of table 5, it is important to note the areas where most labour displacement has occurred. There were major job losses in manufacturing (621,000 males and 455,000 females), construction (650,800 males and 12,400 females) and services (176,050 males and 4,600 females). It is worth considering further the losses for men and women in manufacturing and for men in construction. Table 6 shows that almost half a million jobs in manufacturing (436,600) were lost in Jakarta–West Java alone. Losses were equally severe among men and women. Women losing jobs in this sector were mainly recent migrants from West and Central Java, relatively well educated and from middle income families in rural areas (Sunaryanto 1998). It is
TABLE 6 Jakarta–West Java: Changes in Employment by Industry, 1997–98 (‘000)
Construction Manufacturing
Males
1997 1,181 2,120
1998 889 1,840
% changea –25.1 –13.2
Females
1997 55 1,233
1998 43 1,076
% changea –22.0 –12.6
Total
1997 1,236 3,353
1998 932 2,916
% changea –24.6 –13.0
aPercentage change is calculated for unrounded data.
uncertain what proportion of these women have returned to their villages and how many have remained in the hope of getting another job, perhaps receiving support from rural-based families. Certainly, pre-crisis studies indicated that these women were not attracted to pursuing gainful occupations in the village; indeed, this prospect was an important factor pushing this group out (Sunaryanto 1998). In Bekasi, where many of the manufacturing activities, especially those employing women, were located, unemployment rose from 6.7 to 13.6% between 1997 and 1998 (Depnaker and BPS 1999: 201). This suggests that there certainly was some movement of displaced manufacturing workers out of Bekasi, but that the majority have stayed (the workforce in Bekasi increased from 1.1 million in 1997 to 1.3 million in 1998) and taken up other work or remained unemployed. The decline in construction employment in Jakarta–West Java between 1997 and 1998 was even more severe (table 6). Among men a quarter of such jobs were lost, and this undoubtedly led to significant return migration from urban areas in the two provinces.
Movement into agriculture was an important strategy adopted in the face of the net overall loss of more than 2.4 million non-agricultural jobs between 1997 and 1998. It is clear that population mobility has played a significant role in this, through people moving permanently or circulating between urban and rural areas.
TABLE 7 Change in Work Status of Labour Force, 1997–98
Rural Urban Total
Change 1997 1998 Change 1997 1998 Change (‘000) (‘000) (%) (‘000) (‘000) (%) (‘000)
Informal sector 41,104 43,489 +5.8 12,557 13,852 +10.3 +3,680 Self-employed 13,103 13,058 –0.3 6,762 7,465 +10.4 +659 Self-employed,
assisted by family/
day labourers 14,575 16,034 +10.0 3,407 3,656 +7.3 +1,703 Not paid 13,426 14,396 +7.2 2,388 2,732 +14.4 +1,214 Formal sector 14,948 13,879 –7.1 16,797 16,452 –2.2 –1,413 Employer 782 804 +2.7 684 722 +5.5 +59 Employed 14,165 13,075 –7.7 16,112 15,730 –2.4 –1,470
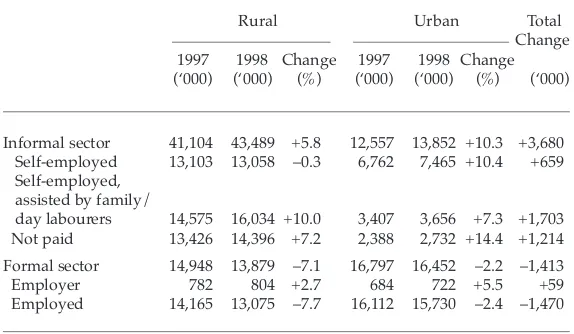
There is some debate about the extent to which there has been a flow of workers from the formal into the informal sector during the crisis. Table 7 shows, using a somewhat unsatisfactory definition of the informal sector,1 that there was a net gain of 3.7 million informal sector jobs
between 1997 and 1998 (2.4 million in rural areas and 1.3 million in urban areas) and a net loss of 1.4 million formal sector jobs.
URBAN AND RURAL MIGRATION AND THE CRISIS
It is apparent from the above that there have been substantial shifts in type of employment as a result of the crisis, the net effects of which are to some extent apparent in the 1997 and 1998 Sakernas results. These changes are not easy to document given the lack of detailed data, but there is evidence of population movement being associated with many of them. Population mobility levels have increased over the last three decades (Hugo 1997). Moreover, there is an established history of Indonesians adopting a range of mobility strategies to adjust to changes in the labour market (Hugo 1978, 1981); in particular, pressure on limited jobs in rural Java has led many to move on a temporary or permanent basis to take advantage of off-farm job opportunities (Hugo 1978; Mantra 1981; Spaan 1999). During the crisis a variety of strategies have been implemented, including temporary and permanent moves, to adapt to the changed labour market conditions outlined above.
In the early days of the crisis, much was made of the potential for displaced workers in the major urban areas of Java to return to their home areas in the rural hinterland to obtain work and support from their communities of origin. However, there are several reasons why this option was not available or not acceptable to a substantial proportion of the Indonesian urban population.
Much of the thinking that the village can act as a ‘safety net’ for displaced urban workers is based upon the ideas Geertz (1963) developed in Agricultural Involution. He argued that greater wage flexibility in rural areas allows displaced labour to be more readily absorbed than in the modern urban sector. However, since Geertz did his work, rural Indonesia (especially rural Java) and sawah have been transformed as a result of the Green Revolution, the commercialisation of rice production and the proletarianisation of the rural workforce (i.e. its transformation from subsistence to wage labour). Adoption of new technologies and agricultural practices has allowed a reduction in the number of workers in agriculture, despite a substantial increase in production (i.e. the reverse of Geertz’s involution concept). Social organisation has been transformed so that traditional arrangements for harvesting and other agricultural work have largely been replaced by more commercially-based labour hiring systems.
Thus, the capacity of sawah to absorb large numbers of returning urban workers, as posited in the Agricultural Involution thesis, has become increasingly limited. At the same time, the rapid growth of manufacturing and other urban employment opportunities has tended to pull people out of agriculture.
Second, discussions with urban displaced workers suggest that although their options were limited they preferred to remain in the city rather than return to their village homes. Many had come to the city precisely because they did not want to work in agriculture. The education system tends to orient children away from agriculture, so that those who gain secondary school qualifications generally do not want to work on farms. Sunaryanto (1998) reports that young women gaining work in factories in and around Jakarta gave as a reason for migrating their desire to get away from having to take up an agricultural job.
Many urban residents have capital assets in the city which make it difficult for them to pack up and return to the village. Furthermore, migrants who have become used to urban levels of service provision may be unwilling to go back to situations where services such as schooling and health are of a lower standard than those they have been using in the city.
went back to their village of origin during Idul Fitri (the post-fasting celebration), an extra 300,000 new migrants would be coming back with them (JP, 7/2/98). For a short time the government of Jakarta met buses and sent back migrants who lacked Jakarta identification cards. In January, 627 were rounded up and returned (JP, 7/2/98).
Breman (1998) found that the social networks in the village are not as strong as assumed by urban-based decision makers, and that many who go back do not have land or strong links with land owners. He argues that the safety net has been lost to urban migrants, and that the government has chosen to accept two convenient notions that his village work indicates now have little credence: that the safety net of the village is intact for urban migrants; and that urban centres continue to be anchored in rural society.
The 1999 Kecamatan Rapid Poverty Assessment survey interviewed three government officials in each of Indonesia’s 4,025 kecamatan about migration and its impact. This study (Sumarto, Wetterberg and Pritchett 1999: 18) found that:
• both urban and rural kecamatan officials reported a greater than normal inflow of males returning because they had lost jobs elsewhere; • there was a smaller increase in the number of women returning; this
may indicate that often the male household head returns to the village for work but leaves his family in the city;
• less out-migration was reported than in the previous year.
Other smaller-scale studies also support the finding of increased return migration. UNSFIR (1999: 65) reports the suggestion that there are villages where the population has recently expanded by up to one-third because of return migration. The Seven Kabupaten Study (Gantjang
et al. 1999) also points to the significance of return migration, as do several village studies (e.g. Romdiati, Handayani and Rahayu 1998; Breman 1998). Clearly much of this return migration is being absorbed in the agricultural sector. In the Outer Islands, Silvey’s (1998 and forthcoming) study in Ujung Pandang indicates a substantial flow of men and women back to their village of origin in response to the crisis.
A report of a seminar on the impact of the crisis on village development in Java (Sandee 1999: 142) indicated that there were:
evidence of migrants who failed to integrate and, consequently, had gone back to the cities. Most contributors stressed, however, that the majority of migrants remain in the cities, although the crisis is likely to have had a negative impact on the amount of their remittances.
In sum, there is no clear picture yet of the extent of permanent redistribution of population in Java from urban to rural areas. The results of the 1997 and 1998 Sakernas show that over the 1997–98 period the urban population aged 15+ grew by 51.3%, while the rural population grew by only 0.9%, but several field studies (e.g. Gantjang et al. 1999) indicate that some movement to rural areas has occurred. The real extent of urban to rural redistribution of population as a result of the crisis will become clearer when the year 2000 census results are published.
CHARACTERISTICS OF MIGRATION BETWEEN URBAN AND RURAL AREAS
Notwithstanding the substantial amount of survey evidence of migrants returning to their village of origin, it is clear that its incidence varies from place to place. One area where this was significant was among former construction workers in cities like Jakarta. Most of these workers were not permanent urban residents of Jakarta in any case, and with the drying up of construction activity many have returned home. In pre-crisis times in the mornings one could see day labourers lining the streets at several locations waiting to be picked up by a mandor (labour organiser) to work on construction sites. These streets were empty in early 1999.
A study in Indramayu (West Java), in a village that had previously sent out large numbers of construction workers (Romdiati, Handayani and Rahayu 1998), found that the crisis had a significant impact. The village had provided 90% of the labour for some construction companies in Bekasi, but with the onset of the crisis all had to return to the village, with the result that 580 (320 men and 260 women) of the total village population aged 10 and above (3,162 persons) were unemployed. The impact of their return to the village was exacerbated by the fact that the village had suffered crop losses as a result of El Niño. Many in the village went to Saudi Arabia to work as a strategy for dealing with the crisis.
Rather than permanently returning to their villages of origin, many urban dwellers who are first generation migrants are instead circulating
was observed whereby many rural-based families in Java had at least one family member who, while domiciled in the village, regularly moved on a temporary basis to Jakarta to work, often in the informal sector, and in construction (Hugo 1978; Mantra 1981; Spaan 1999). This diversified the family’s portfolio of income sources and thus reduced the risk of income loss. While many moved permanently to the city, many others kept their families in the village and circulated between city and village as a response to the shortage of income opportunities in the latter. In the Seven Kabupaten Study of migration effects mentioned above, this type of circular movement was the most common form of migration identified. To some extent, what appears to be happening now is the reverse: urban dwellers who are first generation migrants and have lost their formal sector jobs, or are finding it difficult to make ends meet from their informal sector employment, are now circulating from their urban bases back to their villages to obtain what work they can there. This is especially the case in times of peak labour demand such as harvesting. However, they still also keep their urban informal sector jobs. This pattern is reflected in the earlier comparison of 1997 and 1998 Sakernas data, which indicated that the number of urban-based employees in agriculture had increased. It reflects only the tip of this ‘iceberg’, since it captures only those who have gone back to the village to work in the period before the survey. In fact, it is clear that there is much ‘toing and froing’ between city and village. Hence, some urban-based informal sector workers in the 1990s are employing a survival strategy similar to that used by rural-based workers in the 1970s and 1980s.
Less than 5% of the circular migrants indicated that the crisis had influenced them in stopping their migration. Indeed, field evidence suggests there is a great deal of movement between rural areas as people take advantage of job opportunities across a wide area. Some 48.5% of those returnees giving the crisis as their reason for return were heads of household, so it is clear that many of their accompanying dependants gave other reasons for returning to the village.
It was notable that circular migration was most evident in the two study areas in West Java and Central Java, nearest to Jakarta. These are the provinces in which this pattern of movement is best established (Hugo 1978). Indeed, in these two areas 22% of all adults in the surveyed households were circular migrants, working mainly in Jakarta’s industrial and construction sectors. Return migrants are especially numerous in the East Java and Lombok villages, where returns made up 17% and 21%, respectively, of the people interviewed. This reflects the significance in these two areas of migrants returning from overseas destinations (especially Malaysia and the Middle East). The two main Outer Island study areas of Bone and Banjar had large proportions of villagers who were recent migrants, reflecting the fact that, in many Outer Island areas like Bone, the crisis years have been boom years owing to healthy prices of estate and cash crops such as cocoa, cloves and sugar cane. This prosperity has attracted workers from outside. It was found that in three
TABLE 8 Seven Kabupaten Study: Population of In-migrants Returning Due to the Crisis and Circular Migrants Who Had Stopped Migrating
in Response to the Crisis
Migration Response Due to Crisis
Type of Migrant No. No. %
Return migrants 792 354 44.7 Recently arrived migrants 848 131 15.4 Circular migrants 1,053 48 4.6
study areas (Indramayu, North Lampung and Wonogiri) the bulk of migrants came from Jakarta and West Java, while in the East Java villages two-thirds came from overseas, and in the other villages the majority of migrants came from surrounding areas.
In all cases the migration is selective of males (especially in the case of circular migrants) and of the young adult age groups, the more educated and the married populations. Young male adults who are not heads of households are prominent among circular migrants, reflecting the fact that in many cases circular migration is a survival strategy for families, especially in urban areas, whereby they send out a family member to supplement the family’s income from off-farm sources. It is apparent that the circular migration is predominantly for work, with virtually all circular migrants having worked in the week before the survey. Among the other migrants, more than half had worked during the last week and 7.8% were looking for work, indicating a significant degree of unemployment among the incoming migrants. The circular migrants are clearly involved mainly in informal sector activities at their destination, and less than one-fifth work in agriculture. Many work in the unskilled labourer, construction worker category as day labourers. Among the other migrants, farming is more important, accounting for about one-third of workers; an even larger proportion are in the unskilled labour category, indicating that many returnees are willing to work at a wide range of unskilled agricultural and non-agricultural activities at a range of localities. It is notable too that about one-fifth of the in-migrants are unpaid family workers. This may indicate that many of the migrants are being absorbed on the family farm upon return to the village.
The significance of landlessness in rural Indonesia is evident: more than half of the households in the sample did not own any agricultural land. Despite the recent arrival of many returned and recent migrants, one-third owned land in the village, suggesting that households probably often retained land in their village of origin after moving to the city. More than one-half of circular migrants owned land in villages.
The movements into the survey villages were accompanied by significant shifts in the economic sectors in which migrants worked. The largest number of migrants were involved in construction before migration (131 persons), but after migration only 21.4% of this group remained in this occupation. The second largest group were in services before migration (122 persons), and 78.7% were still in this occupation after migrating to the village. Among those involved in manufacturing before migration, some 44.3% retained this occupation, while a similar proportion retained agricultural occupations. The number working in agriculture increased from 107 before migration to 191 afterwards. In terms of employment status, the proportion of waged employees declined from 78% before migration to 40% after movement. On the other hand, proportions self-employed as family members increased from 21% to 58% among migrants moving because of the crisis. There is clearly a pattern of movement from the formal to the informal sector among these migrants.
Urip (1998) has analysed the results of the 100 village study. In this study return migrants are defined as people who had ever lived outside the village for more than a month. This applied to 10.7% of all persons aged over 10 in the study area, or 4,170 persons, and almost a quarter of return migrants had returned in the year before the study. Hence urban– rural return migration is a process that clearlypredates the crisis. Studies of migration in rural Java have long shown that many rural–urban migrants return to their village of origin upon retiring from urban jobs (Hugo 1978). It is interesting to see that males only slightly outnumber females among the in-migrants, and that a third come from urban areas into the villages.
Urip’s analysis of reasons given by migrants for their return (1998) is hampered by the fact that 31.4% of those returning in the last year, and 19.2% of others, gave reasons that were coded as ‘other’. This masks the impact of the crisis on return migration. A large proportion of the remainder (39.8% of recent arrivals and 56% of the others) moved to follow other family members. Among the returnees in the last year, 66% were in the workforce (61.3% employed and 5.6% looking for work), and almost 90% were aged between 20 and 54.
appears to have been an increase in the rate of out-migration during the crisis period. However, many households’ initial response to the crisis would not have involved migration, but other strategies such as seeking additional work, placing more family members in work, selling assets, and requesting assistance from formal and informal sources. It would also often have involved some form of non-permanent movement. In this case, the family remains in the original location, but individual family members (most often the head) move temporarily to a place where it is believed they can get work; in the case of urban residents this may be back to the village of origin. Such mobility is unlikely to be detected in traditional questionnaires unless a specific question is asked about circular migration. When such a question is asked (e.g. in the Seven Kabupaten
Study) a high incidence of circular migration is recorded.
In summary, it would seem that there has been some return of former urban dwellers to rural areas in Indonesia, especially in Java. This movement includes two groups that are larger than those permanently relocating from urban to rural areas:
• workers who were previously circulating temporarily to urban areas, especially those moving to work in construction and construction-related industries; and
• residents of urban areas working in the informal sector (including people who had been displaced from the formal sector) who circulate between city and village to take advantage of limited job opportunities in both sectors and maximise their incomes.
MIGRATION BETWEEN JAVA AND THE OUTER ISLANDS
found significant return migration to rural areas occurring among men and women displaced from work in an Export Processing Zone located near Ujung Pandang in South Sulawesi.
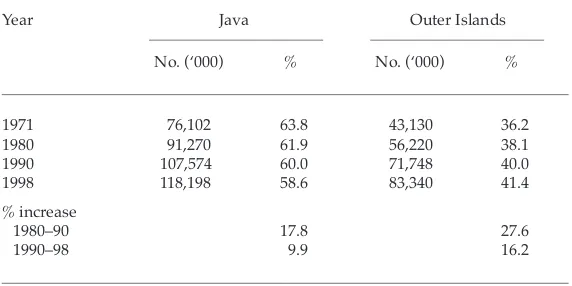
There has been a long history of net migration from Java to the Outer Islands, and the government has had a significant involvement in encouraging that movement (Hugo 1997). Table 9 shows that the 1990s saw population growth in the Outer Islands continuing to outstrip that of Java, so that their share of the total population increased from 36 to 41% between 1971 and 1998. Some of the increase was due to higher fertility outside Java (although this was partly offset by higher mortality), but significant net migration loss from Java to the Outer Islands was also a factor. There is little available evidence of migration between Java and the Outer Islands in the post-crisis period, however.
Evidence on the impact of the crisis outside Java is also mixed. On the one hand, Sumarto, Wetterberg and Pritchett (1999: 8) found in the
Kecamatan Rapid Poverty Assessment study that there was enormous heterogeneity in the impact of the crisis, and that three prominent patterns emerged. First, Java was hard hit, even in rural areas, because of integration of the urban and rural economies. Second, some of the other islands, particularly large parts of Sumatra, Sulawesi and Maluku, experienced minimal negative crisis impacts. Third, Outer Island areas
TABLE 9 Population in Java and the Outer Islands, 1971–98
Year Java Outer Islands
No. (‘000) % No. (‘000) %
1971 76,102 63.8 43,130 36.2
1980 91,270 61.9 56,220 38.1
1990 107,574 60.0 71,748 40.0
1998 118,198 58.6 83,340 41.4
% increase
1980–90 17.8 27.6
1990–98 9.9 16.2
like the former province of East Timor and East and West Nusa Tenggara experienced negative impacts, but this may have been due to the El Niño effect.
Other researchers such as Islam (1999) have produced evidence from the Susenas that some areas in the Outer Islands were badly hit by the crisis, and have argued that these areas must be included in any strategies to deal with its effects.
CONCLUSIONS
Although comprehensive and accurate data are lacking, it is apparent that population mobility has become an important coping mechanism for confronting the effects of the crisis. A range of permanent and, more especially, non-permanent mobility strategies are being adopted to enable families to survive loss of income resulting from the crisis. The extent of return migration, however, varies greatly from place to place. The crisis has affected urban populations—through displacement of workers from the formal sector and through reduced income from informal sector occupations as spending falls and competition increases—but it has also impacted on rural populations through the reduced inflow of remittances. Rural populations have suffered because their labour markets and economies are closely tied to those of urban areas, such that only the land-rich have been able to ride out the crisis, or gain from increased prices.
NOTES
1 Conventionally in Indonesia numbers employed in the informal sector are estimated from the work status question in censuses and surveys. People who define themselves as self-employed, self-employed assisted by family workers, day labourers and unpaid family workers are considered to be in the informal sector, while employers and paid employees are in the formal sector.
REFERENCES
Ahmed, I. (1999), Indonesia’s Crisis and Recovery: The Myths and Reality, Occasional Discussion Paper Series No. 1, ILO, Jakarta.
Depnaker and BPS (Departemen Tenaga Kerja and Badan Pusat Statistik) (1999),
Penyusunan Peta Data Pengangguran [Mapping of Unemployment Data], Buku II, Departemen Tenaga Kerja and Badan Pusat Statistik, Jakarta.
Feridhanusetyawan, T. (1998), ‘Economic Crisis and Employment Problems in Indonesia’, ACIAR Indonesia Research Project Working Paper 98.09, Centre for Strategic and International Studies, Jakarta.
Frankenberg, E., K. Beegle, D. Thomas and W. Suriastini (1999), Health, Education, and the Economic Crisis in Indonesia, Paper prepared for the Population Association of America meetings, New York, 25–27 March.
Frankenberg, E., D. Thomas and K. Beegle (1999), ‘The Real Costs of Indonesia’s Economic Crisis: Preliminary Findings from the Indonesia Family Life Surveys’, Labor and Population Program Working Paper Series 99-04, Rand Corporation, Santa Monica CA.
Gantjang, A., P.B. Irawan, U. Suhaimi and S. Baidawi (1999), The Impact of the Crisis on Population Mobility in Indonesia, UNDP with BPS, Jakarta.
Geertz, C. (1963), Agricultural Involution: The Process of Ecological Change in Indonesia,
University of California Press, Berkeley CA.
Hugo, G.J. (1978), Population Mobility in West Java, Gadjah Mada University Press, Yogyakarta.
—— (1981), ‘Road Transport, Population Mobility and Development in Indonesia’, in G.W. Jones and H.V. Richter (eds), Population Mobility and Development in Southeast Asia and the Pacific, ANU Development Studies Centre Monograph No. 27, Canberra: 355–86.
—— (1982), ‘Sources of Internal Migration Data in Indonesia: Their Potential and Limitations’, Majalah Demografi Indonesia [Indonesian Journal of Demography], 17 (9): 23–52.
—— (1995), ‘Labour Export from Indonesia: An Overview’, ASEAN Economic Bulletin 12 (2): 275–98.
—— (1997), ‘Changing Patterns and Processes in Population Mobility’, in G.W. Jones and T.H. Hull (eds) (1997), Indonesia Assessment: Population and Human Resources, ANU, Canberra, and ISEAS, Singapore: 68–100.
—— (1999a), The Impact of the Crisis on International Population Movement in Indonesia, Paper prepared for ILO Indonesian Employment Strategy Mission, Jakarta, May.
—— (1999b), The Impact of the Crisis on Internal Population Movement in Indonesia, Paper prepared for ILO Indonesian Employment Strategy Mission, Jakarta, May.
Islam, I. (1999), Poverty, Inequality and the Indonesian Crisis: Issues in Methodology, Paper prepared for UNSFIR Seminar, Jakarta, 28 April. Mantra, I.B. (1981), Population Movement in Central Java, Gadjah Mada University
Press, Yogyakarta.
Poppele, J., S. Sumarto and L. Pritchett (1999), Social Impact of the Indonesian Crisis: New Data and Policy Implications, Unpublished monograph for Social Monitoring and Early Response Unit (SMERU), Semarang.
Important Issues from the Results of a Rapid Appraisal Study in West Java Province], PPT–LIPI, Jakarta.
Sandee, H. (1999), ‘Workshop Report: The Impact of the Crisis on Village Development in Java’, Bulletin of Indonesian Economic Studies 35 (1): 141–2. Silvey, R.M. (1998), Stigmatized Spaces: Moral Geographers under Crisis in South
Sulawesi, Indonesia, Unpublished paper based on research carried out under grant SBR-9406597 from the National Science Foundation and fieldwork funding from Fulbright Hays, University of Colorado.
—— (forthcoming), ‘Migration under Crisis: Household Safety Nets in Indonesia’s Economic Collapse’, Geoforum, Special Issue on the Crisis.
Spaan, E. (1999), Labour Circulation and Socio-economic Transformation: The Case of East Java, Indonesia, PhD thesis, University of Groningen, Groningen. Sumarto, S., A. Wetterberg and L. Pritchett (1999), The Social Impact of the Crisis
in Indonesia: Results from a Nationwide Kecamatan Survey, Preliminary draft, World Bank, Jakarta.
Sunaryanto, H. (1998), Female Labour Migration to Bekasi, Indonesia: Determinants and Consequences, Unpublished PhD thesis, Population and Human Resources, The University of Adelaide, Adelaide.
Thomas, D., E. Frankenberg, K. Beegle and G. Teruel (1999), Household Budgets, Household Composition and the Crisis in Indonesia: Evidence from Longitudinal Household Survey Data, Paper prepared for the 1999 Population Association of America meetings, New York, 25–27 March.
Thomas, D., E. Frankenberg and J.P. Smith (1999), Lost but Not Forgotten: Attrition in the Indonesian Family Survey, Paper prepared for the Conference on Data Quality in Longitudinal Surveys, Institute for Social Research, University of Michigan, October.
UNSFIR (United Nations Support Facility for Indonesian Recovery) (1999), The Social Implications of the Indonesian Economic Crisis: Perceptions and Policy, UNSFIR, Jakarta.
