T H E J O U R N A L O F H U M A N R E S O U R C E S • 47 • 2
Understanding the Cycle
Childhood Maltreatment and Future Crime
Janet Currie
Erdal Tekin
A B S T R A C T
Child maltreatment is a major social problem. This paper focuses on mea-suring the relationship between child maltreatment and crime using data from the National Longitudinal Study of Adolescent Health (Add Health). We focus on crime because it is one of the most costly potential outcomes of maltreatment. Our work addresses two main limitations of the existing literature on child maltreatment. First, we use a large national sample, and investigate different types of maltreatment in a unified framework. Sec-ond, we pay careful attention to controlling for possible confounders using a variety of statistical methods that make differing assumptions. The re-sults suggest that maltreatment greatly increases the probability of engag-ing in crime and that the probability increases with the experience of mul-tiple forms of maltreatment.
I. Introduction
Child maltreatment, which includes both child abuse and child ne-glect, is a major social problem that has been neglected by economists. In the United Janet Currie is the Henry Putnam Professor of Economics and Public Affairs at Princeton University and the Director of Princeton’s Center for Health and Well Being. She also directs the Program on Families and Children at the National Bureau of Economic Research. Erdal Tekin is an associate profes-sor of economics at Georgia State University and a research associate at the NBER. They would like to thank Neil Guterman, Christina Paxson, Chris Ruhm, Joyce Tabor, Volkan Topalli, and participants in seminars at the City University of New York, Columbia’s School Social Work, Columbia’s Teachers Col-lege, 2005 Population Association of America Meetings, 2005 IZA/SOLE Meetings, 2005 SEA Meetings, Georgia State University, MDRC, University of Illinois at Chicago, and Koc University for helpful com-ments. Roy Wada provided excellent research assistance. They also gratefully acknowledge funding from the National Institutes of Health grant number R21 HD050740-01-A2. They are solely responsible for any interpretations or errors. The data used are from the National Longitudinal Study of Adolescent Health (Add Health), a program project directed by Kathleen Mullan Harris and designed by J. Richard Udry, Peter S. Bearman, and Kathleen Mullan Harris at the University of North Carolina at Chapel Hill, and funded by grant P01-HD31921 from the Eunice Kennedy Shriver National Institute of Child Health and Human Development, with cooperative funding from 23 other federal agencies and founda-tions. Special acknowledgment is due Ronald R. Rindfuss and Barbara Entwisle for assistance in the original design. Information on how to obtain the Add Health data files is available on the Add Health website (http://www.cpc.unc.edu/addhealth). No direct support was received from grant P01-HD31921 for this analysis.
[Submitted September 2010; accepted June 2011]
States, maltreatment is the leading cause of death from injuries in children older than a year. The death rate among children less than 15 is 2.4 per 100,000 and 1,500 children die every year (Institute of Medicine 1999). These deaths are only the tip of the iceberg. According to the U.S. Department of Health and Human Services (1996), more than a million children are victims of maltreatment annually. In two of the few economic studies to address the issue, Paxson and Waldfogel (1999, 2002) show that abuse and neglect are more common in families of lower socioeconomic status, so that maltreatment likely exacerbates differences in the life chances of rich and poor children.
Maltreatment may have many long-term consequences for survivors. This paper focuses on the effect of child maltreatment on crime using data from the National Longitudinal Study of Adolescent Health (Add Health). We focus on crime because it is one of the most socially costly potential outcomes of maltreatment and because the proposed mechanisms linking maltreatment and crime are relatively well eluci-dated in the literature. Yet there is still controversy about the extent to which a “cycle of violence” in which child maltreatment leads to future crime has been substantiated (compare with Widom 1989a). Economic models of crime typically focus on the adult criminal’s human capital and cost/benefit calculations (Freeman 1999). In contrast, our research offers a glimpse at the reasonswhycriminal capital is accumulated and suggests that the process may begin in early childhood.
There have been several recent prospective longitudinal studies of child abuse, but these often rely on administrative data and have limited controls for other char-acteristics of families (see Ireland et al. 2002; Stouthamer-Loeber et al. 2001). Fur-thermore, administrative data on maltreatment and crime capture only a fraction of these behaviors because not all incidents are reported to or captured by government agencies. Finally, families for whom there are official records may be those that are more likely to come to the attention of official agencies, and thus may be an unre-presentative sample of families in which child maltreatment occurs (Smith and Thornberry 1995). Rebellon and Van Gundy (2005) note that little previous research has employed nationally representative samples. Other researchers (for example, Lansford et al. 2002, 2007) rely on maternal reports about whether the child has been subject to abuse. A difficulty with these studies is that the researcher is morally and legally obligated to intervene if current maltreatment is detected.
Currie and Tekin 511
which children are maltreated may have other characteristics that are associated with negative child outcomes and higher propensities to engage in crime. In our data, for example, children who were maltreated have mothers who are less educated and more likely to be on welfare. It is important to account for these differences appro-priately.
We attack this problem using several different estimation methods, all of which rely on differing assumptions. These methods include: Ordinary Least Squares (OLS) with a rich set of controls as well as sibling and twin fixed effects. All of these methods have potential limitations, which we take pains to point out. However, the nature of child maltreatment makes it unthinkable to study it using an experimental design. We will show that the estimates we obtain are remarkably similar, regardless of estimation method. We believe that given the different assumptions implicit in the different estimation methods, this uniformity of results provides a strong, if not completely conclusive, argument that we are uncovering a causal effect.
II. Background
A. Why would Child Maltreatment lead to Crime?
Psychological explanations for the relationship between child maltreatment and crime are typically derived from three theoretical perspectives: Social Control The-ory, Social Learning TheThe-ory, and Social-psychological Strain Theory. Social Control Theory assumes that individuals have a natural tendency towards crime and violence which is restrained by their social bonds (Hirschi 1969). By disrupting these bonds, maltreatment by caregivers makes individuals more likely to offend (see Zingraff, Leiter, Johnsen, and Myers 1994; Sampson and Laub 1993).
Social Learning Theory maintains that victims of maltreatment learn and adopt patterns of violent or delinquent behavior through processes of imitation and mod-eling. These behaviors are observed by children to result in positive outcomes (for example, control over others, or the acquisition of material or social benefits) (see Widom 1998; Garland and Dougher 1990; Walters and Grusec 1977).
ex-ample, the wages available to them in the noncriminal labor market, their skill at committing crime, and the social and economic gains that would be forfeited in the event of arrest or incarceration. Social Control Theory emphasizes one cost—broken social bonds—but ignores the others.
Social Learning Theory focuses on what an economist would think of as human capital development. When a child sees others committing crime, he builds up capital as a criminal, which may make him both a better criminal and a worse legitimate worker. The human capital perspective also offers insight into Social-Psychological Strain Theory. Economists have begun to explore the effects of events in early childhood on the development of both cognitive and noncognitive skills (Cunha and Heckman 2008; Cunha, Heckman and Schennach 2010). There is increasing evi-dence that events early in life have far reaching consequences for the skills of adults (Currie 2009; Almond and Currie 2011). SPST emphasizes one way in which mal-treatment impairs the development of critical noncognitive skills in the developing child.
B. Prior Evidence on the Effects of Maltreatment on Crime and Delinquency
Several recent studies have examined the long-term consequences of child maltreat-ment using designs that are more sophisticated than those critiqued by the NRC panel. The first group establishes a cross-sectional relationship between past expe-riences of maltreatment and other past adverse events, and current risky behaviors/ outcomes. For example, Felitti (1998) and Dube et al. (2003a) show that adverse childhood experiences (ACEs) are correlated with future risk for depressed affect, suicide attempts, multiple sexual partners, sexually transmitted diseases, smoking, and alcoholism. Dube et al. (2003b) provides further evidence about the relationship between ACEs and future use of illicit drugs, while Hillis et al. (2004) report on the relationship between ACEs and teen pregnancy.
While provocative, these relationships do not necessarily imply that ACEscause risky behaviors. If, for example, poverty is associated with ACEs then the fact that people with ACEs have higher rates of criminal activity could actually reflect a causal relationship between poverty and involvement in crime. This would indicate that the effect of ACEs on risky behaviors is estimated with bias. Moreover, most ACE studies aggregate maltreatment with other forms of household dysfunction rather than trying to separately identify the effect of maltreatment.
A second group of studies is more closely related to the current study in that they control for family background factors such as poverty by using samples of twins in which one twin was maltreated and the other was not. Nelson et al. (2002), Kendler et al. (2000) and Dinwiddie et al. (2000) use this design to examine the effects of child sexual abuse on future psychiatric problems. The first two studies conclude that maltreated twins are more likely than their nonmaltreated twins to suffer neg-ative outcomes. However, Dinwiddie finds no differences between maltreated and nonmaltreated twins.
Currie and Tekin 513
exacerbate the effects of random measurement error (which would result in fixed effects estimates that were smaller than those obtained by OLS). The design might also underestimate effects of maltreatment if both children were traumatized by the experience of one of the twins having been abused. We will address these issues further below.
One of the best known studies of the long-term effects of maltreatment is by Widom (1989b) who matched a sample of 908 children with substantiated cases of maltreatment to controls who were selected to be similar in terms of age, sex, race, and socioeconomic status. This study is unusual in that it distinguished between physical abuse, neglect, and sexual abuse, and also involved long-term followup of the subjects. She finds substantial effects of both abuse and neglect on arrest both as a juvenile and as an adult: Being abused or neglected as a child increases an individual’s risk for an arrest as a juvenile by 53 percent, increases the probability of arrest as an adult by 38 percent, and increases the probability of an arrest for a violent crime by 38 percent.
However, matching on a small number of observable traits provides no guarantee that the controls are really similar to the “experimental” group in terms of unmea-sured as well as meaunmea-sured characteristics. Widom also points out the limitations of relying on administrative data from an era in which mandatory reporting of child maltreatment did not exist. We believe that it is useful to try to replicate Widom’s results using nationally representative data (hers were from a Midwestern town), a more recent cohort, and alternative statistical methods. Another strength of our study is that, like Widom, we examine the effects of physical abuse, neglect, and sexual abuse in a unified framework.
III. Data
Our data are drawn from the National Longitudinal Study of Ado-lescent Health (Add Health). Add Health was specifically designed to investigate adolescents’ health and risk behaviors. It is considered the largest and most com-prehensive survey of adolescents ever undertaken. A stratified sample of 80 high schools was selected to be representative of the U.S. school system with respect to region of country, urbanicity, school size, school type, and ethnicity. For each of these 80 schools, another school, called a feeder school, was selected on the basis of its students’ contribution to the high school. Therefore, the school-based sample is based on 80 pairs of schools.1 An in-school questionnaire was administered to more than 90,000 students (virtually all students) in these sampled schools between September 1994 and April 1995. A random sample of some 200 students was se-lected from each of these schools for more detailed in-home interviews, conducted between April and December 1995. A total of 20,745 adolescents were interviewed for Wave I. Interviews were also conducted with parents during Wave I. The
lescents are interviewed for the second time in 1996 for Wave II, and for the third time between August 2001 and April 2002 for Wave III. The number of individuals interviewed in Wave III is 15,197. Excluding people with missing data on at least one maltreatment measure results in a sample of 13,509 individuals, which we use in our OLS analyses. There are 3,428 siblings in the data, but eliminating those with missing data (or whose sibling was missing data) yields a sibling sample of 2,216 children.
The Add Health sampled twins with certainty, and there are a total of 695 pairs of twins and two triplets in the Wave I Add Health sample. However, our empirical analysis of twins is based on 464 twins, either because at least one of the twins does not appear in Wave III or because of missing data on key variables. Further infor-mation about sample selection is in the Data Appendix.
A. Measures of Maltreatment
In Wave III, respondents answered questions about the way they were treated by their parents or other adults who took care of them before they were in the sixth grade. Specifically, they were asked whether and how often:
(1) Parents (or other adult caregivers) had not taken care of their basic needs, such as keeping them clean or providing food or clothing.
(2) Parents (or other adult caregivers) slapped, hit, or kicked them.
(3) Parents (or other adult caregivers) had touched them in a sexual way, forced them to touch him or her in a sexual way, or forced them to have sexual relations.
(4) Parents (or other adult caregivers) left them home alone when an adult should have been with them.
Previous studies of child maltreatment have noted the difficulty of finding a def-inition of the concept that is clear, unambiguous, and acceptable to all (Doueck et al. 1987; Vissing et al. 1991). However, we believe that the wording of the questions in Add Health reflects an emerging consensus about definitions of maltreatment as reflected, for example, in government sources like the Administration for Children (ACF) and Families of the Department of Health and Human Services.2It is im-portant to note that a third of the child fatalities attributed to maltreatment involve neglect rather than physical or sexual abuse, while 40 percent involve multiple mal-treatment types, most often both abuse and neglect (U.S. DHHS 2010). Hence, we feel that it is important to investigate neglect rather than focusing only on physical and sexual abuse. A limitation of our data set is that while we know how many times children were slapped, hit, or kicked, we cannot identify severe physical abuse. It seems likely that the effects of such severe abuse are greater than those we report below.
Another limitation of the data on maltreatment is that they are based on self-reports. Several researchers have studied the validity of self-reported data on child
Currie and Tekin 515
maltreatment and have concluded that, if collected properly, these data are valid (Allen, Leadbeater, and Aber 1994; Dembo et al. 1991). In our data, the respondents listened to prerecorded questions on sensitive topics through earphones and entered their answers directly on laptops in order to maintain confidentiality and to minimize the potential for interviewer or other third-party influence. In order to obtain accurate responses about the timing of events, subjects were prompted with a calendar that gave the dates of many important events. Mocan and Tekin (2005, 2006) and Tekin and Markowitz (2008) provide evidence that rates of many of the risky behaviors reported in the Add Health are consistent with other sources.
Like many other studies, ours is based on retrospective reports of maltreatment. It is possible that people tend to forget past maltreatment as they grow older. We have investigated “forgetting” directly by examining whether the older people in the sample were less likely to report childhood maltreatment than those who were age 18. We find no evidence that this is the case.
Another potential problem is that people with negative outcomes may be more likely to report childhood maltreatment. For example, they may blame past maltreat-ment for their current problems. In this case, Ordinary Least Squares (OLS) estimates will tend to find “effects” of maltreatment that are too large. Measurement error of this type could also bias sibling or twin fixed effects models. Suppose that one twin is more likely to report bad things in general. Then this twin will be more likely to report both maltreatment and crime leading to spurious results.
We investigated this problem in the case of twins by examining responses to a series of questions that should have been answered in the same way by both twins. These questions included whether or not the father was in jail at Wave I; how far the two twins lived away from each other; how often the twins saw each other; and how often the twins fought with each other. As shown in Appendix Table A1, we found few statistically significant correlations between differences in the twins’ re-ports about maltreatment and differences in rere-ports about these other variables. These findings increase our confidence about the reliability of the twin reports and provide some evidence against the hypothesis that one twin is just “more negative” than the other.3
Table 1 shows the fraction of respondents reporting various forms of maltreatment. Roughly eleven percent of the sample report that their parents ever failed to meet their basic needs. Only 4.8 percent of the sample report any form of sexual abuse, while roughly a third of the respondents report that their parents ever left them alone
The
Journal
of
Human
Resources
Table 1
Fraction of Add Health Sample Reporting Maltreatment
Type of Maltreatment
(1) All
(2) Twin Sample
(3) Fraction of Twin
Families with Different Reports
(4) Sibling Sample
(5) Fraction of Sibling
Families with Different Reports
Ever left alone 0.397 0.405 0.409 0.394 0.419
Left alone > 10 times 0.082 0.082 0.129 0.071 0.118
Ever basic needs unsatisfied 0.113 0.126 0.161 0.123 0.191
Ever hit, spanked, kicked, etc. 0.292 0.279 0.330 0.292 0.387
Hit, etc. > 10 times 0.063 0.050 0.078 0.056 0.089
Ever sexual abuse 0.048 0.057 0.101 0.051 0.093
Ever any abuse 0.526 0.518 0.412 0.529 0.438
Any abuse using > 10 times cutoffs for physical abuse and being left alone
0.231 0.241 0.272 0.231 0.297
Currie and Tekin 517
when they “should have been supervised” or that their parents hit them. While these later figures seem especially high, they are broadly consistent with other studies. For example, Scher et al. (2004) use a sample of 967 adults from a community survey in Memphis Tennessee to determine the prevalence of retrospectively reported child maltreatment and find that 30 percent of women and 40 percent of men reported some form of maltreatment while 19 percent reported physical abuse, 18 percent reported neglect, and 5 percent reported sexual abuse.
Defined this way, more than half of the children report some form of “maltreat-ment.” However, we examined the distribution of reports and found that only 8.2 percent report that they were left alone when they should have been supervised more than 10 times, while 6.3 percent indicate that they were hit, kicked, or slapped by their parents or other adult care givers more than 10 times. If we use these higher thresholds for neglect and physical abuse then we find that 23.1 percent of respon-dents report that they were maltreated in any way. In what follows we will report results using all of these different potential measures of maltreatment.
Column 2 shows that the fraction of twins who report maltreatment is similar to that reported in the full sample. Column 3 shows the fraction of twins who have different reports of maltreatment. This column shows that discrepant reports are quite common, which is necessary if we are to identify effects of maltreatment in twin models. Columns 4 and 5 report the fraction of the sibling sample who report various types of maltreatment and the fraction of sibling pairs with discrepant reports. Again, the fractions are quite similar to those for the full sample.
B. Measures of Crime
The Add Health asks many questions related to delinquent and criminal activity. The crime questions in Add Health are similar to those found in other surveys and to official definitions of “crime” found in government sources such as the Bureau of Justice Statistics. We focus on six questions that emphasize serious and/or com-mon crimes committed in the 12 com-months prior to the survey. The crimes we examine include property damage, assault, armed robbery, burglary, theft, and any hard-drug use in the past 12 months. We also look at a summary measure of whether any nondrug crime was committed in the past 12 months, and whether the respondent was ever convicted. Finally, we look at whether the respondent was himself/herself a victim of a crime in the past 12 months. Our measure of victimization is a com-posite obtained by combining answers to seven questions about whether the respon-dent had a gun/knife pulled on him/her, was shot or stabbed, was beaten up without anything being stolen/with something stolen, or was otherwise injured by someone at least once in the past 12 months. The definitions and means of outcomes and other variables used in the analyses are presented in Table 2.
The
Definitions and Means of Outcomes and Explanatory Variables by Any Maltreatment and Type of Maltreatment
Variable Name Definition
0.164 0.109 0.226 0.241 0.295 0.244 0.261 0.324
Armed robbery (N = 13,482)
= 1 if used or threatened to use a weapon to get something from someone else in the past 12 months, else = 0
0.020 0.011 0.031 0.028 0.058 0.038 0.034 0.074
Burglary (N = 13,482)
= 1 if went into a house or building to steal something in the past 12 months, else = 0
0.019 0.009 0.030 0.040 0.050 0.035 0.031 0.068
Assault (N = 13,489) = 1 if pulled a knife on someone, shot someone, or badly hurt someone in the past 12 months, else
= 0
0.071 0.049 0.100 0.094 0.155 0.105 0.108 0.193
Damaged property (N = 13,453)
= 1 if deliberately damaged property that belonged to someone else in the past 12 months, = 0 otherwise
0.086 0.052 0.122 0.132 0.141 0.135 0.156 0.159
Theft > $50 (N = 13,478)
= 1 if stole something worth more than 50 dollars in the past 12 months, else = 0
Currie
0.120 0.085 0.151 0.208 0.149 0.170 0.185 0.183
Victim (N = 13,486) = 1 if the respondent had a gun/knife pulled on them, was shot or stabbed, was beaten up without anything being stolen/ with something stolen, or was otherwise injured by someone at least once in the past 12 months, else
= 0
0.106 0.077 0.144 0.139 0.227 0.152 0.149 0.263
Ever convicted (N = 13,493)
= 1 if ever convicted in an adult or a juvenile court, else = 0
0.060 0.040 0.085 0.110 0.117 0.093 0.126 0.099
2. Selected Explanatory Variables
Mother Ed < HSa = 1 if the mother has less
than high school degree, = 0 otherwise
0.157 0.151 0.163 0.165 0.223 0.174 0.183 0.223
Jailed father = 1 if the biological father was ever jailed, = 0 otherwise
0.144 0.103 0.189 0.241 0.222 0.205 0.245 0.246
Welfare = 1 if parents were on welfare during Wave I,
= 0 otherwise
0.085 0.077 0.090 0.089 0.161 0.098 0.100 0.160
Sibling4 + = 1 if four or more siblings, = 0 otherwise
0.081 0.085 0.073 0.053 0.098 0.082 0.083 0.097
Income < 50 percent of poverty
= 1 if parental income was less 50 percent of poverty line at Wave I, = 0 otherwise
0.055 0.052 0.057 0.063 0.097 0.063 0.068 0.085
Mother age at
birth≤19a Mother’s age atrespondent’s birth was 19
or less, = 0 otherwise
0.101 0.092 0.115 0.134 0.144 0.119 0.118 0.156
The
3. Means of child characteristics that may differ within families
Male = 1 if male, 0 = otherwise 0.459 0.436 0.491 0.495 0.567 0.489 0.482 0.432
ADHD = 1 if exhibited symptoms
of ADHD from 5–12, = 0 otherwise
0.076 0.057 0.095 0.146 0.128 0.099 0.131 0.129
Very low birthweight
= 1 if birthweight was less than 1,500 grams, = 0 otherwise
0.022 0.024 0.020 0.019 0.023 0.019 0.022 0.025
Low birth-weighta = 1 if birthweight was
between 1,500–2,499 grams, = 0 otherwise
0.088 0.084 0.096 0.085 0.093 0.088 0.095 0.115
Normal birthweight = 1 if birthweight was greater than or equal to 2,500 grams, = 0 otherwise
0.890 0.892 0.884 0.896 0.884 0.893 0.882 0.860
Child bad tempered = 1 if the parent reported that respondent was bad tempered at Wave I, = 0 otherwise
0.302 0.270 0.330 0.357 0.383 0.356 0.376 0.379
Child learning problems
= 1 if the parent reported that respondent had learning problems at Wave I, = 0 otherwise
0.112 0.107 0.122 0.101 0.170 0.109 0.095 0.154
Number of observations 13,509 6,398 5,357 1,113 1,528 3,941 846 650
a. Omitted category.
Currie and Tekin 521
have not committed any of these offenses reported victimization. Similarly, the per-centage of hard-drug drugs users is 20 percent among victimized individuals, but only 10 percent among those who report no victimization.
The first panel of Table 2 shows means of these outcomes by whether or not respondents suffered various types of maltreatment. The table indicates that across almost every domain, children who suffered maltreatment are at least twice as likely to have engaged in crime as those who did not. They are also more likely to have been convicted, and to have been victimized themselves. Table 2 also offers some support for the idea that those who suffer the worst maltreatment have the worst outcomes. For example, those who were left alone or physically abused more than ten times have worse outcomes than those who report less frequent abuse or neglect.
C. Explanatory variables
Of course there may be many other factors that differ between children who were maltreated and those who were not. Failing to control for these factors would cause bias in the estimated effect of maltreatment on crime. One advantage of the Add Health is that it allows us to control for a rich set of individual and family back-ground characteristics that may be correlated with both maltreatment and criminal behavior. The second panel of Table 2 shows some of the explanatory variables used in the analyses (for a full list, see Appendix Table A2). We see, for example, that consistent with Paxson and Waldfogel (1999, 2002) children who were maltreated are more likely to have a mother with less than a high school education, more likely to have had a father in jail at Wave I, more likely to have been on welfare at Wave I, and more likely to have a mother who was a teenager at the time of her child’s birth. Overall, children whose families were poor at Wave I are much more likely to report maltreatment in childhood. It is clearly important to control for differences between families.
The last panel of Table 2 focuses on characteristics of maltreated children that might differ within families. Panel 3 shows that maltreated children were somewhat more likely to have been reported by their parents to be “bad tempered” at Wave I. Similarly, maltreated children were also more likely to have had symptoms of ADHD between ages 5 and 12. Males are more likely to report every type of maltreatment except sexual abuse. However, there is little systematic relationship between mal-treatment and whether the parent reported a learning problem and between maltreat-ment and birth weight except that those who were of low birth weight are more likely to report that they were victims of sexual abuse. We will show below that while some of these individual characteristics are important predictors of maltreat-ment, controlling for them has virtually no impact on the estimated effect of mal-treatment.
IV. Empirical Methods
will begin with OLS models of the effects of different maltreatment measures on the criminal activity and victimization outcomes. These models will be of the form:
Outcome=β+β*Maltreatment+β *X+β*State+ε,
(1) 1 2 3
where Outcome is one of the binary crime measures, Maltreatmentis one of the measures of maltreatment,Stateis a vector of state-specific fixed effects that control for differences in state institutions and persistent differences in state income,Xis a vector of individual and family control variables, andε is the error term.
We estimate Equation 1 using linear probability models and two different versions ofX.4 The first is a “short list” of controls which includes dummies for each year of child age at the time of the survey; child gender, child race, whether the child is Hispanic, and whether the child is U.S.-born. The second version of Xis a much fuller list of controls which also includes: the child’s birth weight ( < 1,500; 1,500– 2,500; > 2,500 grams, missing); whether the child is the first born, first born missing; whether the parent reports that the child has learning problems at Wave I; whether the child is reported to be “bad tempered” at Wave I; whether the child had ADHD symptoms between ages five and 12; mother’s education (less than high school, high school, more than high school, missing); mother’s age at birth (≤19, 20–30, 31– 40, 41 + , missing); parents’ religion (Catholic, Baptist, Other Protestant, Other, None, Missing); number of siblings (none, one, two, three, four or more, missing); father present (biological, step, or missing); father ever jailed (or ever jailed miss-ing); family on AFDC in Wave I (or missmiss-ing); poverty status ≤0.5*poverty, (0.51– 1)*poverty, (1.01–2)*poverty, > 2*poverty, missing. By comparing OLS estimates using the short list of controls with those estimated using the full list of controls we can gain insight into how sensitive the estimates are to adding controls.5
We next turn to models estimated using siblings and twins. In order to implement this design, we restrict our sample to sibling or twin pairs, and estimate models of the form:
Outcome=β+β*Maltreatment+β *X′+β*PairID+ε′,
(2) 1 2 3
where nowX′is a much smaller vector of control variables that vary within sibling
or twin pairs (gender and birth weight) and PairID is a vector of unique binary identifiers (or fixed effects) for each pair. By including sibling or twin fixed effects in Equation 2, we control for all of the common elements of family background that are shared by the siblings or twins, such as poverty.
In cases of child maltreatment, it is not uncommon for one child to be abused while the other children in the family are unharmed (see, for example,New York Times2006). There has been some previous research into the reasons for disparate
4. OLS estimates of coefficients in linear probability models are consistent estimates of average probability derivatives, but the standard error estimates are biased by heteroskedasticity; therefore, we report standard errors corrected for heteroskedasticity.
Currie and Tekin 523
treatment of twins, in particular. For example, Jaffee et al. (2004) examine cases of abuse in pairs of identical twins and report four reasons why one twin was treated differently than the other: One twin had been ill; the mother had a folk belief that children had to have opposite personalities, or that one had to be dominant; the mother identified one of the twins with herself; or the mother identified one of the twins with a partner or ex-partner. Surprisingly, there was no consistent pattern in terms of which twin was treated worse. For example, some mothers reinforced health differences while others appeared to compensate for them. Our approach to this problem is to control for differences in important child-level measures of tempera-ment, learning ability, and health.
V. Results
Table 3 shows OLS estimates for the full sample with varying lists of controls. The maltreatment variable is “any maltreatment” defined using the “greater than 10 times” cutoffs for being left alone and for physical abuse. The first column shows an OLS model with a limited set of controls, the second column shows models with parental reports of the respondent’s behavioral problems during childhood including bad temperament, learning problems, and ADHD, the third col-umn presents models estimated with a full list of child and family characteristics, and the fourth column shows models that include school fixed effects. It is remark-able that the inclusion of additional controls has very little effect on the estimated “maltreatment” coefficients in the OLS models. Relative to the Table 2 means, these estimates suggest that maltreatment roughly doubles the probability of being in-volved in any nondrug related crime.
The fifth and sixth columns of Table 3 show separate estimates for males and females. OLS estimates indicate that maltreatment is associated with increased crim-inality for both males and females, but the estimates also suggest that maltreatment has much larger effects on males than on females.
One might argue that maltreatment is the result of the respondent’s behavior as a child, for example, abusive parenting may have begun in response to the behavior of a temperamentally difficult child (Lykken 1995). In this case, the estimated effect of maltreatment from Column 1 would include both the actual effect of maltreatment and the effect of the child’s temperament. However, a comparison of the estimates in Columns 1, 2, and 3 suggest that controlling for temperament, learning disabilities, ADHD, and low birth weight (in addition to many observable family background characteristics) has little impact on the estimated effect of maltreatment.
The
Journal
of
Human
Resources
Table 3
Effects of Any Maltreatment on Criminal Activity
(Using > 10X cutoff for physical abuse and being left alone when should have been supervised. Each coefficient is from a separate regression.
OLS Short List of Controls
OLS Short List of Controls with Behavioral
Problems
OLS Full List of Controls
OLS Full List of Controls with School FE
OLS Full List of Controls with School FE—Males
OLS Full List of Controls with School FE—Females
Any nondrug 0.112*** 0.106*** 0.104*** 0.105*** 0.151*** 0.061***
(0.008) (0.008) (0.008) (0.008) (0.014) (0.010)
Armed robbery 0.024*** 0.023*** 0.022*** 0.022*** 0.036*** 0.008**
(0.004) (0.004) (0.004) (0.004) (0.007) (0.004)
Burglary 0.027*** 0.027*** 0.026*** 0.025*** 0.041*** 0.009**
(0.004) (0.004) (0.004) (0.004) (0.007) (0.004)
Damaged property 0.060*** 0.058*** 0.058*** 0.059*** 0.084*** 0.035***
(0.007) (0.007) (0.007) (0.007) (0.011) (0.007)
Assault 0.058*** 0.053*** 0.049*** 0.051*** 0.080*** 0.022***
(0.006) (0.006) (0.006) (0.006) (0.011) (0.007)
Theft > $50 0.034*** 0.032*** 0.031*** 0.031*** 0.051*** 0.012**
Currie
and
T
ekin
525
Any hard drug 0.067*** 0.062*** 0.061*** 0.061*** 0.081*** 0.044***
(0.007) (0.007) (0.007) (0.008) (0.012) (0.010)
Crime victim 0.081*** 0.076*** 0.070*** 0.071*** 0.098*** 0.039***
(0.007) (0.007) (0.007) (0.007) (0.012) (0.008)
Ever convicted 0.056*** 0.051*** 0.043*** 0.044*** 0.076*** 0.011**
(0.006) (0.006) (0.006) (0.006) (0.011) (0.005)
Notes: Robust standard errors in parentheses. A *, **, *** indicates significance at 90 percent, 95 percent, 99 percent respectively.
seven percentage points between age 25 and age 18. Being white is associated with lower probabilities of committing nondrug type of crimes but with higher probabil-ities of using hard drugs. This pattern is reversed for blacks. Having been born outside the United States is associated with lower propensities of committing crime. Consistent with Currie and Stabile (2006, 2009) ADHD symptoms are strongly re-lated to future crime. But as discussed above, controlling for ADHD has little impact on the estimated effect of maltreatment.
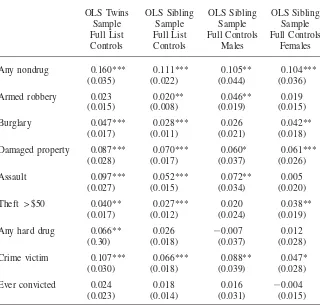
Table 4 shows OLS models for the twin and sibling subsamples. It is useful to compare these estimates to those of Table 3 in order to get a sense of how changing samples affects the estimates. Column 1 of Table 4 indicates that OLS estimates are uniformly larger in the twins subsample than in the full sample, though in most cases we cannot reject that the coefficients are the same given the larger standard errors in the twins sample. However, Column 2 indicates that estimates in the sibling subsample are very similar to those in the full sample.
This comparison suggests that the effects of abuse may be larger in the twin subsample. One possible explanation for this pattern is a nonlinear effect of mal-treatment on crime. If twins are more vulnerable to the effects of malmal-treatment, then maltreatment could have a larger effect. Reasons that twins might be more vulnerable include a higher incidence of premature birth, neonatal complications, isolation, fi-nancial pressures, increased levels of parental stress and exhaustion, and increased family size (Nelson and Martin 1985). Moreover, conditional on reported abuse, we found that twins were more likely to report that social services investigated how the child was taken care of or tried to take the child out of his/her living situation. This difference may indicate that twins were indeed more severely abused than nontwins. Nevertheless, even the smaller sibling estimates suggest large and statistically significant effects of maltreatment on most indicators of criminal activity. For ex-ample, individuals who were subject to any type of maltreatment are 11.1 percentage points more likely to commit some type of nondrug offense in the sibling sample. Estimates from the sibling sample suggest that maltreated children are significantly more likely to commit burglary (by 2.8 percentage points), assault (by 5.2 percentage points), theft (by 2.7 percentage points), as well as to damage property (by seven percentage points). The estimates suggest that maltreatment not only increases the probability that an individual will engage in crime but also increases the probability that he or she will be a crime victim (by 6.6 percentage points) as well.
The next two columns present estimates by gender using the sample of siblings. These estimates are based on samples with at least two boys or at least two girls. That is, sibling pairs with a boy and a girl are excluded. The literature on the link between abuse and crime suggests that there may be gender differences in the pro-pensities of males and females to engage in serious, persistent, and violent crime (Lanctot and LeBlanc 2002). However, studies examining these gender differences have produced mixed results. For example, Rivera and Widom (1990) found that maltreated males were at greater risk of committing a violent offense than a matched control group while this was not true among females. However, Maxfield and Widom (1996) found that abused females were at a greater risk of arrest for violence than control females whereas the relationship was barely significant for abused males.
Currie and Tekin 527
Table 4
Effects of Any Maltreatment on Criminal Activity—OLS Models with Sibling and Twin Samples
(Using > 10X cutoff for physical abuse and being left alone when should have been supervised. Each coefficient is from a separate regression.
OLS Twins Sample Full List Controls
OLS Sibling Sample Full List Controls
OLS Sibling Sample Full Controls
Males
OLS Sibling Sample Full Controls
Females
Any nondrug 0.160*** 0.111*** 0.105** 0.104***
(0.035) (0.022) (0.044) (0.036)
Armed robbery 0.023 0.020** 0.046** 0.019
(0.015) (0.008) (0.019) (0.015)
Burglary 0.047*** 0.028*** 0.026 0.042**
(0.017) (0.011) (0.021) (0.018)
Damaged property 0.087*** 0.070*** 0.060* 0.061***
(0.028) (0.017) (0.037) (0.026)
Assault 0.097*** 0.052*** 0.072** 0.005
(0.027) (0.015) (0.034) (0.020)
Theft > $50 0.040** 0.027*** 0.020 0.038**
(0.017) (0.012) (0.024) (0.019)
Any hard drug 0.066** 0.026 −0.007 0.012
(0.30) (0.018) (0.037) (0.028)
Crime victim 0.107*** 0.066*** 0.088** 0.047*
(0.030) (0.018) (0.039) (0.028)
Ever convicted 0.024 0.018 0.016 −0.004
(0.023) (0.014) (0.031) (0.015)
Notes: Robust standard errors in parentheses. A *, **, *** indicates significance at 90 percent, 95 percent, 99 percent respectively.
The sample sizes range from 926 to 928 in Column 1, from 2,211 to 2,115 in Column 2, from 655 to 656 in Column 3, and from 828 to 830 in Column 4.
Table 5
Effects of Any Maltreatment on Criminal Activity—Fixed Effects Estimates with Twin and Sibling Samples
(Using > 10X cutoff for physical abuse and being left alone when should have been supervised. Each coefficient is from a separate regression.
Twin Fixed Effects
Sibling Fixed Effects
Sibling Fixed Effects
Males
Sibling Fixed Effects Females
Any nondrug 0.144*** 0.086*** 0.119* 0.110**
(0.045) (0.030) (0.063) (0.053)
Armed robbery 0.011 0.008 0.034 0.026
(0.017) (0.013) (0.028) (0.016)
Burglary 0.047*** 0.018* 0.011 0.052**
(0.014) (0.010) (0.022) (0.022)
Damaged property 0.089** 0.058** 0.081 0.057
(0.036) (0.024) (0.053) (0.035)
Assault 0.067** 0.042** 0.064 0.002
(0.031) (0.021) (0.046) (0.031)
Theft > $50 0.039* 0.006 −0.011 0.026
(0.020) (0.016) (0.030) (0.024)
Any hard Drug 0.083** 0.005 0.040 −0.021
(0.034) (0.024) (0.048) (0.035)
Crime victim 0.080** 0.066** 0.061 0.051
(0.037) (0.025) (0.051) (0.038)
Ever convicted 0.023 −0.006 −0.038 0.009
(0.031) (0.021) (0.046) (0.022)
Notes: Robust standard errors in parentheses. A *, **, *** indicates significance at 90 percent, 95 percent, 99 percent respectively.
The sample sizes range from 926 to 928 in Column 1, from 2,211 to 2,115 in Column 2, from 655 to 666 in Column 3, and from 828 to 830 in Column 4. Twin fixed effects models include child gender and indicators for very low birth weight, low birth weight, ADHD, and parental reports about whether the child was bad tempered and had learning problems as of Wave I. Sibling fixed effects models also include indicators for age.
per-Currie and Tekin 529
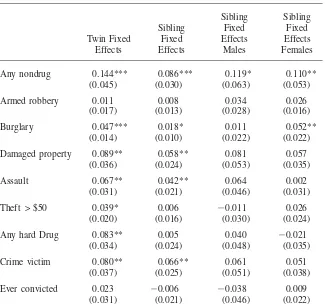
centage points more likely to engage in any nondrug crime compared to the 11.1 percentage points estimated in the OLS models. The last two columns in Table 5 present specific estimates from the sibling fixed effects models. The gender-specific estimates suggest that both maltreated boys and maltreated girls are more likely to commit crime although the estimates are much less precisely estimated.
Table 6 explores the effect of different types of maltreatment on crime, using the sibling fixed effects models. We focus on sibling fixed effects because the OLS estimates from the sibling sample are quite similar to those from the full sample, suggesting that the sibling fixed effects estimates may be more representative of the typical child than the twin fixed effects estimates.
This table shows quite different effects of different forms of maltreatment. Leaving children alone when they should have been supervised appears to be relatively be-nign. But having parents who ever failed to meet one’s basic needs greatly increases the probability of assault, damaging property, and being a victim. Similarly, having a parent who ever struck, hit, or kicked them increases the probability of criminal activity, and the effect tends to be greater if the parent struck them frequently. Sexual maltreatment has the largest negative effects: For example, respondents who report that they were sexually abused are 24.5 percentage points more likely to have com-mitted any nondrug offense. A comparison of the first two lines of Table 6 offers some support for our emphasis on a measure of “any maltreatment” that uses the “greater than 10 times” cutoffs for frequent physical maltreatment and being left alone: This measure is more often statistically significant and tends to have larger effects than a measure of whether there was ever any maltreatment.
One index of the severity of maltreatment is whether more than one type of maltreatment took place. For example, if sexual abuse and neglect cause crime sep-arately, one might expect that a person who experienced both sexual abuse and neglect would be at a higher risk of committing crime than a person who had only one of these experiences. Our data show that joint experiences of maltreatment are common. For example, sexual abuse is three times (two times) higher among those who also experienced physical abuse (neglect) than those who did not experience physical abuse (neglect). Similarly, physical abuse is twice as common among those who were neglected as among those who were not neglected. The distribution of joint experiences of maltreatment is as follows: 76.9 percent of our sample report no maltreatment (using > 10 times cutoffs for physical abuse and neglect); 16.1 percent report only one type of maltreatment; 5.4 percent report two types of mal-treatment; 1 percent report three types of malmal-treatment; and 0.18 percent report all four types of maltreatment.
al-The
Journal
of
Human
Resources
Table 6
Effects of Different Types of Maltreatment on Outcomes—Sibling FE Models
(Each cell of the table shows the coefficient on the maltreatment indicator from a different regression).
Any Nondrug
Armed
Robbery Burglary
Damaged
Property Assault Theft > $50
Any Hard
Drug Victimized
Ever Convicted
1. Any maltreatment using > 10 cutoffs for physical maltreatment and being left alone
0.086*** 0.008 0.018* 0.058** 0.042** 0.006 0.005 0.067*** −0.006 (0.030) (0.013) (0.010) (0.024) (0.021) (0.016) (0.024) (0.025) (0.021)
2. Ever any maltreatment
0.055** −0.001 0.012 0.053*** 0.019 0.015 0.029 0.035* −0.013 (0.022) (0.008) (0.008) (0.017) (0.015) (0.011) (0.018) (0.018) (0.015)
3. Maltreatment = 1 if Parents Ever Left Alone When Should Have Been Supervised
0.004 −0.011 0.004 0.010 0.013 0.001 0.039** 0.027 −0.008 (0.023) (0.008) (0.009) (0.018) (0.016) (0.012) (0.018) (0.019) (0.015)
4. Maltreatment = 1 if parents left alone when should have been supervised > 10 times
Currie
and
T
ekin
531
5. Maltreatment = 1 if parents ever failed to meet basic needs
0.051 0.018 0.014 0.044* 0.055** −0.004 −0.004 0.063** −0.017 (0.034) (0.012) (0.013) (0.027) (0.023) (0.017) (0.027) (0.028) (0.022)
6. Maltreatment = 1 if parents ever struck, etc.
0.087*** 0.015* 0.019** 0.065*** 0.031* 0.014 0.036* 0.036* 0.001 (0.025) (0.009) (0.009) (0.019) (0.017) (0.013) (0.020) (0.021) (0.016)
7. Maltreatment = 1 if parents struck, etc. > 10 times
0.216*** 0.023 0.013 0.156*** 0.051 −0.025 0.040 0.073* 0.021 (0.048) (0.018) (0.019) (0.038) (0.034) (0.025) (0.039) (0.041) (0.032)
8. Maltreatment = 1 if sexual maltreatment
0.245*** 0.083*** 0.098*** 0.121*** 0.120*** 0.098*** 0.061 0.118*** 0.027 (0.047) (0.017) (0.018) (0.038) (0.033) (0.024) (0.038) (0.040) (0.032)
The
Journal
of
Human
Resources
Table 7
Sibling FE Models with Multiple Experiences of Maltreatment
Variable
Any Nondrug
Armed
Robbery Burglary
Damaged
Property Assault
Theft > $50
Other Hard
Drug Victim
Ever Convicted
Only one maltreatment 0.034 −0.012 0.010 0.021 0.008 −0.017 −0.016 0.048* −0.024 (0.034) (0.012) (0.013) (0.028) (0.021) (0.018) (0.025) (0.026) (0.022)
Two types of maltreatment
0.183** 0.075** 0.039 0.128*** 0.117** 0.054** 0.040 0.071 0.036 (0.061) (0.032) (0.030) (0.049) (0.047) (0.031) (0.051) (0.054) (0.039)
Three or more types of maltreatment
0.403*** 0.008 0.060 0.208** 0.196** 0.101 0.183* 0.350*** 0.032 (0.104) (0.011) (0.049) (0.087) (0.083) (0.096) (0.111) (0.098) (0.108)
Currie and Tekin 533
though relatively few children report three or more types of maltreatment so that we must exercise caution in interpreting these estimates, such treatment is estimated to increase the probability of engaging in any nondrug crime by 40.3 percentage points.
VI. Discussion and Conclusions
In order to determine the social cost of child maltreatment, we need to quantify its effects on important outcomes. This paper focuses on the effects on crime. We find that child maltreatment roughly doubles the probability that an in-dividual engages in many types of crime. The large size of these effects suggests that maltreatment may generate large externalities in terms of the costs of crime. It is important to note that our estimates represent an “overall” effect of maltreatment on crime in that we do not control for potential mediators such as educational at-tainment.
One potential explanation for the large effects is that children who experience maltreatment start engaging in crime earlier. Widom (1989b) shows that abused or neglected children are more likely to be arrested both as juveniles and as adults. Starting to engage in criminal behavior early may develop a child’s expertise in crime at the expense of legitimate activities such as work or schooling, which would increase the returns to crime relative to other activities. We looked at this timing issue by estimating models of the effects of maltreatment on the likelihood of having been convicted in a juvenile court. The OLS estimates were positive, large, and statistically significant. In particular, we found that being a victim of maltreatment increased the probability of being convicted as a juvenile by about two percentage points. The mean value for juvenile conviction among those who were not maltreated is about 1.4 percent, so an effect of this size suggests that maltreatment approxi-mately doubles the probability of juvenile conviction. Sibling and twin fixed effects models yield similar point estimates, although the estimates are less precisely esti-mated due to the smaller sample size.
Our results suggest that while not everyone who is abused becomes a criminal, maltreatment is a major determinant of future criminal behavior. The estimates in-dicate that the effects of maltreatment are large relative to other factors that have been studied in the Economics literature such as unemployment (Corman and Mocan 2005), education (Jacob and Lefgren 2003), gun ownership (Mocan and Tekin 2006; Duggan 2001), the introduction of crack cocaine (Grogger and Willis 2000), the legalization of abortion (Donahue and Levitt 2001), and exposure to lead through paint or gasoline (Reyes 2007; Nevin 2007).
The
Journal
of
Human
Resources
Table 8
Estimated Annual Costs of Maltreatment in Terms of Increases in Costs of Crime
Crime Cost Per Crime ($)
Prevalence in Add Health
Estimated Effect Abuse Twin FE
Annual Per Person Cost of Abuse ($)
Total Cost of Abuse (million $)
A. Costs from Locher and Moretti (2004)
Assault 13,884 0.071 0.042 134 5,226
Robbery 13,139 0.020 0.008 24 936
Burglary 1,382 0.019 0.018 6 234
Theft > $50 277 0.033 0.006 0.38 15
Sum: 6,411
B. Costs from Cohen (2004)
Assault 81,900 0.071 0.042 791 30,849
Robbery 271,440 0.020 0.008 499 19,461
Burglary 29,250 0.019 0.018 121 4,719
Sum: 5,029
Currie and Tekin 535
surveys. The available estimates cover only some of the crimes that we examine in our data and some types of crime for which estimates exist are not represented in our data. For example, the largest estimated costs of crime are for murder, which is such a rare outcome that we cannot look at changes in its incidence in our data.
The Lochner and Moretti estimates suggest that the crime induced by maltreatment costs society at least $6.4 billion ($2,006) per year. The Cohen estimates suggest a much larger figure of $55 billion. It would be interesting to compare these figures to the cost of preventing maltreatment. Unfortunately, few intervention programs have been proven to be effective in rigorous studies. Olds et al. report that random-ized trials of nurse home visiting programs that start before birth show that these programs can reduce the incidence of substantiated cases of maltreatment by 50 percent (Olds et al. 1999), and that such programs have also had an impact on crime (Olds et al. 1998)6. This research has attracted attention at the highest levels, and President Obama’s 2010 budget blueprint contained funding for such programs. At a cost of about $4,000 per child in total, the steady-state cost of providing this service to all children would be about $14 billion per year (assuming that there are roughly 3.5 million children born each year). Given that the crime induced by maltreatment is only one of the social costs of maltreatment, these estimates suggest that a home visiting program like Olds’ might well pay for itself, even using conservative esti-mates of the costs of crime. If we attach some benefit to improving the lives of poor children (beyond the value we attach to saving taxpayers money) then the cost-benefit analysis begins to look even more favorable.
In summary, our study provides new evidence that the apparent negative effects of maltreatment on children’s propensity to engage in crime are likely to be real and not simply artifacts of other features of dysfunctional families, or even of dysfunc-tional children. Our estimates imply that being maltreated approximately doubles the probability of engaging in many types of crime. Sexual abuse appears to have the largest effects on crime, perhaps justifying the emphasis on this type of abuse in the literature and in the media. Moreover, because sexual abuse can never be justified or excused by a young child’s personality or behavior, our finding of large effects for sexual abuse supports a causal interpretation of our findings. That is, we think it unlikely that sexual abuse of a child is caused by that child’s personality or behavior, so that the estimated effects of this type of abuse are unlikely to be con-founded by omitted characteristics of the child. Finally, the probability of engaging in crime increases with the experience of multiple forms of maltreatment. This find-ing suggests that criminal behavior increases not only with the incidence of mal-treatment but also with the severity of malmal-treatment.
References
Agnew, Robert. 1985. “A Revised Strain Theory of Delinquency.”Social forces64(1):151– 67.
———. 1992. “Foundation for a General Strain Theory of Crime and Delinquency.” Criminology30(1):47–88.
Allen, Joseph P., Bonnie J. Leadbeater, and J. Lawrence Aber. 1994. “The Development of Problem Behavior Syndromes in at-Risk Adolescents.”Development and Psychopathology 6(2):323–42.
Almond, Douglas, and Janet Currie. 2011. “Human Capital Development before Five.” In Handbook of Labor Economics, ed. D. Card and O. Ashenfelter. Amsterdam: North Holland.
Bernstein, Nina. “A Tough Road for Siblings Who Survived Abuse.”New York Times, January 15, 2006.
Cicchetti, Dante, and Fred Rogosch. 2001. “The Impact of Child Maltreatment and Psychopathology on Neuroendocrine Functioning.”Development and Psychopathology 13(4):783–804.
Claussen, Angelika H., and Patricia M. Crittenden. 1991. “Physical and Psychological Maltreatment: Relations among Types of Maltreatment.”Child Abuse & Neglect15(1– 2):5–18.
Cohen, Mark A., Roland T. Rust, Sara Steen, and Simon T. Tidd. 2004. “Willingness to Pay for Crime Control Programs.”Criminology42(1):89–110.
Corman, Hope, and Naci Mocan. 2005. “Carrots, Sticks, and Broken Windows.”Journal of Law and Economics48(1):235–66.
Cunha, Flavio, and James J. Heckman. 2008. “Formulating, Identifying and Estimating the Technology of Cognitive and Noncognitive Skill Formation.”Journal of Human Resources43(4):738–872.
Cunha, Flavio, James J. Heckman, and Susanne M. Schennach. 2010. “Estimating the Technology of Cognitive and Noncognitive Skill Formation.”Econometrica78(3):883– 931.
Currie, Janet. 2009. “Healthy, Wealthy, and Wise: Socioeconomic Status, Poor Health in Childhood, and Human Capital Development.”Journal of Economic Literature47(1):87– 122.
Currie, Janet, and Mark Stabile. 2006. “Child Mental Health and Human Capital Accumulation: The Case of ADHD.”Journal of Health Economics25(6):1094–118. ———. 2009. “Mental Health in Childhood and Human Capital.” InAn Economic
Perspective on the Problems of Disadvantaged Youth, ed. J. Gruber. Chicago University of Chicago Press for NBER.
Deblinger, Esther, Susan V. Mcleer, Marc S. Atkins, Diana Ralphe, and Edna Foa. 1989. “Post-Traumatic Stress in Sexually Abused, Physically Abused, and Nonabused Children.”Child Abuse & Neglect13(3):403–408.
Dembo, R., L. Williams, J. Schmeidler, E.D. Wish, A. Getreu, and E. Berry. 1991. “Juvenile Crime and Drug Abuse: A Prospective Study of High Risk Youth.”Journal of Addictive Diseases11(2):5–31.
Dinwiddie, S., A. C. Heath, M. P. Dunne, K. K. Bucholz, P. A. F. Madden, W. S. Slutske, L. J. Bierut, D. B. Statham, and N. G. Martin. 2000. “Early Sexual Abuse and Lifetime Psychopathology: A Co-Twin–Control Study.”Psychological Medicine30(1):41–52. Donohue, John J., and Steven D. Levitt. 2009. “The Impact of Legalized Abortion on
Crime.” InRecent Developments in Law and Economics. Volume 2,ed. R. D. Cooter and F. Parisi, 540–81. Elgar Reference Collection. International Library of Critical Writings in Economics, vol. 241. Cheltenham, U.K. and Northampton, Mass.: Elgar.
Doueck, Howard J., Anthony H. Ishisaka, Susan L. Sweany, and Lewayne D. Gilchrist. 1987. “Adolescent Maltreatment.”Journal of Interpersonal Violence2(2):139.
Currie and Tekin 537
Problems: Evidence from Four Birth Cohorts Dating Back to 1900.”Preventive Medicine 37(3):268–77.
———. 2003b. “Childhood Abuse, Neglect, and Household Dysfunction and the Risk of Illicit Drug Use: The Adverse Childhood Experiences Study.”Pediatrics111(3):564–72. Duggan, Mark. 2001. “More Guns, More Crime.”Journal of Political Economy
109(5):1086–114.
Felitti, Vincent J., Robert Anda, Dale Nordenberg, David Williamson, Alison Spitz, Valerie Edwards, Mary Koss, and James Marks. 1998. “Relationship of Childhood Abuse and Household Dysfunction to Many of the Leading Causes of Death in Adults: The Adverse Childhood Experiences (Ace) Study.”American Journal of Preventive Medicine
14(4):245–58.
Freeman, Richard. 1999. “The Economics of Crime.” InHandbook of Labor Economics, ed. D. Card and O. Ashenfelter. Amsterdam: North Holland.
Garland, Randall J., and Michael J. Dougher. 1990. “The Abused-Abuser Hypothesis of Child Sexual Abuse: A Critical Review of Theory and Research.” InPedophilia: Biosocial Dimensions, ed. J. R. Feierman, 488–509. New York: Springer-Verlag. Grogger, Jeff, and Michael Willis. 2000. “The Emergence of Crack Cocaine and the Rise in
Urban Crime Rates.”Review of Economics and Statistics82(4):519–29.
Hillis, Susan D., Robert F. Anda, Shanta R. Dube, Vincent J. Felitti, Polly A. Marchbanks, and James S. Marks. 2004. “The Association between Adverse Childhood Experiences and Adolescent Pregnancy, Long-Term Psychosocial Consequences, and Fetal Death.” Pediatrics113(2):320–27.
Hirschi, Travis. 1969.Causes of Delinquency.Berkley, Calif.: University of California Press.
Institute of Medicine. 1999.Reducing the Burden of Injury.Washington, D.C.: National Academy Press.
Ireland, Timothy O., Carolyn A. Smith, and Terence P. Thornberry. 2002. “Developmental Issues in the Impact of Child Maltreatment on Later Delinquency and Drug Use.” Criminology40(2):359–99.
Jacob, Brian A., and Lars Lefgren. 2003. “Are Idle Hands the Devil’s Workshop? Incapacitation, Concentration, and Juvenile Crime.”American Economic Review93(5): 1560–77.
Jaffee, Sara R., Avshalom Caspi, Terrie E. Moffitt, Monica Polo-Tomas, Thomas S. Price, and Alan Taylor. 2004. “The Limits of Child Effects: Evidence for Genetically Mediated Child Effects on Corporal Punishment but Not on Physical Maltreatment.”Developmental Psychology40(6):1047–58.
Kendler, Kenneth , Cynthia Bulik, Judy Silberg, John Hettema, John Myers, and Carol Prescott. 2000. “Childhood Sexual Abuse and Adult Psychiatric and Substance Use Disorders in Women: An Epidemiological and Co-Twin Control Analysis.”Archives of General Psychiatry57(10):953–59.
Lanctot, Nadine, and Marc Leblanc. 2002. “Explaining Deviance by Adolescent Females.” InCrime and Justice, ed. M. Tonry. Chicago: University of Chicago Press.
Lansford, Jennifer E., Kenneth A. Dodge, Gregory S. Pettit, John E. Bates, J. Crozier, and J. Kaplow. 2002. “A 12-Year Prospective Study of the Long-Term Effects of Early Child Physical Maltreatment on Psychological, Behavioral, and Academic Problems in Adolescence.”Archives of Pediatrics & Adolescent Medicine156(8):824–30.
Lansford, Jennifer E., Shari Miller-Johnson, Lisa Berlin, Kenneth A. Dodge, John E. Bates, and Gregory S. Pettit. 2007. “Early Physical Abuse and Later Violent Delinquency: A Prospective Longitudinal Study.”Child Maltreatment12(3):233–45.
Lykken, David. 1995.Antisocial Personalities.Hillsdale, N.J.: Lawrence Erlbaum. Maxfield, Michael G., and Cathy S. Widom. 1996. “The Cycle of Violence: Revisited 6
Years Later.”Archives of Pediatrics & Adolescent Medicine150(4):390–5.
Mocan, Naci, and Erdal Tekin. 2005. “Drug Use and Juvenile Crime: Evidence from a Panel of Siblings and Twins.” InEconomics of Substance Use: Individual Behavior, Social Interactions, Markets, and Politics, ed. B. Lindgren and M. Grossman, 91–120. Amsterdam: Elsevier.
———. 2006. “Guns and Juvenile Crime.”Journal of Law and Economics49(2):507–681. National Research Council. 1993.Understanding Child Abuse and Neglect.Washington,
D.C.: National Academy Press.
Nelson, Elliot C., Andrew C. Heath, Pamela A.F. Madden, M. Lynne Cooper, Stephen H. Dinwiddie, Kathleen K. Bucholz, Anne Glowinski, Tara Mclaughlin, Michael P. Dunne, Dixie J. Statham, and Nicholas G. Martin. 2002. “Association between Self-Reported Childhood Sexual Abuse and Adverse Psychosocial Outcomes.”Archives of General Psychiatry59(2):139–45.
Nelson, Henry, and Catherine Martin. 1985. “Increased Child Abuse in Twins.”Child Abuse & Neglect9(4):501–505.
Nevin, Rick. 2007. “Understanding International Crime Trends: The Legacy of Preschool Lead Exposure.”Environmental Research104(3):315–36.
Olds, David, Charles R. Henderson Jr., Robert Cole, John Eckenrode, Harriet Kitzman, Dennis Luckey, Lisa Pettitt, Kimberly Sidora, Pamela Morris, and Jane Powers. 1998. “Long-Term Effects of Nurse Home Visitation on Children’s Criminal and Antisocial Behavior: 15-Year Follow-up of a Randomized Controlled Trial.”JAMA: Journal of the American Medical Association280(14):1238–44.
Olds, David, Charles R. Henderson Jr., Harriet Kitzman, John Eckenrode, Robert Cole, and Robert Tatelbaum. 1999. “Prenatal and Infancy Home Visitation by Nurses: Recent Findings.”Future of Children9(1):44–65.
Paxson, Christina, and Jane Waldfogel. 1999. “Parental Resources and Child Abuse and Neglect.”American Economic Review89(2):239–44.
———. 2002. “Work, Welfare, and Child Maltreatment.”Journal of Labor Economics 20(3):435–74.
Rebellon, Cesar J., and Karen Van Gundy. 2005. “Can Control Theory Explain the Link between Parental Physical Abuse and Delinquency? A Longitudinal Analysis.”Journal of Research in Crime and Delinquency42(3):247–74.
Reyes, Jessica W. 2007. “Environmental Policy as Social Policy? The Impact of Childhood Lead Exposure on Crime.” Working Paper #13097, Cambridge, Mass: National Bureau of Economic Research
Rivera, Beverly, and Cathy S. Widom. 1990. “Childhood Victimization and Violent Offending.”Violence and Victims5(1):19–35.
Rosenbaum, Paul R., and Donald B. Rubin. 1983. “The Central Role of the Propensity Score in Observational Studies for Causal Effects.”Biometrika70(1):41.
Sampson, Robert L., and John H. Laub. 1993.Crime in the Making.Cambridge, Mass.: Harvard University Press.
Scher, Christine, David Forde, John Mcquaid, and Murray Stein. 2004. “Prevalence and Demographic Correlates of Childhood Maltreatment in an Adult Community Sample.” Child Abuse & Neglect28(2):167–80.
Smith, Carolyn A., and Terence P. Thornberry. 1995. “The Relationship between Childhood Maltreatment and Adolescent Involvement in Delinquency.”Criminology33(4):451–81. Stouthamer-Loeber, Magda, Rolf Loeber, D. Lynn Homish, and Evelyn Wei. 2001.
Currie and Tekin 539
Tekin, Erdal, and Sara Markowitz. 2008. “The Relationship between Suicidal Behavior and Productive Activities of Young Adults.”Southern Economic Journal75(2):300–31. U.S. Department of Health and Human Services. 1993.National Center on Child Abuse and
Neglect. Third National Incidence Study of Child Abuse and Neglect: Final Report (Nis-3).Washington, D.C.: Government Printing Office.
———. 2010.Child Abuse and Neglect Fatalities: Statistics and Interventions.http:// www.childwelfare.gov/pubs/factsheets/fatality.cfm. Date Accessed 2/27/2011. Veltman, Marijcke, and Kevin Browne. 2001. “Three Decades of Child Maltreatment
Research.”Trauma, Violence, & Abuse2(3):215–39.
Vissing, Yvonne, Murray A. Straus, Richard J. Gelles, and John W. Harrop. 1991. “Verbal Aggression by Parents and Psychosocial Problems of Children.”Child Abuse & Neglect 15(3):223–38.
Walters, Gary, and Joan Grusec. 1977.Punishment.San Francisco: WH Freeman. Widom, Cathy S. 1989a. “Does Violence Beget Violence? A Critical Examination of the
Literature.”Psychological Bulletin106(1):3–28.
———. 1989b. “The Cycle of Violence.”Science244(4901):160–66.
———. 1994. “Childhood Victimization and Risk for Adolescent Problem Behaviors.” In Adolescent Problem Behaviorsed. M. E. Lamb and R. Ketterlinus, 127–64. Hillsdale, N.J.: Erlbaum.
———. 1998. “Childhood Victimization: Early Adversity and Subsequent
Psychopathology.” InAdversity, Stress, and Psychopathology, ed. B. P. Dohrenwend, 81– 95. New York: Oxford University Press
The
Journal
of
Human
Resources
Table A1
Regressions of Differences in Twin Reports of Maltreatment on Differences in Reporting of Other Outcomes
Ever Any Maltreatment
Any Maltreatment
> 10X
Ever Left Alone
Left Alone > 10X
Ever failed to meet needs
Ever Physical Abuse
Physical Abuse > 10X
Ever Sexual Abuse
1. Differences in reports about whether father had ever been in jail as of Wave I
Difference 0.117* 0.060 0.049 0.078 0.051 0.049 0.105 −0.030 (0.062) (0.065) (0.038) (0.067) (0.056) (0.035) (0.071) (0.043)
2. Differences in reports about how often twins fight with each other
Difference 0.037 0.022 0.001 0.035 −0.022 0.020 0.055* −0.012 (0.036) (0.034) (0.024) (0.038) (0.024) (0.018) (0.032) (0.019)
3. Differences in reports about how far they must travel to see each other
Difference 0.027 0.050 0.007 0.034 −0.032 0.013 0.013 0.007 (0.056) (0.050) (0.036) (0.058) (0.033) (0.027) (0.048) (0.029)
4. Differences in reports about how often they talk to each other
Difference −0.033 −0.031 0.028 −0.014 −0.068* 0.006 −0.040 −0.009 (0.055) (0.050) (0.037) (0.059) (0.037) (0.025) (0.047) (0.022)
Currie
Definitions and Means of All Explanatory Variables Included in Regressions by Any Maltreatment and Type of Maltreatment
Variable Name Definition Full Sample
Never Any
0.010 0.009 0.012 0.017 0.010 0.011 0.015 0.008
Age 19 = 1 if 19 years old, = 0 otherwise
0.095 0.090 0.104 0.093 0.093 0.091 0.070 0.114
Age 20 = 1 if 20 years old, = 0 otherwise
0.132 0.123 0.145 0.152 0.156 0.134 0.143 0.126
Age 21 = 1 if 21 years old, = 0 otherwise
0.160 0.159 0.163 0.158 0.168 0.151 0.124 0.151
Age 22 = 1 if 22 years old, = 0 otherwise
0.190 0.186 0.189 0.166 0.182 0.201 0.197 0.182
Age 23 = 1 if 23 years old, = 0 otherwise
0.192 0.198 0.187 0.208 0.179 0.191 0.195 0.197
Age 24 = 1 if 24 years old, = 0 otherwise
0.160 0.170 0.145 0.150 0.141 0.160 0.194 0.152
Age 25 = 1 if 25 years old, = 0 otherwise
0.052 0.055 0.048 0.050 0.058 0.054 0.051 0.060
Age 26 + = 1 if 26 years old or older, = 0 otherwise
0.009 0.010 0.008 0.006 0.012 0.006 0.011 0.011
Male = 1 if male, = 0 otherwise
0.459 0.436 0.491 0.495 0.567 0.489 0.482 0.432
White = 1 if white, = 0 otherwise
0.667 0.681 0.654 0.657 0.569 0.649 0.626 0.596
Black = 1 if Black, = 0 otherwise
0.226 0.233 0.224 0.206 0.287 0.215 0.223 0.284
Other racea = 1 if other race, = 0
otherwise
0.107 0.087 0.122 0.138 0.144 0.136 0.150 0.120
The
Variable Name Definition Full Sample
Never Any
0.159 0.146 0.170 0.150 0.201 0.189 0.176 0.204
U.S.-born = 1 if born in the United States, = 0 otherwise
0.922 0.931 0.912 0.908 0.904 0.906 0.904 0.922
Mother Ed < HSa
= 1 if the mother has less than high school degree, = 0 otherwise
0.157 0.151 0.163 0.165 0.223 0.174 0.183 0.223
Mother Ed = HS
= 1 if the mother has high school degree,
= 0 otherwise
0.351 0.350 0.356 0.329 0.378 0.342 0.304 0.341
Mother
0.492 0.499 0.481 0.506 0.399 0.484 0.514 0.436
Jailed father = 1 if the biological father was ever jailed,
= 0 otherwise
0.144 0.103 0.189 0.241 0.222 0.205 0.245 0.246
Catholic = 1 if parents are Catholic, = 0 otherwise
0.287 0.272 0.297 0.287 0.284 0.313 0.268 0.284
Baptist = 1 if parents are Baptist, = 0 otherwise
0.237 0.255 0.224 0.203 0.286 0.207 0.213 0.286
Other Protestant
= 1 if parents are other Protestant, = 0 otherwise