T H E J O U R N A L O F H U M A N R E S O U R C E S • 45 • 4
The Supply of Birth Control
Methods, Education, and Fertility
Evidence from Romania
Cristian Pop-Eleches
A B S T R A C T
This paper investigates the effect of the supply of birth control methods on fertility behavior by examining Romania’s 23-year period of pronatalist policies. Following the lifting of the restrictions in 1989 the immediate de-crease in fertility was 30 percent. Women who spent most of their repro-ductive years under the restrictive regime experienced increases in life-cycle fertility of about 0.5 children. Less-educated women had bigger increases in fertility after policy implementation and larger fertility de-creases following the lifting of restrictions. These findings suggest that ac-cess to abortion and birth control are significant determinants of fertility levels, particularly for less-educated women.
I. Introduction
The contribution of supply-side factors (access to abortion and mod-ern contraceptive methods) in the demographic transition associated with modmod-ern economic growth and development has been an important research question. Besides its intrinsic theoretical value, the answer to this question is of obvious policy interest because it is directly related to the debate on whether family planning programs
Cristian Pop-Eleches is an associate professor of economics and public policy at Columbia University. He is grateful to two anonymous referees, Abhijit Banerjee, Eli Berman, David Cutler, Esther Duflo, Claudia Goldin, Robin Greenwood, Larry Katz, Caroline Hoxby, Michael Kremer, Sarah Reber, Ben Olken, Emmanuel Saez, Andrei Shleifer, Tara Watson, and seminar participants at Berkeley, Chicago, Columbia, Harvard, Maryland, NEUDC, PAA, UCLA and UC San Diego for useful comments. The au-thor claims responsibility for all errors. Financial support from the Social Science Research Council Program in Applied Economics, the Center for International Development, the MacArthur Foundation, and the Davis Center at Harvard is gratefully acknowledged. The data used in this article can be ob-tained beginning six months after publication through three years hence from Cristian Pop-Eleches, De-partment of Economics and SIPA, Columbia University, 420West 118th Street, Rm. 1022 IAB MC 3308, New York, NY 10027, cp2124@columbia.edu.
[Submitted March 2006; accepted June 2009]
972 The Journal of Human Resources
have an effect on fertility. The debate tends to be polarized between those who believe that good family planning programs can work everywhere and those who contend that programs have little effect (Freedman and Freedman 1992). It has proven difficult to convincingly isolate the effects of family planning programs un-ambiguously from other possible factors that reduce fertility, given that the large decreases in fertility in many developing countries of the world in this century were associated with concurrent increases in education and labor market opportunities for women, decreases in mortality, and improvements in the technology and diffusion of birth controls methods (Gertler and Molynueax 1994 and Miller 2004).
Another open research question in demography is to understand how changes in access to abortion and birth control methods affect the fertility of women with different levels of education. Understanding the relationship between the supply of birth control methods, education and fertility could help understand the mechanisms that underlie the robust negative association between female education and fertility that has been established in many countries at different points in time. Moreover, if easy access to fertility control has a much larger effect on women with less edu-cation, then distributional goals could provide additional reason for the provision of methods of fertility control.
This paper uses Romania’s distinctive history of changes in access to birth control methods as a natural experiment to isolate and measure supply-side effects, and to test if they have a differential impact by educational levels. Between 1957 and 1966 Romania had a very liberal abortion policy and abortion was the main method of contraception. In 1966, the Romanian government abruptly made abortion and fam-ily planning illegal. This policy was sustained, with only minor modifications, until December 1989, when following the fall of communism, Romania reverted back to a liberal policy regarding abortion and modern contraceptives.
Previous work using the same Romanian context (Pop-Eleches 2006) has focused on socioeconomic outcomes of additional children born in 1967 as a result of the unexpected ban on abortions introduced at the end of 1966. After taking into con-sideration possible crowding effects due to the increase in cohort size, and compo-sition effects resulting from different use of abortions by certain socioeconomic groups, I provide evidence that children born after the ban on abortions had signifi-cantly worse schooling and labor market outcomes. While the focus in Pop-Eleches (2006) was on child outcomes, the present paper attempts to understand the impact of the Romanian abortion ban on female fertility. In related work, Levine and Staiger (2004) looking at changes in abortion policies in Eastern Europe in the 1980s and early 1990s find that in countries that changed from very restrictive regimes to liberal regimes had significant increases in pregnancies and abortions and decreases in births of about 10 percent . The present paper extents this work in a number of ways. First, unlike in other Eastern European countries, Romania restricted access not just to abortion but also to other birth control methods. Secondly, Romania’s 23-year period (1967–89) of restricted access to abortion and birth control methods also allows for an evaluation of the long-term fertility impacts of supply restrictions. Finally, the heterogeneous effect of the policy by educational status can be explored with detailed reproductive microdata.
Pop-Eleches 973
1989 in Romania, and to compare those outcomes with outcomes of similar women in neighboring Moldova. Since the majority of the population in Moldova is ethni-cally Romanian it is an appropriate comparison country. Furthermore, abortion and modern contraceptives were legally available in Moldova both before and during the economic transition that started in 1990. As additional evidence, I also will analyze monthly fertility patterns in Romania during 1990 to explore immediate effects six months after the announcement of the policy change. Finally, I also will examine longer-term patterns of fertility levels across policy regimes looking at cohorts of Romanian and Hungarian women in Romania, compared to similar co-horts from Hungary.
My analysis shows that the supply of birth control methods has a large effect on fertility levels and explains a large part of the fertility differentials across educational groups. In the short-run the lifting of the restrictive ban in 1989 decreased fertility by 30 percent. Results from Romania’s 23-year period of continued pronatalist pol-icies suggest large increases in lifecycle fertility for women who spent most of their reproductive years under the restrictive regime (about 0.5 children or a 25 percent increase). This result, which, given the nature of the policy, is an upper bound on the possible supply side effects of birth control methods, is significant especially given that women with 4 or more children had access to legal abortions. The data also show bigger increases in fertility for less-educated women after abortion was banned in the 1960s and larger fertility decreases when access restrictions were lifted after 1989. Indeed, after 1989 fertility differentials between educational groups de-creased by about 50 percent. These results are providing evidence for the important role played by supply-side factors in explaining fertility levels and the relationship between education and fertility.
The paper is organized as follows. Section II provides background information on the Romanian context. In Section III, I describe the data and the empirical strat-egies. Section IV presents the main results. The final section presents conclusions.
II. Abortion and birth control policies regimes in
Romania
During the period 1960–90 unusually high levels of legally induced abortions characterized the communist countries of Eastern Europe. These countries, following the lead of the Soviet Union, were among the first in the world to liberalize access to abortions in the late 1950s (David 1999). Compared to other countries in the region, Romania has long been a “special situation” in the field of demography and reproductive behavior because of the radical changes in policy concerning access to legal abortion (Baban 1999, p.191). Prior to 1966, Romania had the most liberal abortion policy in Europe and abortion was the most widely used method of birth control (World Bank 1992). In 1965, there were four abortions for every live birth (Berelson 1979).
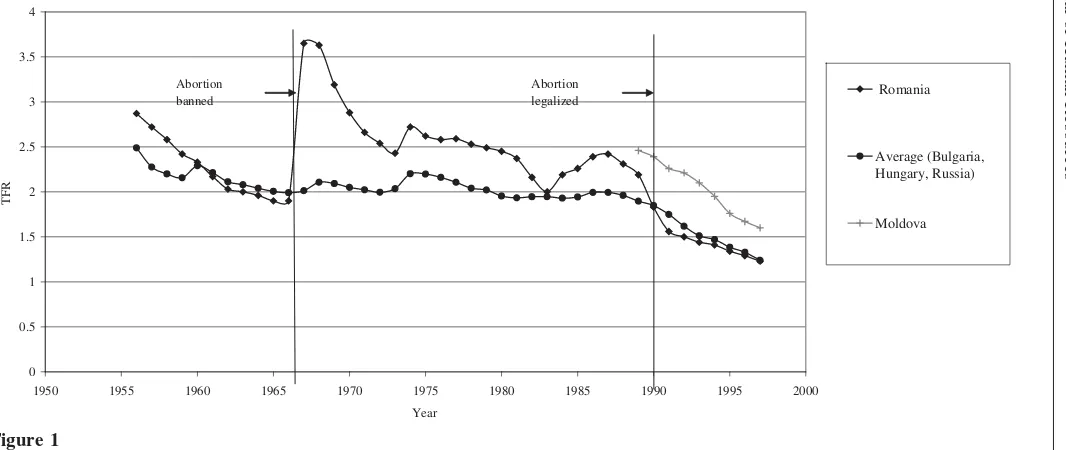
Worried about the rapid decrease in fertility1 in the early 1960s (see Figure 1)
Romania’s dictator, Nicolae Ceausescu, issued a surprise decree in October 1966:
974
The
Journal
of
Human
Resources
0 0.5 1 1.5 2 2.5 3 3.5 4
1950 1955 1960 1965 1970 1975 1980 1985 1990 1995 2000
Year
TFR
Romania
Average (Bulgaria, Hungary, Russia)
Moldova Abortion
banned
Abortion legalized
Figure 1
Total Fertility Rates
Pop-Eleches 975
Abortion and family planning were declared illegal and the immediate cessation of abortions was ordered. Legal abortions were allowed only for women over the age of 42, women with more than four children, women with health problems, and women with pregnancies resulting from rape or incest. At the same time, the import of modern contraceptives from abroad was suspended and the local production was reduced to a minimum (Kligman 1998).
The results were dramatic: Crude birth rates increased from 14.3 in 1966 to 27.4 in 1967 and the total fertility rate increased from 1.9 to 3.7 children per woman in the same period (Legge 1985). As can be seen in Figure 1, the large number of births continued for about 3–4 years, after which the fertility rate stabilized for almost 20 years, albeit at a higher level than the average fertility rates in Hungary, Bulgaria, and Russia. The law was strictly enforced until December 1989, when the communist government was overthrown.2This trend reversal was immediate with a
decline in the fertility rate and a sharp increase in the number of abortions. In 1990 alone, there were one million abortions in a country of only 22 million people (World Bank 1992). During the 1990s Romania’s fertility level displays a pattern remarkably similar to that of its neighbors.3
Following the introduction of the ban on abortions and modern contraceptives, the use of illegal abortions increased substantially. One good indicator of the extent of illegal abortions is the maternal mortality rate: While in 1966 Romania’s maternal mortality rate was similar to that of its neighbors, by the late 1980s the rate was ten times higher than any country in Europe (World Bank 1992).
This legislative history enables me to study how the changes in the supply of birth control methods affect the pregnancy, birth, and abortion behavior of women. The main part of the analysis uses the liberalization of access to abortion and con-traception in December 1989 as a natural experiment to estimate the effect of birth control methods on reproductive outcomes.
The government’s ban on abortions and modern contraception in 1966 also was accompanied by the introduction of limited pronatalist incentives. The main incen-tives provided were paid medical leaves during pregnancy and a one-time maternity grant of about $85, which is roughly equal to an average monthly wage income. The increases in the monthly child allowance provided by the government to each child was increased by $3, a very small amount compared to the cost of raising a child.4One potential concern with my identification strategy is that these financial
incentives, although very small in magnitude, might have changed the demand for children. Because my analysis will mainly focus on changes in fertility behavior following the liberalization of abortions and modern contraceptives in 1989, the
and social development and the availability of access to abortion as a method of birth control. Beginning with the 1950s, Romania enjoyed two decades of continued economic growth as well as large increases in educational achievements and labor force participation for both men and women.
976 The Journal of Human Resources
confounding effect of financial pronatalist incentives on fertility would be a potential worry only if the government had abolished these incentives concurrently with the liberalization of abortion and modern contraceptive methods. According to a study on the provision of social services in Romania (World Bank 1992), no major reforms had taken place in the provision of maternity and child benefits in the first three years following the fall of communism.
Because the liberalization of access to birth control methods in 1989 coincided with the start of the transition process, changes in fertility behavior also could be caused by changes in the demand for children due to the different social and eco-nomic environment following the fall of communism. Data from neighboring Mol-dova, which did not experience changes in abortion and contraceptive regime in this period, is used to account for possible changes in demand for children induced by the transition process. Finally, I will assess the robustness of the findings using data from the Romanian and Hungarian census, by comparing fertility behavior of women who spent different fractions of their reproductive years under the restrictive regime.
III. Data and econometric framework
The primary data set for the present analysis is the 1993 Romanian Reproductive Health Survey.5Conducted with technical assistance from the Center
for Disease Control, this survey is the first representative household-based survey designed to collect data on the reproductive behaviors of women aged 15–44 after the fall of communism. The survey covered each respondent’s socioeconomic char-acteristics, a history of all pregnancies and their outcomes (birth, abortion, miscar-riage etc.), and the planning status of the pregnancies (unwanted or not).
The data set has a number of important advantages for my purposes. First, the retrospective survey covers the reproductive outcomes of women both before and after the ban on abortions and birth control was lifted in December 1989. Secondly, at the time of the interviews in late 1993, abortions had already been legalized for a number of years, thus women were a lot more likely to report their use of illegal abortions prior to 1989. In fact, according to the Final Report of the Reproductive Health Survey (S¸erba˘nescu et al. 1995), the reporting of abortion levels in the survey prior to 1990 matches very closely government aggregate data on official, sponta-neous, and estimated illegal abortions.
Table 1 presents summary statistics for the main variables used in the study. About 24 percent of women finished only primary school, 63 percent attended at least some secondary school, and 13 percent had attended a tertiary education institution. The proportion of women with only primary education is larger (32 percent ) for women who are older than 30 years old and this reflects the increase in educational attain-ment over time in Romania. Because all the variables measuring educational and socioeconomic status are measured at the time of the survey in 1993, one potential worry is the endogeneity of these variables with respect to the reproductive outcomes measured in the period 1988–92. To deal with this issue, most of the analysis will
Pop-Eleches 977
Table 1
Summary Statistics for the 1993 Romanian Reproductive Health Survey
Education Socioeconomic Index
Primary 0.24 Low 0.33
Secondary 0.63 Medium 0.54
Tertiary 0.13 High 0.13
Before (1988–89) After (1991–92)
Total pregnancy rates
All 3.64 5.16
Primary 5.14 6.79
Secondary 3.32 4.81
Tertiary 2.54 3.93
Total birthrates
All 2.10 1.47
Primary 3.22 2.10
Secondary 1.93 1.38
Tertiary 1.41 1.02
Total abortion rates
All 1.16 3.42
Primary 1.54 4.40
Secondary 0.98 3.15
Tertiary 0.85 2.63
Notes: The sample of 4,861 observations is representative of the female population aged 15–44.
use a simple educational variable, indicating whether a person has more than primary education (eight years of schooling). Since the vast majority of Romanians finish primary school prior to age 15 and do not have children before that age, potential endogeneity issues are reduced to a minimum. The other more endogenous controls (such as socioeconomic status) also will be included in the analysis to test the robustness of the effect of education on reproductive outcomes.
978 The Journal of Human Resources
to control for potentially important religious and cultural factors. (Most of the ter-ritory of the Republic of Moldova and the northeastern region of Moldova in present day Romania share a common history prior to the Ribbentrop-Molotov Pact of 1939). Thirdly, Moldova also experienced the economic and political transition from com-munism in the 1990s. Since the fall in output and increase in poverty in Moldova during this period has been more drastic than in Romania,6the effect of economic
distress on fertility in Moldova was arguably larger, which would bias the results against finding an effect of changes in the supply of birth control methods. Finally, the Moldavian survey used in 1997 also was carried out under the technical assis-tance of the Center for Disease Control and its format is remarkably similar to the 1993 Romanian survey. Because the Moldavian data was collected for a sample of 5,412 women aged 15–44 in 1997,7 fertility behavior in the period 1988–92 can
only be studied for the age group 15–34. The information about each pregnancy outcome is less detailed than in the Romanian case and includes for each pregnancy just the outcome (birth, abortion, miscarriage etc.) and not the planning status (un-wanted or not).
The two additional sources used are a sample of the 1992 Romanian Census and the 1990 Hungarian Census. One of the census questions in both countries asks women about the number of children ever born and is thus a good measure of lifetime fertility for women older than 40 years old. The census data will be used to check some of the findings of fertility behavior by comparing the lifetime fertility of women who spent most of their reproductive years with access to birth control methods with that of women who spent most of their reproductive years under the restrictive regime. Finally, the 1992 Romanian census also will be used to calculate total fertility rates by education in the period 1988–91 using the Own-Children Method estimation developed by Cho et al. (1986).
To investigate how the liberalization of access to abortion and modern contracep-tion affects reproductive behavior, I estimate:
OUTCOME ⳱Ⳮ •education Ⳮ •afterⳭ •education •after
(1) it 0 1 it 2 t 3 it t
Ⳮ4•agegroup Ⳮ •agegroup •afterⳭε
it 5 it t it
is the number of pregnancies (or births or abortions) that occur to a OUTCOMEitr
particular person (i)in a given year ( . In some specifications, only unwanted out-t) comes will be analyzed. Education is a dummy measuring if an individual had more than primary school (more than eight years of schooling). After is dummy taking value 1 if an event occurred between 1991 and 1992, 0 otherwise. Finally, the regressions include 5agegroupdummies, with the 20–24 years dummy dropped. The unit of observation is a person year and the period of study is 1988–92, with year 1990 dropped since the fertility drop happened in the middle of the year. The sample includes all the women aged 15 or older in a particular year.
6. GDP per capita in Romania in 1999 was at 76 percent of the 1989 level, compared to only 31 percent in the case of Moldova (EBRD 2000).
Pop-Eleches 979
Within this framework, the overall impact of the change in abortion and modern contraception regime on the reproductive outcome of interest for the less educated (those with eight or fewer years of schooling) is captured by the coefficient2and the effect on the educated is Ⳮ.8 The difference in outcomes between less
2 3
educated and more educated women prior to the reform is captured by the coefficient , while the differential across educational groups after the reform is captured by 1
. 1Ⳮ3
IV. Results
A. Graphical analysis and regression results
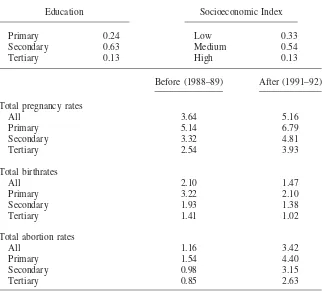
The overall impact of the liberalization of abortions and modern contraception in December 1989 can be illustrated visually.9Figure 2 shows the total pregnancy rate10
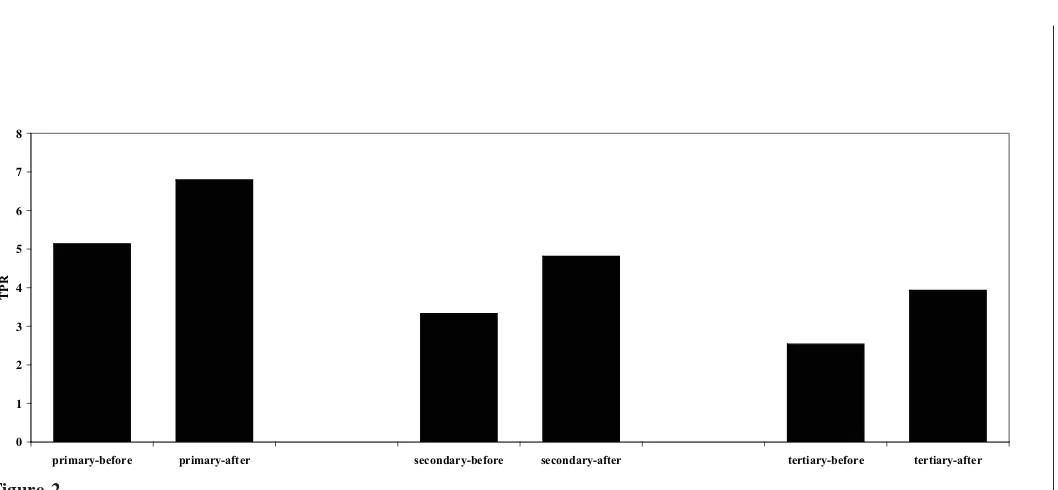
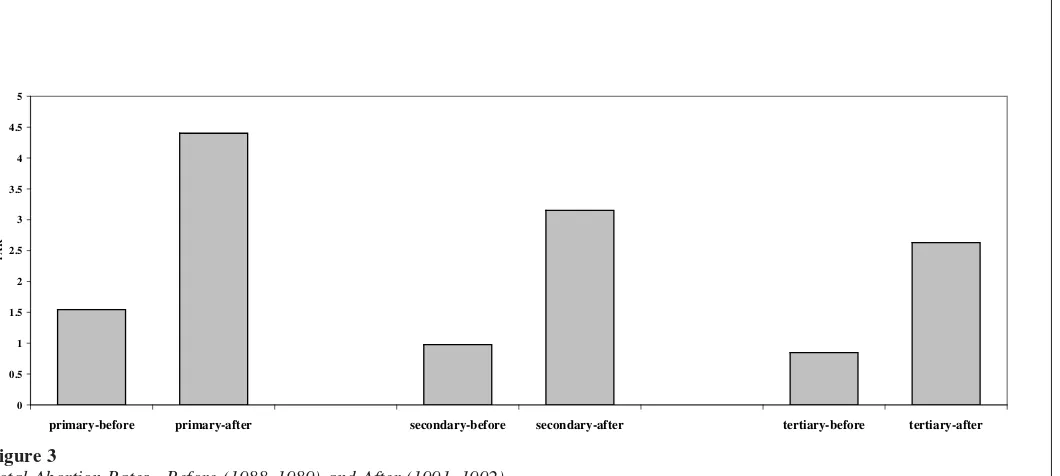
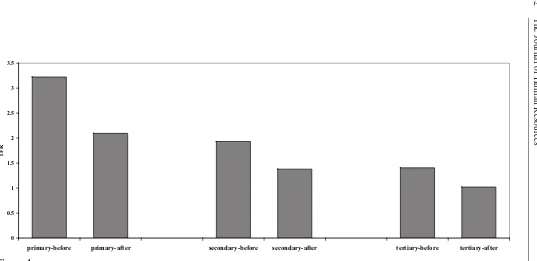
for three educational groups during the two years prior to the policy change (1988– 89) in comparison to the period 1991–92. The pattern of change in pregnancy be-havior is similar across groups: women of primary, secondary and tertiary education experience large increases in their total pregnancy rate of about 1.5. Figure 4 shows the total fertility rate for the three groups. While all the groups experienced decreases in fertility after 1990, the effect is uneven across groups. For women of secondary education, the decrease in fertility is from 1.93 to 1.38 children, while for university-educated women the decrease is from 1.41 to 1.02 children. The overall impact on women with primary education is a lot larger and goes from 3.22 to 2.10 children. Because pregnancy rates increased similarly across groups after the policy change while the birth rates decreased more for the uneducated population, one expects abortions to have increased more for the uneducated women. Figure 3 confirms this outcome: Women with primary education had an increase in their total abortion rate of 2.86, while the increase for the more educated groups was much smaller (2.17 for secondary and 1.78 for tertiary education). Since women with secondary and tertiary education experienced similar fertility responses to the policy, for the rest of the paper they will not be analyzed separately.11
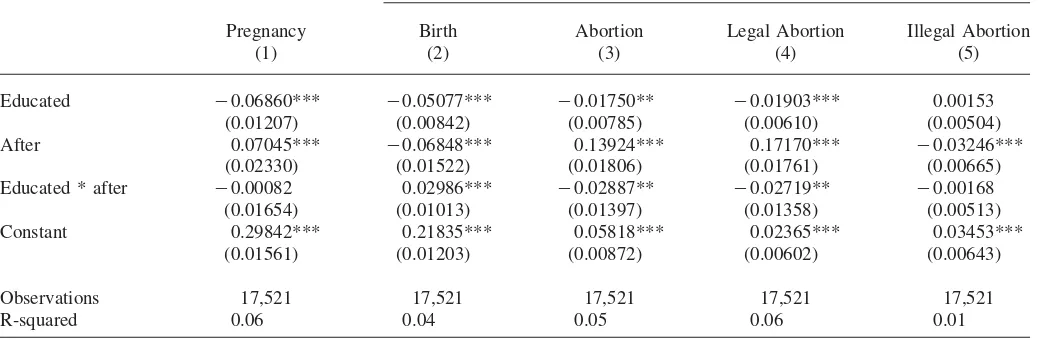
Table 2 presents the first set of regression estimates for the impact of the policy change on reproductive behavior for the basic Equation 1. Each column in the table reflects the effect on a particular outcome. The first three columns confirm the graph-ical analysis: Columns 1–3 reflect the large increases in pregnancies and abortion
8. To be more precise, the coefficients refer to the impact of the policy on the age group 20–24. 9. See also S¸erba˘nescu et al. (1995a) and S¸erba˘nescu et al. (1995b) for a discussion of the impact of the policy change after 1989 in Romania.
10. The total pregnancy rate is the average total number of pregnancies that would be born per woman in her lifetime, assuming no mortality in the childbearing ages, calculated from the age distribution and age-specific pregnancy rates of a specified group in a given reference period (United Nations 2002). The total fertility rate (TFR) and total abortion rate (TAR) are defined in a similar way.
980
The
Journal
of
Human
Resources
0 1 2 3 4 5 6 7 8
primary-before primary-after secondary-before secondary-after tertiary-before tertiary-after
TPR
Figure 2
Total Pregnancy Rates—Before (1988–1989) and After (1991–1992)
Pop-Eleches
981
0 0.5 1 1.5 2 2.5 3 3.5 4 4.5 5
primary-before primary-after secondary-before secondary-after tertiary-before tertiary-after
TAR
Figure 3
Total Abortion Rates—Before (1988–1989) and After (1991–1992)
982
The
Journal
of
Human
Resources
0 0.5 1 1.5 2 2.5 3 3.5
primary-before primary-after secondary-before secondary-after tertiary-before tertiary-after
TFR
Figure 4
Total Fertility Rates—Before (1988–1989) and After (1991–1992)
Pop-Eleches
983
Table 2
Determinants of Pregnancy Outcomes
Dependent variable Pregnancy ending in
Pregnancy Birth Abortion Legal Abortion Illegal Abortion
(1) (2) (3) (4) (5)
Educated ⳮ0.06860*** ⳮ0.05077*** ⳮ0.01750** ⳮ0.01903*** 0.00153 (0.01207) (0.00842) (0.00785) (0.00610) (0.00504) After 0.07045*** ⳮ0.06848*** 0.13924*** 0.17170*** ⳮ0.03246***
(0.02330) (0.01522) (0.01806) (0.01761) (0.00665) Educated * after ⳮ0.00082 0.02986*** ⳮ0.02887** ⳮ0.02719** ⳮ0.00168
(0.01654) (0.01013) (0.01397) (0.01358) (0.00513) Constant 0.29842*** 0.21835*** 0.05818*** 0.02365*** 0.03453***
(0.01561) (0.01203) (0.00872) (0.00602) (0.00643)
Observations 17,521 17,521 17,521 17,521 17,521
R-squared 0.06 0.04 0.05 0.06 0.01
984 The Journal of Human Resources
after 1990 and the large decreases in fertility during this period.12The coefficient
in the birth regression on after is -0.068 implying that for uneducated women in the age group 20–24 the yearly decrease in the probability of giving birth after the lifting of the ban was 7 percent.13 At the same time, the impact was differential
across educational groups: the interaction of educationandafter in Column 2 is large and positive for the births regression (0.029) and more than twice as large as the coefficient on education (ⳮ0.051). These results represent the two main findings of this paper: (1) the supply of birth control methods has a large impact on fertility levels and (2) it explains a large part (more than 50 percent in this specification) of the fertility differential between educated and uneducated women.14
Columns 4 and 5 of Table 2 analyze the pregnancies ending in abortions in more detail. In Column 3 one observes a reduction in the overall number of abortions Column 4 presents the results for legal abortions, which prior to the reform were allowed either for medical reasons or for women older than 45 or with more than five children.15In Column 5 a similar regression is presented for illegal or provoked
abortions. The results confirm the large increases in legal abortions and the virtual disappearance of illegal abortions after the policy change, since the coefficient on after in the last column of Table 2 is similar in size to the constant.
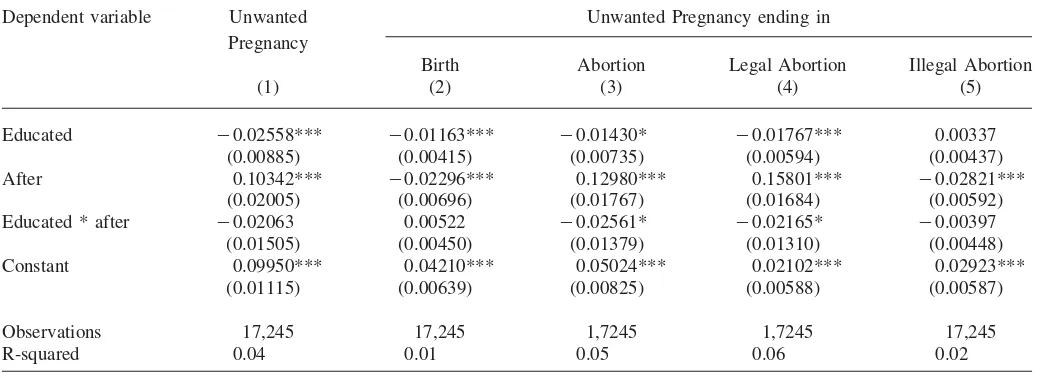
Table 3 studies pregnancy outcomes identified by the respondents as “unwanted”. The use of unwanted pregnancy outcomes would be better suited for the current analysis if respondents would ex post truthfully reveal the planning status of their pregnancies. A comparison of the results in Table 2 and 3 seems to imply that women tend to underreport unwanted births given that the coefficients onafterand the interaction ofeducationandafterare much larger for births than for unwanted births.16 However, the corresponding coefficients in the abortion regressions are
remarkably similar in size.
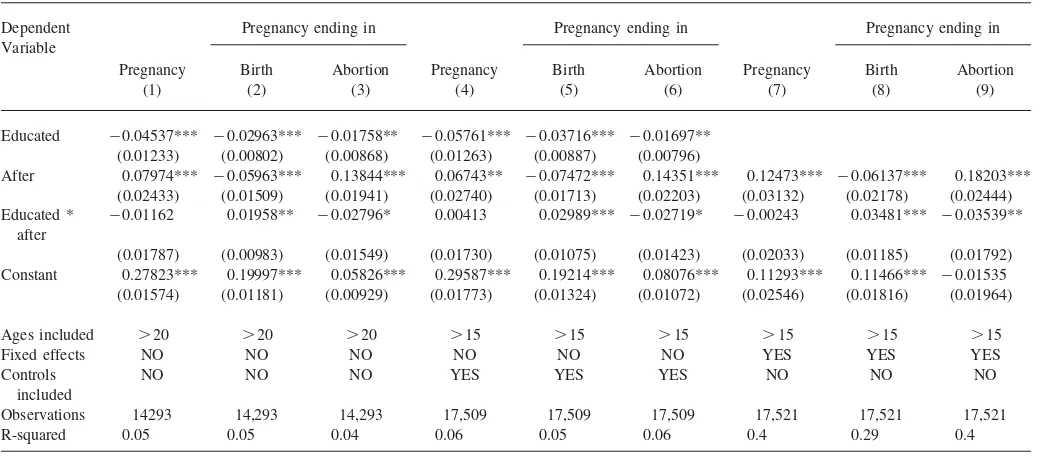
The models used so far do not control for other measures of socioeconomic status that are likely to be correlated with our education variable and could have an in-dependent effect on the pregnancy outcomes. For example, educated women are more likely to live in higher income or urban families, which could facilitate easier access to abortion under a restrictive regime. In Columns 4–6 of Table 4, I present regressions, which include a number of controls (a socioeconomic index for basic household amenities as well as urban, region, and religion dummies) and their
re-12. The current analysis only measures the effect of the policy change on changes in fertility levels. An alternative approach would be to analyze percentage changes in fertility as a result of the policy change. The effects are similar but smaller in magnitude to the level effects: Less-educated women have larger percentage changes in fertility.
13. The results in the first three columns of the table are in line with Levine and Staiger (2002), who view abortion as an insurance mechanism that protects women from unwanted births: a decrease in the cost of abortion increases abortion and pregnancy rates and reduces birth rates.
14. The impact of the change in policy on pregnancy, birth, and abortion behavior was similar across age groups, particularly for women aged 20 to 34, who have most pregnancies and births.
15. It is likely that a large number of abortions prior to 1990 were illegal but reported as legal by the respondents. In fact, a large number of non-medical abortions reported as legal by the respondents did not occur to women over 40 or with more than 4 children.
Pop-Eleches
985
Table 3
Determinants of Unwanted Pregnancy Outcomes
Dependent variable Unwanted Unwanted Pregnancy ending in Pregnancy
Birth Abortion Legal Abortion Illegal Abortion
(1) (2) (3) (4) (5)
Educated ⳮ0.02558*** ⳮ0.01163*** ⳮ0.01430* ⳮ0.01767*** 0.00337 (0.00885) (0.00415) (0.00735) (0.00594) (0.00437) After 0.10342*** ⳮ0.02296*** 0.12980*** 0.15801*** ⳮ0.02821***
(0.02005) (0.00696) (0.01767) (0.01684) (0.00592) Educated * after ⳮ0.02063 0.00522 ⳮ0.02561* ⳮ0.02165* ⳮ0.00397
(0.01505) (0.00450) (0.01379) (0.01310) (0.00448) Constant 0.09950*** 0.04210*** 0.05024*** 0.02102*** 0.02923***
(0.01115) (0.00639) (0.00825) (0.00588) (0.00587)
Observations 17,245 17,245 1,7245 1,7245 17,245
R-squared 0.04 0.01 0.05 0.06 0.02
986
The
Journal
of
Human
Resources
Table 4
Determinants of Pregnancy Outcomes—Robustness
Dependent Variable
Pregnancy ending in Pregnancy ending in Pregnancy ending in
Pregnancy Birth Abortion Pregnancy Birth Abortion Pregnancy Birth Abortion
(1) (2) (3) (4) (5) (6) (7) (8) (9)
Educated ⳮ0.04537*** ⳮ0.02963*** ⳮ0.01758** ⳮ0.05761*** ⳮ0.03716*** ⳮ0.01697**
(0.01233) (0.00802) (0.00868) (0.01263) (0.00887) (0.00796)
After 0.07974*** ⳮ0.05963*** 0.13844*** 0.06743** ⳮ0.07472*** 0.14351*** 0.12473*** ⳮ0.06137*** 0.18203***
(0.02433) (0.01509) (0.01941) (0.02740) (0.01713) (0.02203) (0.03132) (0.02178) (0.02444)
Educated * after
ⳮ0.01162 0.01958** ⳮ0.02796* 0.00413 0.02989*** ⳮ0.02719* ⳮ0.00243 0.03481*** ⳮ0.03539**
(0.01787) (0.00983) (0.01549) (0.01730) (0.01075) (0.01423) (0.02033) (0.01185) (0.01792)
Constant 0.27823*** 0.19997*** 0.05826*** 0.29587*** 0.19214*** 0.08076*** 0.11293*** 0.11466*** ⳮ0.01535
(0.01574) (0.01181) (0.00929) (0.01773) (0.01324) (0.01072) (0.02546) (0.01816) (0.01964)
Ages included 20 20 20 15 15 15 15 15 15
Fixed effects NO NO NO NO NO NO YES YES YES
Controls included
NO NO NO YES YES YES NO NO NO
Observations 14293 14,293 14,293 17,509 17,509 17,509 17,521 17,521 17,521
R-squared 0.05 0.05 0.04 0.06 0.05 0.06 0.4 0.29 0.4
Pop-Eleches 987
spective interactions with after.17 The coefficients on education after, and the
interaction ofeducationandafterdo not change significantly once we include these controls into the regression framework. Despite the robustness of the results to the inclusion of observable controls, one cannot rule out the existence of unobserved “ability” bias in these regressions. However, information on whether women with more education acquired or were born with different skills to control their fertility levels should not be important for targeting family planning programs or for under-standing the distributional effects of such programs.18
Another potential worry is that of reverse causality, given that the birth of a child may have a negative effect on a woman’s educational achievement (Katz and Goldin 2002). Since the vast majority of Romanians finish primary school prior to age 15 and do not have children before that age, this effect is potentially very small. To deal with this issue, the regressions for pregnancy and births are estimated again restricting the sample to individuals aged 20 or higher during each risk period. The coefficients in Columns 1–3 of Table 4 are very similar to the earlier results. As an additional robustness check, Columns 7–9 of Table 4 analyze the effect of the policy regime on fertility behavior by using fixed effects regressions. The coefficients on
and the interaction of and are comparable in sign, size, and
after education after
significance to the earlier results and hence appear to confirm our previous findings.
B. Economic transition versus birth control access: comparison with Moldova
An alternative hypothesis for changes in fertility behavior in Romania after 1990 arises from changes in the demand for children due to the different social and eco-nomic environment following the fall of communism. This effect might be poten-tially important given that basically all former communist countries experienced decreases in fertility, which have been attributed to adverse social and economic conditions during the transition years (David et al. 1997).19To assess this alternative
interpretation, I use similar data to compare changes in Romania and Moldova, a former Soviet Republic that did allow free access to abortion and modern contra-ception throughout this period and where Romanians are the largest ethnic group.
I estimate a variant of Equation 1 that uses similar micro data from Romania and Moldova:
17. There is of course the potential worry about the endogeneity of these controls because they are mea-sured at the time of the survey and thus after the pregnancy outcomes have occurred.
988 The Journal of Human Resources
whereeducation,afterandagegroup are the same as before andromaniaindicates that an observation is from the Romanian data.20OUTCOME is the number of
itr
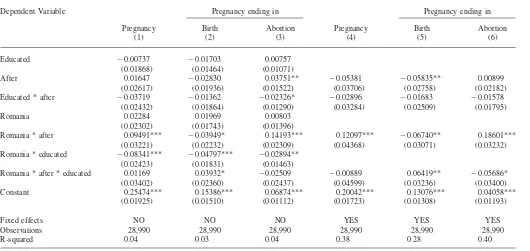
pregnancies (or births or abortions) that occur to a particular person (i)in a given year (t)in a given country ( . The time period covered is 1988–89 and 1991–92.r) In this specification the coefficients of interest (5,6and7) describe the responses in reproductive behavior after 1990 for different educational groups that are partic-ular for Romania after controlling for common trends in the two countries.
Estimates of Equation 2 shown in Table 5, confirm the robustness of the earlier results. In the birth regression reported in Column 2 of Table 5 the coefficient5
(romania•after) is negative and significant indicating that the decrease in fertility was larger in Romania relative to Moldova after the fall of communism. Similarly, the coefficient7 (romania•after•education) is positive and significant and thus implies that the decrease in births was more pronounced for the uneducated group in Romania. Column 5 of Table 5 presents results using a fixed-effects specification that are very similar to those in Column 2 of the same table. Similar regressions using pregnancies ending in abortions (Columns 3 and 6 of Table 5) are consistent with our earlier results, although7(romania•after•education) is significant only in the fixed-effects specification. In Table 5, I used the first year (1990) of sharp decline in GDP to date the start of the transition process in both countries. As a specification test I have run similar regression models where Moldova’s transition is defined to start in 1991, the year the country declared its independence from the Soviet Union. The results (not reported) are similar to those presented in Table 5 although the triple interaction (romania•after•education) while still economically sizable is not quite significant at conventional levels (p-value of 0.17).
However, the estimates in Table 5 do indicate that some of the decreases in fertility after 1990 can be attributed to changes in demand for children possibly due to the negative impact of the transition process. The coefficient onafteris negative and large (and significant in the fixed effects specification) and they imply that Moldova also experienced decreases in fertility during this time. However, the in-teraction of education and after is negative suggesting that if anything demand driven factors would widen fertility differentials across educational groups.21
C. The immediate fertility response in Romania in 1990
An additional way to separate the effect of the lifting of the ban on birth controls methods on fertility in Romania after 1990 from the confounding effect of the po-litical and economic changes during the transition period is to analyze the fertility response in the months immediately following the policy change. Assuming that the population has immediate access to information about the lift of the ban and that hospitals do not face supply constraints in offering abortion services, the fertility impact should be observed immediately after June of 1990, that is six months after the announcement of the policy change in December of 1989. The six-month lag
20. The external validity of the education variable in this regression is an additional concern if the selection into different educational levels differs between Romania and Moldova.
Pop-Eleches
989
Table 5
Determinants of Pregnancy Outcomes—Romania versus Moldova
Dependent Variable Pregnancy ending in Pregnancy ending in
Pregnancy Birth Abortion Pregnancy Birth Abortion
(1) (2) (3) (4) (5) (6)
Educated ⳮ0.00737 ⳮ0.01703 0.00757
(0.01868) (0.01464) (0.01071)
After 0.01647 ⳮ0.02830 0.03751** ⳮ0.05381 ⳮ0.05835** 0.00899
(0.02617) (0.01936) (0.01522) (0.03706) (0.02758) (0.02182)
Educated * after ⳮ0.03719 ⳮ0.01362 ⳮ0.02326* ⳮ0.02896 ⳮ0.01683 ⳮ0.01578
(0.02432) (0.01864) (0.01290) (0.03284) (0.02509) (0.01795)
Romania 0.02284 0.01969 0.00803
(0.02302) (0.01743) (0.01396)
Romania * after 0.09491*** ⳮ0.03949* 0.14193*** 0.12097*** ⳮ0.06740** 0.18601***
(0.03221) (0.02232) (0.02309) (0.04368) (0.03071) (0.03232)
Romania * educated ⳮ0.08341*** ⳮ0.04797*** ⳮ0.02894**
(0.02423) (0.01831) (0.01463)
Romania * after * educated 0.01169 0.03932* ⳮ0.02509 ⳮ0.00889 0.06419** ⳮ0.05686*
(0.03402) (0.02360) (0.02437) (0.04599) (0.03236) (0.03400)
Constant 0.25474*** 0.15386*** 0.06874*** 0.20042*** 0.13076*** 0.04058***
(0.01925) (0.01510) (0.01112) (0.01723) (0.01308) (0.01193)
Fixed effects NO NO NO YES YES YES
Observations 28,990 28,990 28,990 28,990 28,990 28,990
R-squared 0.04 0.03 0.04 0.38 0.28 0.40
990 The Journal of Human Resources
between policy announcement and the fertility response results from the fact that a pregnancy lasts about nine months and abortions are generally performed within the first three months of pregnancy.
The economic and political transition could have two different effects on fertility behavior. The first effect could be immediate after the regime change and would reflect the change in expectations about the future as a results of the change from a repressive regime to a democratic society. The second effect is potentially more gradual and would reflect how the continuing worsening in socioeconomic condi-tions (unemployment, income, social insurance) affects the decision to have children. The consensus among demographers working in Eastern Europe (David 1999) is that in no countries where access to birth control methods was easily available was the fall in communism associated with a change fall in fertility in the year of regime change. Instead the decline in fertility during transition was gradual in the region and reflected the continuous worsening of economic conditions.
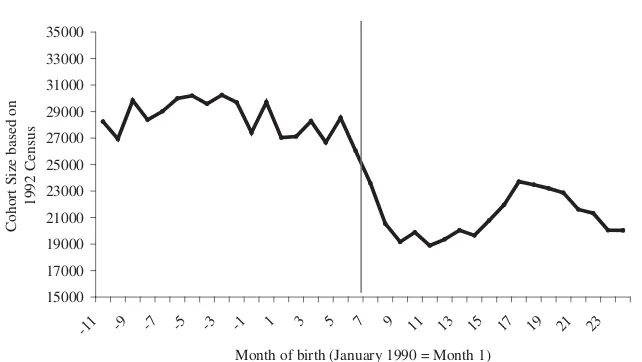
While the Romanian Reproductive Health Survey does not have a large enough sample to study the fertility changes in Romania in 1990 in fine detail, I make use of the 1992 Romanian Census to shed light on the dynamics of the response. Figure 5 plots the number of children born in a particular months for the period 1989–91. One can observe an abrupt one-time drop in fertility of about 30 percent starting six months after the lift of the ban (July of 1990) without any apparent trend in the birth rates during this period. In addition we use the Own Children Method of fertility estimation,22 by matching children to mothers in the data and scaling the
number of births by the number of women of reproductive age, to calculate fertility rates by the education of the mothers. Figure 6 presents the monthly total fertility rates23by education groups for the period January 1988 to December 1991.24The
results provide convincing evidence that the fertility response was a lot larger for women with primary education and provides evidence on a large reduction in the fertility gap between educational groups following the reform. Figures 5 and 6 also highlight that fertility rates are stable and not trending in the period prior to the policy change. In sum, these results provide additional evidence that the patterns of fertility changes are the results of changes in access to birth control methods and are unlikely driven by the confounding effects of the transition period.25
D. Long-term impact of the restrictive policy
The two main findings of the analysis so far, namely that the lift of the ban on abortions and modern contraception methods was associated with large decreases in fertility and a significant reduction in the fertility differential between education groups, are based on short-term responses to the sudden change in policy. An al-ternative way to check the robustness of these results is to track changes in fertility
22. This method was developed by demographers (Cho et al. 1986) to measure fertility rates with the help of census data in countries where birth records are not readily available.
23. The monthly TFR is calculated just like the commonly used yearly TFR, but the reference period is the month rather than the year.
Pop-Eleches 991
15000 17000 19000 21000 23000 25000 27000 29000 31000 33000 35000
-11 -9 -7 -5 -3 -1 1 3 5 7 9 11 13 15 17 19 21 23
Month of birth (January 1990 = Month 1)
Cohort Size based on
1992 Census
Figure 5
Cohort Size for Children Born 1989–1991
Notes: The monthly size of cohorts in Romania in the period 1989–1991 are based on the 1992 Romanian Census.
levels over time for women who have spend different fractions of their reproductive years during the 23-year period (1966–89) of restrictive access to contraception. One would naturally expect the long-term implications of the restrictive policy in 1966 to have produced the opposite effect: increases in overall birth levels and larger differentials between educated and uneducated women for those cohorts who spend more time affected by the restrictive policy. One caveat with the interpretation of these longer-term fertility effects is that they might be driven not just by changes in the supply of birth control methods but also by the pronatalist demand type incentives introduced by the government after 1966. As argued earlier, these incen-tives were small and therefore unlikely to affect fertility levels by a lot.
Similarly to the previous section an attempt is made to establish what would have happened in the absence of the restrictive policy by selecting a comparison popu-lation that displays close similarities to the treated group. A good comparison group for whom data is available is the Hungarian population living in Romania and the population of Hungary.26The Hungarian population living in Hungary and in the
Romanian region of Transylvania shared a common economic, cultural, social, and religious tradition within the borders of the Austrian Hungarian empire until 1918, when Transylvania became part of Romania. At the same time both countries had communist governments after World War II with similar development trajectories but different population policies, since access to birth control methods was easily available in Hungary throughout this period.
992
The
Journal
of
Human
Resources
0 0.5 1 1.5 2 2.5 3 3.5 4 4.5 5
-24 -22 -20 -18 -16 -14 -12 -10 -8 -6 -4 -2 0 2 4 6 8 10 12 14 16 18 20 22 24
MONTH (0=JANUARY 1990)
TFR
educated
noneducated
Figure 6
Monthly Total Fertility Rate in Romania from 1988 to 1991
Pop-Eleches 993
1 1.5 2 2.5 3
1915 1920 1925 1930 1935 1940 1945 1950 1955
YEAR OF BIRTH
CHILDREN EVER BORN (MEAN)
Romania overall Hungarians in Romania overall Hungary overall
Figure 7
Fertility Levels of Women Born Between 1900–1955
Notes: This graph plots the average number of children born in Romania by year of birth of the mother. Similar data is shown for the Hungarian minority in Romania and for Hungary. Hungary did not implement a similar restriction during this time period. Source: 1992 Romanian Census, 1990 Hungarian Census.
994 The Journal of Human Resources
decreased demand for children. To account for these demand changes, Figure 7 also plots the mean number of children born to Hungarians living in Romania (from the 1992 Romanian census) and to the population in Hungary (from the 1990 Hungarian census). The figure shows similar trends in fertility for Hungarians in both countries for women born prior to 1930 as well as the divergence in fertility levels afterward.27
A comparison of fertility levels of cohorts in Romania and Hungary born around 1930 and 1950 show that women who spent most of their reproductive years under the restrictive regime had a lifetime increase in fertility of about 0.5 children or a 25 percent increase.28The magnitude of this result is large given that women with
four or more children had access to legal abortions, and it provides, given the nature of the policy, an upper bound on the possible supply-side effects of birth control methods. Since the short-run responses in birth rates following the lift of the ban might overstate the longterm fertility impact of the policy, these results from the census data provides a better way to establish the lifecycle fertility impacts.
Figure 8 presents evidence of increases in the fertility differential between edu-cated and uneduedu-cated women in Romania over time.29The fertility differential
be-tween educated and uneducated women experienced a gradual decline over time for cohorts born prior to 1930 followed by a gradual increase for cohorts born afterward. The differential almost doubled from about 0.5 to 1 child when comparing cohorts born around 1930 and 1950 and is consistent with my earlier results. Taken together the results provide additional support for the important role played by the supply of birth control methods in explaining fertility levels and the relationship between edu-cation and fertility.
V. Conclusion
The effect of the supply of birth control methods on fertility and its differential impact across educational groups has received wide attention from de-mographers and economists around the world. However, an empirical investigation of these issues requires a source of variation in the cost of birth control methods that is orthogonal to the demand for children.
In this paper, I argue that the introduction (in 1967) and the repeal (in 1989) of pronatalist policies in Romania, which drastically restricted access to abortion and other contraceptives for large groups of women, provide a useful source of variation in the cost of birth control methods. Using data from a variety of sources I provide evidence that these pronatalist policies caused large increases in fertility. The data reveal larger fertility increases for less-educated women after birth control restric-tions were introduced and larger fertility decreases when access restricrestric-tions were
27. The similarity in trends for women born prior to 1930 provides additional support that the population of Hungary is a good comparison group.
28. In regressions not reported in the paper, we have confirmed the magnitude of the results presented in Figure 7.
Pop-Eleches 995
1915 1920 1925 1930 1935 1940 1945 1950 1955
YEAR OF BIRTH
Fertility Levels in Romania by Education
Notes: This graph plots the average number of children born by year of birth of the mother and educational level. Source: 1992 Romanian Census, 1990 Hungarian Census.
lifted after 1989. These findings show the significant importance that the supply of birth control methods play in understanding fertility levels and the effect of education on fertility.
996 The Journal of Human Resources
References
Ananat , Elizabeth Oltmans, Jonathan Gruber, and Phillip Levine. 2007. “Abortion Legalization and Life-Cycle Fertility.”Journal of Human Resources42(2):375–97. Angrist, Joshua, and William Evans. 2000. “Schooling and Labor Market Consequences of
the 1970 State Abortion Reforms.” InResearch in Labor Economics, Vol. 18, ed. S. W. Polachek and John Robst, 75–114. London: JAI Press Inc.
Baban, Adriana. 1999. “From Abortion to Contraception—Romanian Experience.” InFrom Abortion to Contraception, ed. David, Henry. London: Greenwood Press.
Becker, Gary. 1960. “An Economic Analysis of Fertility.” InDemographic and Economic Change in Developed Countries, Universities-National Bureau Conference Series 11, 225–56. Princeton: Princeton University Press.
———. 1981. A Treatise on the Family. Cambridge: Harvard University Press. Becker, Gary, and Gregg Lewis. 1973. “On the Interaction Between the Quantity and
Quality of Children.”Journal of Political Economy81(2, Part II): S279-S288. Berelson, Bernard. 1979. “Romania’s 1966 Anti-Abortion Decree: The Demographic
Experience of the First Decade.”Population Studies33(2):209–22.
Birdsall, Nancy. 1989. “Economic Approaches to Population Growth.” InHandbook of Development Economics,Vol. I, ed. H. Chenery and T. N. Srinivasan, 477–542. Amsterdam: North-Holland.
Bongaarts, John. 1994. “The Impact of Population Policies: Comment.”Population and Development Review20(3):616–20.
Cho, Lee-Jay, Robert Retherford, and Minja Kim Choe. 1986.The Own-Children Method of Fertility Estimation. Population Institute, Honolulu: East-West Centre Book.
David, Henry, ed. 1999.From Abortion to Contraception. London: Greenwood Press. Easterlin, Richard. 1978. “The Economics and Sociology of Fertility: A Synthesis” In
Historical Studies of Changing Fertility, ed. C. Tilley. Princeton: Princeton University Press.
Easterlin, Richard, Robert Pollak, and Michael Wachter. 1980. “Toward a More General Economic Model of Fertility Determination.” InPopulation and Economic Change in Developing Countries, ed. Richard Easterlin. Chicago: University of Chicago Press. EBRD (European Bank for Reconstruction and Development). 2000.Transition Report
2000, London.
Freedman, Ronald, and D. Freedman. 1992. “The Role of Family Planning Programmes as a Fertility Determinant.”’ InFamily Planning Programmes and Fertility, ed. James Philips and John Ross. Oxford: Oxford University Press.
Gertler, Paul, and John Molynueax. 1994. “How Economic Development and Family Planning Programs Combined to Reduce Indonesian Fertility.”Demography31(1):33–63. Goldin, Claudia, and Katz, Lawrence. 2002. “The Power of the Pill: Oral Contraceptives
and Women’s Career and Marriage Decisions.”Journal of Political Economy110(4):730– 70.
Kligman, Gail. 1998.The Politics of Duplicity: Controlling Reproduction in Ceausescu’s Romania. Berkeley, Calif.: University of California Press.
Knowles, James, John Akin, and David Guilkey. 1994. “The Impact of Population Policies: Comment.”Population and Development Review20(3):611–15.
Legge, Jerome. 1985.Abortion Policy: An Evaluation of the Consequences for Maternal and Infant Health. Albany: State University of New York Press.
Levine, Phillip, Douglas Staiger, Thomas Kane, and David Zimmerman. 1999. “Roe v. Wade and American Fertility.”American Journal of Public Health89(2):199–203. Levine, Phillip, and Douglas Staiger. 2002. “Abortion as Insurance.” NBER working paper,
Pop-Eleches 997
———. 2004. “Abortion Policy and Fertility Outcomes: The Eastern European Experience.”
Journal of Law and Economics47(1):223–43.
Miller, Grant. 2004. “Contraception as Development? New Evidence from Family Planning in Colombia.” Cambridge, Mass. : Harvard University. Unpublished.
Peltzman, Sam. 1975. “The Effects of Safety Regulation.”Journal of Political Economy
83(4):677–725.
Pop-Eleches, Cristian. 2006. “The Impact of a Change in Abortion Regime on
SocioEconomic Outcomes of Children: Evidence from Romania.”Journal of Political Economy114(4):744–73.
Pritchett, Lent. 1994. “Desired Fertility and the Impact of Population Policies.”Population and Development Review20(1):1–55.
Rosenzweig, Mark, and T. Paul Schultz. 1989. “Schooling, Information and Non-Market Productivity: Contraceptive Use and Its Effectiveness.”International Economic Review
30:457–77.
Schultz, Theodore William. 1964.Transforming Traditional Agriculture. New Haven, Conn.: Yale University Press.
S¸erba˘nescu, Florina, Leo Morris, Mihai Stratila and Octavien Bivol.1998. “Reproductive Health Survey, Moldova 1997.”Final Report. Atlanta: Centers for Disease Control. S¸erba˘nescu, Florina, Paul Stupp and Leo Morris.. 1995.Reproductive Health Survey,
Romania 1993, Final Report. Atlanta: Centers for Disease Control.
S¸erba˘nescu, Florina, Leo Morris, Paul Stupp, and Alin Stanescu. 1995. “The Impact of Recent Policy Changes on Fertility, Abortion, and Contraceptive use in Romania.”
Studies in Family Planning26:76–87
Welch, Finis. 1970. “Education in Production.”Journal of Political Economy78(1):35–59. World Bank. 1992.Romania: Human Resources and the Transition to a Market Economy.
Country Study. Washington, D.C. : World Bank.