Monitoring Parks Through Remote Sensing: Studies
in Nepal and Honduras
HARINI NAGENDRA* CATHERINE TUCKER LAURA CARLSON
Center for the Study of Institutions, Population, and Environmental Change (CIPEC)
Indiana University 408 N.Indiana Avenue
Bloomington, Indiana 47408, USA
JANE SOUTHWORTH
Department of Geography and the Land Use and Environmental Change Institute (LUECI)
University of Florida 3141 TUR
P.O.Box 117315
Gainesville, Florida 32611-7315, USA
MUKUNDA KARMACHARYA BIRENDRA KARNA
Nepal Forestry Resources and Institutions Research Program Kathmandu, Nepal
ABSTRACT / The effectiveness of parks as management regimes is hotly contested.Much of the current discussion centered around comparisons of management regimes can be traced to a dearth of cross-site quantitative evaluations.
Remote sensing provides a particularly effective tool for this purpose, yet analysis of remotely sensed data requires fieldwork to interpret human activities and the socioeco-nomic and political contexts that relate to land cover change. This paper examines the effect of establishment of the Cel-aque National Park, Honduras, and the Royal Chitwan Na-tional Park buffer zone, Nepal, on limiting deforestation.In Celaque, the park itself has been largely successful in maintaining forest cover.However, recent changes in land use patterns have led to increasing pressure on the park boundaries, exacerbated by the lack of involvement of local residents.In the Royal Chitwan National Park, in contrast, participatory approaches towards co-management have been implemented over the past decade in the park buffer zone.With significant incomes derived from ecotourism, complete protection of the buffer zone forest has been adopted, leading to significant regrowth of tree cover. However, local decision-making power is limited, and buffer zone management has largely proven successful due to the investment and support provided by international donor agencies.These two case studies demonstrate the utility of remote sensing and Geographical Information Systems analysis in providing a spatiotemporal perspective for assessing management policies.They also demonstrate the importance of fieldwork to provide a nuanced understanding of the socioeconomic and institutional conditions affecting the outcomes of forest management regimes.
In response to increasing concerns about the esca-lation of forest degradation, a range of protected re-serves has been established in countries across the world. Management approaches employed in these protected areas range from total exclusion and a complete ban on any form of extraction, to co-man-aged areas that involve local populations in manage-ment, completely community-owned forests, and privately managed patches (Bates and Rudel 2000, Brandon and others 1998). The majority of these areas,
however, continue to be under government control. In reality, achieving complete exclusion appears to be difficult and rare; many traditional and colonizing populations rely on resources derived from protected areas (Dietz and others 2003). It is nevertheless unu-sual for local communities to be granted more than limited participation, if any.
Increasingly, there is awareness of the social con-sequences of creating protected areas that exclude local inhabitants from traditional ways of life, yet the area under protection continues to increase over time (Harcourt and Sayer 1996). People–park con-flicts are particularly acute in tropical regions where people live in and depend upon high biodiversity regions for their livelihoods. The effectiveness of protected areas at halting degradation is being called into question. The interest in alternative, decentral-KEY WORDS: Protected areas; Institutions; Land use/land cover
change; Remote sensing; Co-management
Published online October 25, 2004
*Author to whom correspondence should be addressed; email: [email protected]
ized methods of forest management in several coun-tries across the world can be traced to these con-cerns. ‘‘Paper parks’’ that exist only in name fail to protect resources. Thus, sustainable levels of use have been proposed as a more effective alternative, based on the argument that resources are better conserved when people can use and therefore value them as part of their livelihood (Brandon and others 1998, Bates and Rudel 2000).
In a number of regions, in comparison to the heavily top-down, state-centered systems of manage-ment that were extensively promoted in the 1950s, the trend has shifted towards encouraging decentralized, local and participatory forms of governance towards the latter half of the 20th century (Agrawal and Ostrom 2001). However, critics of these approaches argue that exclusionary approaches are the most effective way to conserve habitats and protect biodiversity (Terborgh 1999, Bruner and others 2001). Although this issue continues to be hotly debated in the academic and practitioner communities, there is a significant lack of careful quantitative evaluations of the various man-agement approaches. It is interesting to note that al-though research on the scientific basis for reserve selection and design has developed rapidly (e.g., Bishop and others 1995, Schwartz 1999), there is a real need for studies that evaluate the range of conservation strategies currently deployed throughout the world. This is in part due to the difficulty of acquiring baseline data to evaluate the impact of management regimes through time. In light of the recent debates over the potential of participatory approaches, it is particularly
important to consider whether the inclusion of local populations in decision-making processes does lead to improvements in park conditions.
Remote sensing provides a particularly effective tool for such an analysis. In order to effectively evaluate the outcome of conservation strategies, comprehensive information on the distribution of species habitats, as well as information on changes in distribution with time, is required. It is nearly impossible to acquire such information purely on the basis of field assessment and monitoring (Heywood 1995). Satellite data from sev-eral time points allows the creation of land cover maps over greater spatial extents and more frequent time steps than is possible with expensive and detailed field studies (Nagendra 2001). Because these classifications are spatially explicit, they not only provide information on percent changes in forest cover, but also allow for evaluation of the spatial location of these changes and their association with environmental and biophysical landscape parameters that may be critical associates of this change (Nagendra and others 2004).
This paper illustrates the use of remote sensing for monitoring different approaches to forest manage-ment. We selected two protected areas, Celaque Na-tional Park (CNP) in Honduras and the Royal Chitwan National Park Buffer Zone (RCNP-BZ) in Nepal, where different approaches with regard to local participation have attempted to achieve conservation. In CNP, the government had not included local populations in decision making during the period of our analyses, while in the RCNP-BZ, recent efforts had implemented participatory arrangements. In both of these parks, exclusionary approaches have proven inadequate or infeasible, which is a common situation. The first management plan for CNP (1988–1989) aimed to limit local populations’ access but was never implemented due to lack of resources (AFE-COHDEFOR/GTZ/GFA TERRA Systems 2002). The RCNP-BZ region, in southern Nepal, has initiated co-management of the buffer zone after a period of unsuccessful exclusionary policies in the main park. Through analysis of these two cases, this paper seeks to demonstrate the appli-cability of remote sensing for providing quantitative evaluations of the presence or absence of local partic-ipation in protected area management.
Site Description
Celaque National Park
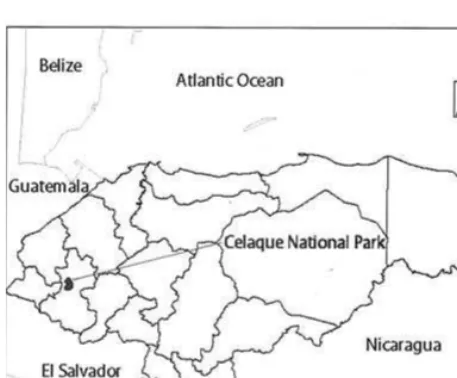
CNP is a protected area of approximately 266 km2 located in western Honduras (Figure 1). In 1987 the Honduran National Congress declared this region a Figure 1. Study area map showing the location of Celaque
protected national park (Fonseca and others 1999). A core zone was established above 1800 m elevation with an area of approximately 165 km2 within which agri-culture and industry was prohibited. Fifteen small communities, each consisting of 30 to 40 households, exist within the core zone. The communities are accessible only on foot or horseback, and although they have not been sanctioned, external agencies have pressured them to limit clearing. They represented a total of approximately 3150 inhabitants in 1998. A surrounding buffer zone serves as a transitional area and contains an additional 18 communities, with an estimated population of 5670 inhabitants. Around the park’s borders, there are 68 communities of predomi-nately indigenous heritage, representing approxi-mately 30,495 residents (AFE-COHDEFOR/ GTZ/ GFA Terra Systems 2002).
Legal land tenure in the park falls mainly under municipal (ejidal or communal) and national titles, but most residents of the core and buffer zones have locally recognized (extra-official) documents to sub-stantiate their land claims. Private owners have legal titles to more than 500 ha within the park (AFE-COHDEFOR/ GTZ/ GFA Terra Systems 2002). Land rights continue to be subject to ambiguity and con-tention, which complicates decision making and enforcement. Although three core zone communities voluntarily petitioned for relocation after the devas-tation wrought by Hurricane Mitch, they obtained new land outside the park only with difficulty (Ovei-do 1999). Land scarcity prohibits relocation as a general policy, and the political ramifications of forced relocations would be large.
Only 3% of the land in the region is considered
suitable for intensive agriculture; slopes exceed 30%
even if Celaque is discounted (Chavez Borjas 1992). The park ranges in elevation from 1400 to 2849 m above sea level. Topography is rugged, with more than two thirds of the land having slopes greater than 60%,
and soils generally being sandy and shallow. Below 1800 m, the park consists mainly of Pinus-Quercus
(pine-oak) forests. At higher elevations, the pine-oak forest gives way to a transition zone of mixed broad-leaf/pine montane forest. Above 2200 m, a cloud forest composed of many broadleaf species begins (Archaga 1998a in Fonseca and others 1999).
More than 6%of the area within the park is used
for subsistence agriculture (Archaga 1998b in Fonse-ca and others 1999, AFE-COHDEFOR/GTZ/GFA TERRA Systems 2002). Deforestation continues, especially on the east, west, and north regions (Lee, n.d.) where the expansion of coffee plantations dur-ing the past decade represents a notable factor in land-cover change and increasing social heterogene-ity. Illegal logging and agricultural clearing have de-nuded parts of the mountain. Small farms practice slash-and-burn agriculture in the core zone, while pastures and coffee plantations represent 8% of the
land use in the park and are common on slopes surrounding it (AFE-COHDEFOR/GTZ/GFA TERRA Systems 2002).
Although a survey by Fonseca and others (1999) demonstrated that 96%of the population sampled did
know of the park’s existence, most of these people learned about the park through the nongovernmental organizations (NGOs) working in the park, friends, or the radio, rather than through government agencies. It appears that the Honduran government needs to ex-pand its efforts to educate people about the park. This gap is being partially filled by the NGOs residing in this region, but much remains to be done. The most recent management plan (2002) delineates a proposal to in-clude local groups in decision making (AFE-COHDE-FOR/GTZ/GFA TERRA Systems 2002), but the process is at an early stage and emerged subsequent to the time period that our remotely sensed data address. The area where the CNP has been established fa-ces a high demand for land: it thus typifies the conflict between land for development and conser-vation in developing nations throughout the world. Previous research on forest cover change in the lar-ger landscape that surrounds CNP found a trend towards regrowth between 1987 and 1996 (South-worth and Tucker 2001, South(South-worth and others 2002). Given the broader context of this apparent reversal in the dominant trend of deforestation in Honduras, it is especially interesting to look at whe-ther the park contrasts with the surrounding area in land-cover change, which can provide an indication of park effectiveness. The park contains the highest mountain peak in Honduras, and its cloud forests are rich in biodiversity and endemic species. However, Figure 2. Study area map showing the location of the Royal
this region has been hitherto little studied due in large part to its inaccessibility.
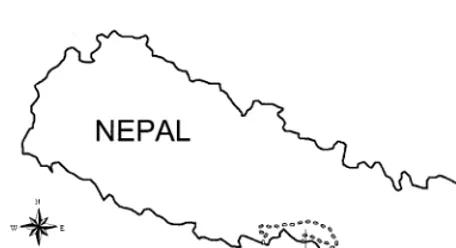
Royal Chitwan National Park–Buffer Zone
The RCNP was established in 1973, and is the oldest protected area in Nepal as well as a site of much pub-licized initiatives towards buffer zone community for-estry (Nepal and Weber 1994, Seidensticker 2002). This park is located in the southern Terai plains of Nepal (Figure 2). The area was formerly managed as a hunting reserve for the royal family, and is now strictly protected by the Royal Nepal Army. Local people are allowed to enter the park only for 10 days every year, to collect building material (Stræde and Helles 2000, Nagendra 2002). However, the park is surrounded by a population of nearly 300,000, and the severity of park– people conflicts that ensued from rigid park protection policies have led to efforts at conflict resolution in re-cent years.
The Fourth Amendment to the National Parks and Wildlife Conservation Act, passed in 1993, provided the Department of National Parks and Wildlife Conserva-tion (DNPWC) with the legal power to establish buffer zones in forested areas surrounding parks where forest resources are used on a regular basis by locals (Heinen and Mehta 2000). The DNPWC began implementing the Park People Program in the Chitwan and in other protected areas of Nepal in early 1995, to fulfill two primary objectives: socioeconomic well-being of the buffer zone communities, and biodiversity conserva-tion of the parks and their surrounding forests (Maskey and others 1999). This program receives financial and technical assistance from the United Nations Devel-opment Programme (UNDP), and was later rechris-tened the Participatory Conservation Project.
After the initiation of the buffer zone program, buffer zone forests were delineated by wardens, and handed over to user group committees with the authority to manage these forests in accordance with the Buffer Zone Management Guidelines (HMG 1999). Several of the communities appear to earn significant income from ecotourism (Schweik and others 2003, Bookbinder and others 1998). The buf-fer zone regulations and guidelines allow committees to maintain their own accounts. User groups must spend 40%of their income on conservation, followed
by 30% on community development, 20%on income
generation and skill development, and 10% on
administration (HMG 1999, Heinen and Mehta 2000). Although some of these user groups earn substantial incomes from tourism, the financial im-pact is believed to be limited on a per-household basis, and mostly limited to the user groups near the
main entrance of the park in Sauraha (Bookbinder and others 1998). The warden retains the power at all times to stop projects, and acts as the secretary of the committee overseeing expenditures (Heinen and Mehta 2000). Thus, the real impact of the program in terms of encouraging local governance, and improving participation and forest conservation, is questionable and needs further investigation.
Materials and Methods
Image Analysis Preprocessing
For CNP, Landsat TM images were obtained for March 1987, 1991, 1996, and 2000. For the RCNP-BZ, images were obtained from February 1989 and March 2000. All image dates corresponded to the end of the dry season when fallow agricultural lands can be easily distinguished from forests. In addition, we took care to select dates that correspond to the time period of CNP establishment, and to the initiation of formal and informal protection in the RCNP buffer zone forests. The satellite image analysis for Honduras covered the entire CNP. Because the RCNP-BZ is much larger, and covers multiple images that are difficult to process to-gether because of issues of interimage variability, we restricted our study to a smaller representative region of 1116 km2in the east Chitwan district, where we had conducted detailed field studies. All images were reg-istered to survey topographic maps of the region, and radiometric calibration and atmospheric correction procedures were carried out to correct for sensor drift and differences due to variations in the solar angle and atmospheric conditions. Without such calibration, change detection analysis may evaluate differences at the sensor level rather than changes at the Earth’s surface (Jensen 2000).
Image Classification and Change Detection
In the RCNP-BZ, owing to the greater variation in vegetation density in the landscape (Nagendra 2002), we created single date classifications utilizing three classes: nonforest, open forest, and dense forest. These data were again used to determine the change between two time periods, as described above. Because we had three classes in a single date, an analysis of change between two image dates would give rise to nine change trajectories. To facilitate simplicity of inter-pretation, we collapsed these into three change tra-jectories: no change in vegetation (same land-cover class in both image dates); deforestation (from dense forest to open forest, dense forest to nonforest, or open forest to nonforest), and regrowth (from non-forest to open non-forest, nonnon-forest to dense non-forest, or open forest to dense forest).
GIS Analysis
It is important to locate each protected area as a functional component of a larger landscape (Rivard and others 2000, Parks and Harcourt 2002). This re-search compared the condition of the protected area to the larger landscape within which it is embedded, in order to investigate whether the extent and pattern of change differ between the protected and unprotected landscapes. Without this necessary step of evaluating change in the surrounding landscape, it would have been difficult to evaluate the impact of protected area establishment. For instance, heavy clearing of forest around but not within the park would indicate that there is a high level of human pressure on forests in the region. In this context, if the park is maintaining forest cover, this implies that the park boundaries are effective, i.e., the change only occurs outside the park. However, if deforestation occurs to an equal extent within and outside the park, then park creation would be deemed ineffective.
For the CNP, Geographical Information Systems (GIS) coverages of area of the digitized park bound-aries were obtained from the Friends of Celaque re-search group (Figure 1). The park includes two nested boundaries: one demarcates an inner core zone (>1800-m elevation) and the other boundary marks the edge of the park buffer zone, which is a transitional, multi-use zone around most of the core zone. The buffer zone boundary provides a protective ring for the core except for a region on the west side where a preexisting settlement is located, and the buffer zone boundary was drawn to avoid this population. We cre-ated a GIS buffer region extending 5 km beyond the outer park boundary to allow comparison of land-cover change within the park buffer zone and park core to changes in the surrounding landscape. This allowed
for a comparison of land-cover change within the buffer and core zones to change in the surrounding landscape. The size of the surrounding landscape studied for comparison was restricted to 5 km, keeping in account the decreasing elevation with increasing distance from the park, such that the landscape would include higher elevations as comparable as possible to the park. Coverages of roads, towns, elevation, and slope were also created and overlaid on the classified images to facilitate our interpretation of the causes of land-cover change.
For the RCNP-BZ, an initial checklist identified a total of 14 formally registered buffer zone forests lo-cated in the study area. The spatial boundary of each of these forest patches was collected by using a Geo-graphical Positioning System unit to walk around the perimeter of the forest, as well as by using information from local forest users and forest officials to locate the boundary on a 1:25,000 scale survey topographic map with reference to major landmarks. Again, forest-cover change within the RCNP-BZ was compared with forest-cover change in the adjacent landscape, in order to compare the effectiveness of buffer zone management with the changes in forest cover ongoing in the region. As with the Honduran park, we restricted the sur-rounding landscape used for comparison to an area similar to the RCNP and buffer zone in terms of ele-vation and other biophysical landscape attributes likely to impact land cover, for greater comparability.
Socioeconomic and Institutional Information
We used in-depth interviews to collect information on the human processes impacting forest conservation in these two regions. In CNP, our analysis utilized information from a larger study area in which we have extensive field data and socioeconomic information (Tucker 1999a, 1999b, Southworth and Tucker 2001, Southworth and others 2002, Nagendra and others 2003), involving socioeconomic and demographic household surveys, and formal and informal interviews exploring forest uses and land-cover changes with important local actors including heads of households, local authorities, regional foresters, and representatives of national and nongovernmental institutions active in the region.
derived from the user group, monitoring activities, and ability to modify the rules. These variables allowed us to interpret the satellite information on forest-cover change with reference to the socioeconomic and institutional processes that influence forest-cover change in these regions.
Results
Celaque National Park
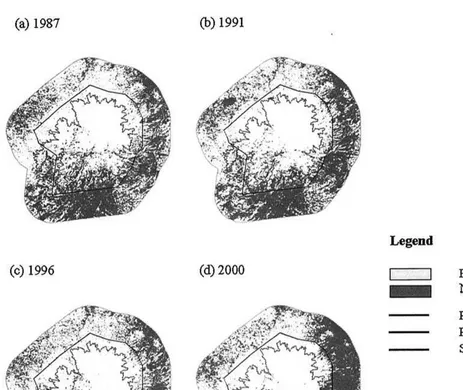
As is evident from Figure 3, most of the stable agriculture and cleared forest occurred along the southern and eastern edges of the park. This related to the location of towns and to a lesser extent to roads. Previous research explored the dynamics of land-cover
change both spatially and temporally, across the larger study region. Results of this previous modeling analysis determined that the probability of an area being in stable agriculture increased at lower elevations and less steep slopes and was also related strongly to the loca-tion’s greater accessibility in terms of roads and towns (Munroe and others 2002). The park core relates to areas above 1800-m elevation, with very steep slopes (Nagendra and others 2003). This topographic inac-cessibility probably explains a large part of why the park has thus far remained relatively well forested. The areas of highest elevations were the areas predomi-nantly in forest. However, small patches of clearing and regrowth did occur within these regions. As a per-centage, most of the area in the park core and buffer zone was forested for all dates. In contrast, nearly half Figure 3. Classified satellite image maps of (a) 1987, (b) 1991, (c) 1996, and (d) 2000, respectively, depicting land cover in the
of the area in the surrounding landscape was nonfor-ested. In the park core and buffer, the area under forest cover appeared to have remained fairly static across all four dates of analysis. Indeed, the core lost less than 1 km2of forest cover between 1987 and 2000, dropping from 145 km2to 144 km2, while the buffer zone lost about 13 km2, going from 217.07 km2 to 203.99 km2. In contrast, the area under forest cover in the surrounding landscape decreased sharply, from 199 km2in 1989 to 149 km2in 2000.
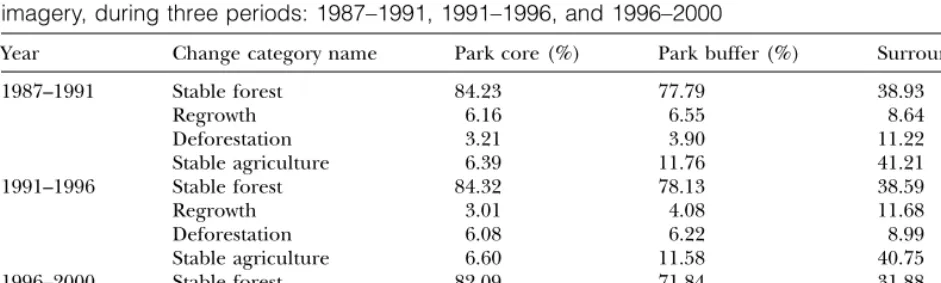
These data describe the aggregate forest and non-forest cover in each year, and may create a somewhat more static impression of forest cover than is the case. A constant amount of overall forest cover may mask significant ongoing deforestation, if balanced by an equal amount of regrowth in other parts of the land-scape. It was therefore necessary to conduct an analysis of land-cover change trajectories, to examine change over time in further detail. Based on this analysis, we found that the area within the park core and buffer appeared relatively stable, with less than 10–12%of the
total area undergoing change at any point in time (Table 1). In contrast, the surrounding landscape was much less stable. In the most recent time period, 1996– 2000, as much as 25% of the area had experienced
change (regrowth or deforestation).
Within the park core and buffer, there is limited though visible evidence of increasing pressure, with a 2–3%decline in regrowth and increase in deforestation
over time (Table 1). In the surrounding landscape, results follow a different pattern. Between 1991 and 1996, results appear to indicate that the landscape is getting more forested over time, with an increase in regrowth and decrease in deforestation when com-pared to the previous time period. Between 1996 and 2000 this trend reverses, with a spike in deforestation
levels to more than 18%, and a drop in regrowth down
to about 6%. This relates to previous research in the
larger landscape surrounding CNP, where we have found that a ban on logging, and abandonment of marginally productive agricultural fields due to agri-cultural intensification in other parts of the landscape, led to increased regrowth between 1991 and 1996 (Southworth and others 2002, Munroe and others 2002, Nagendra and others 2003). In the subsequent time period, a brief peak in coffee prices (1997–1998) (Instituto Honduren˜o del Cafe´ 2002) and national incentives encouraged clearing for coffee production while demand for land evidently grew, causing an in-crease in deforestation.
These changes can be related to shifts in land use. Increasing scarcity of prime land that is most suitable for agriculture and the introduction of chemical inputs have motivated farmers to abandon their more unproductive and marginal areas of cultivation and establish more permanent agricultural fields. Land-use transformations in the region are both mediated and shaped by relevant policy. Farmers in the study region have responded favorably to national initiatives and credit availability for export coffee production. Fur-thermore, municipal governments have reacted to a national subsidy by making road improvements in coffee-producing areas.
Production of maize and beans is the primary agri-cultural activity for rural households in the surround-ing region (Chavez Borjas 1992, Tucker 1999a). In recent years, the trend has shifted from slash-and-burn agriculture, with long fallow cycles, to the intensifica-tion of agricultural producintensifica-tion, along with the adop-tion of ox-driven plows, increased use of chemical fertilizers, and a shortened (or eliminated) fallow period (Tucker 1999a). The establishment of the park Table 1.Percentage of area occupied by different land-cover change trajectories for the area within the Cel-aque National Park core, the park boundary and the surrounding landscape, assessed using Landsat TM satellite imagery, during three periods: 1987–1991, 1991–1996, and 1996–2000
Year Change category name Park core (%) Park buffer (%) Surrounding landscape (%)
1987–1991 Stable forest 84.23 77.79 38.93
Regrowth 6.16 6.55 8.64
Deforestation 3.21 3.90 11.22 Stable agriculture 6.39 11.76 41.21 1991–1996 Stable forest 84.32 78.13 38.59
Regrowth 3.01 4.08 11.68
Deforestation 6.08 6.22 8.99 Stable agriculture 6.60 11.58 40.75 1996–2000 Stable forest 82.09 71.84 31.88
Regrowth 4.78 3.89 5.67
does not mean that communities residing within the boundary have ceased to practice agriculture: 6% of
the park area is dedicated to small-plot subsistence agriculture (AFE-COHDEFOR/GTZ/GFA TERRA Sys-tems 2002). In conditions of land scarcity, the park core offers unoccupied, if less desirable, land for poor and displaced farmers who lack alternatives. We find that agricultural intensification appears to be related to abandonment of some marginal lands, particularly those on steeper slopes.
At the same time, coffee production for the market has expanded throughout western Honduras (Tucker 1999b). Coffee is now one of the country’s leading exports, and Honduras supports coffee production by allocating road-building funds to counties in propor-tion to their coffee producpropor-tion (Tucker 1999b, Insti-tuto Honduren˜o del Cafe´ 1997). Coffee in this location is mountain grown, and grows best at higher elevations and moister environments. The conjunction of na-tional and local inducements through the 1990s con-vinced many small farmers to plant coffee for the market (Tucker 1999b). Given the scarcity of land suited for agriculture, and the requirements for the mountain-grown coffee production, coffee plantations were placed on steep slopes, at higher elevations and further from roads, i.e., in the areas of prime forest habitat. By the late 1990s, however, coffee prices plummeted due to global oversupply (Ponte 2002, Varangis and others 2003). If low prices continue as predicted, then producers may be compelled to aban-don marginal coffee plantations, and allow forest re-growth.
Royal Chitwan National Park–Buffer Zone
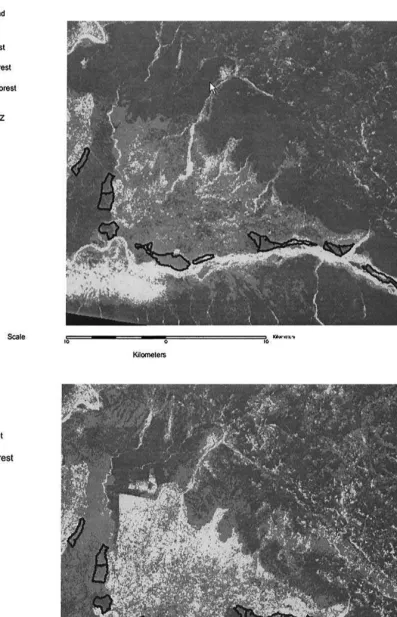
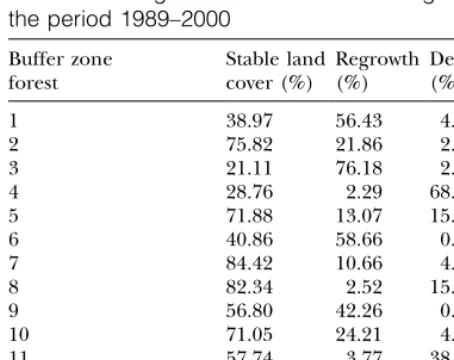
There were 14 buffer zone forests within our study area, ranging in size from 33 to 200 ha (Figure 4). The percentage of area deforested ranged from 1%to 67%,
with an average of 19.85%(Table 2). In contrast, the
rate of deforestation in the surrounding landscape was much higher, at 34%. The percentage of regrowth in
the buffer zone forests also varied from 2% to 76%,
with an average of 27%: dramatically higher than the
0.07% regrowth occurring in the surrounding
land-scape. Overall, therefore, there was a net tendency to-wards regrowth in the buffer zone areas. In comparison, less than 6% of the surrounding
land-scape, i.e., areas located outside the RCNP and its buffer zone, experienced regrowth during the same time period.
The buffer zone forests are located adjacent to the Rapti River, which defines the boundary of the RCNP, and hence is impacted by frequent flooding. In-depth interviews with local officials and forest
users revealed that in several of the buffer zone areas, forest protection was initiated as a response to a se-vere flood that devastated the area in 1993–1994. Our surveys indicated that the major income earned by buffer zone user groups was from tourism, supple-mented by smaller income from annual user fees and sale of firewood and other forest products. In part, this can explain the increasing regrowth in the buffer zone. The buffer zone regulations and guidelines indicate that committees must spend 40% of their
income on conservation, followed by 30% on
com-munity development, 20%on income generation and
skill development, and 10%on administration (HMG
1999, Heinen and Mehta 2000). Thus, user groups were able to utilize a substantial part of this income for forest maintenance and monitoring activities. User committees earned an average annual income of 228,000 NRS (at the time of writing, 79 NRS were equivalent to 1 USD, so approximately $2,900/yr). The buffer zone user groups that possess higher comes indicated that they utilized this increased in-come to hire a larger number of forest guards, and to fence the forest boundaries. This has enabled them to enforce limitations on harvesting more easily than the less wealthy adjacent community forests, and resulting in increased reforestation in the buffer zone.
However, it is important to recognize the huge var-iability between buffer groups in terms of their ability to derive income from tourism. Two of the most ‘‘successful’’ cases of buffer zone forestry (Baghmara and Kumrose forests) are much touted success stories of this policy intervention (e.g., see Seidensticker 2002). They have received substantial technical and financial inputs from the Biodiversity Conservation Network and the World Wildlife Fund (Bookbinder and others 1998). In addition, these forests are located near the park entrance and are therefore very approachable for tourists. We found that other groups, located at a distance from the park entrance, received much lower incomes from tourism. The distribution of income was therefore highly unequal among buffer zone groups, with some communities getting as low as NRS 7500 (approximately$95) and others as large an income as 2,400,000 (approximately $30,000) per an-num.
Figure 4. Classified satellite image maps of (a) 1989 and (b) 2000, respectively, depicting land cover in the Royal Chitwan
These transfers were a result of government notifica-tions, and the user communities lacked decision-mak-ing authority.
Discussion
In the context of the current debate on protected area management, there is a need for studies that at-tempt to quantify the impact of protected area estab-lishment on forest cover. Remote sensing provides an effective means of relating land-cover change within protected areas to that in the surrounding landscape, and of analyzing changes in forest extent and spatial pattern over time: both crucial aspects of an effective evaluation. We were able to use satellite imagery of constant spatial, spectral, and radiometric resolution (Landsat TM imagery) to examine whether land-cover change differs within and outside protected area boundaries, and thus gain fundamental information to evaluate park effectiveness. Such analysis is difficult to do, because it is often impossible to obtain remote sensing data with constant characteristics over ex-tended time scales due to changes in the sensors (Liu and others 2002).
This study contributes to a handful of studies that have undertaken analyses of the effectiveness of pro-tected area establishment for multiple regions (Ter-borgh 1999, Bates and Rudel 2000, Bruner and others 2001, Sanchez-Azofeifa and others 2003). Such analyses
have suggested that the parks that adopt exclusionary approaches tend to be most successful at maintaining forest cover. However, issues of human involvement are complex, and cannot be studied using a single axis of evaluation. It is necessary to combine approaches from the social and natural sciences to address this multi-faceted issue of the human dimensions of forest change.
Exclusionary approaches do not account for the social ramifications of prohibiting local inhabitants from access to the resources. Often parks are created in areas where poor people depend upon the natural resources for their livelihoods; thus, exclusionary management raises issues of social justice and equity (Bates and Rudel 2000, Brockington 2002). Moreover, local populations may oppose or resist protected areas that are created without their participation; this can contribute to degradation in park conditions (Wells and Brandon 1992).
A recent study evaluated the effectiveness of 93 parks in tropical regions (Bruner and others 2001). All of the sample parks were exclusionary in their man-agement. The study made an important contribution by attempting a broad, comparative analysis and it concluded that exclusionary parks are successful at limiting land cover transformation when compared to the surrounding landscape. With the focus on exclu-sionary forms of management, the research fails to consider whether alternative approaches, such as community-based arrangements, private ownership, or participatory park management, might have similar or better results (Stern and others 2001). In order to as-sess the conclusions of comparative studies to date, and to address the concerns that such studies have raised, new studies that incorporate additional data collection methods are needed. By incorporating remote sensing into existing field- and research-based studies, this study undertakes an approach that is multifaceted and holistic.
At the same time, analysis of remotely sensed data requires fieldwork to interpret human activities and incentives that relate to land-cover change (Schweik and Green 1999). A single land-cover class (e.g., forest) could have many different land uses, such as a park reserve, a communal woodlot, and area of regrowth after fire, orchards, or agroforestry. Likewise, many forms of land tenure could be found for a single land-cover class, e.g., family owned, communal, or govern-ment, and yet all would be associated with very differ-ent kinds of managemdiffer-ent practices. It is therefore important to recognize that satellite image analyses need to be grounded in careful field research in order to understand the underlying socioeconomic and Table 2.Percentage of area occupied by different
land-cover change trajectories for 14 forest patches in the Royal Chitwan National Park buffer zone,
assessed using Landsat TM satellite imagery, during the period 1989–2000
institutional factors that drive forest-cover change in these regions (Moran and Brondizio 1998, Rindfuss and Stern 1998).
In order to ensure greater cooperation between state authorities and local communities, there is a need to provide local inhabitants with incentives for con-servation, and to seek economic alternatives for farm-ers adjacent to the park. Tourism provides one promising source of income in CNP, because visitors from Europe, North America, and Central America have been arriving in increasing numbers to hike in Celaque. In the past 10 years, three tourist hotels have opened in the nearby town of Gracias; in 1993 there were no tourist-oriented hotels. Although local NGOs are working with local populations, their efforts need to be supplemented by involvement of the Honduran government agencies. Given that less than 30%of the
local communities living in and around the park know the location of the outer park boundary (Fonseca and others 1999), it may be that topography, lack of roads, and the poor suitability of the high elevations for agriculture constitute more important factors than park boundaries in preserving forest cover. This is clear from the fact that coffee plantations have begun encroaching on the park. These plantations are legally protected under Honduran law, even within protected areas (Fonseca and others 1999).
In Nepal, our remote sensing change analysis indi-cates that there is a substantial amount of tree regrowth taking place in the RCNP buffer zone areas, which is substantially different from the substantially higher deforestation ongoing in the surrounding landscape (Table 1). However, there is a great deal of variation in the percentage of regrowth in each buffer zone. Al-though two of the buffer zone communities—the much publicized Baghmara and Kumroj forests (Schweik and others 2003, Seidensticker 2002)—derive substantial annual incomes from ecotourism, which acts as a powerful incentive, other communities earn much smaller amounts.
International donor agencies including the UNDP and the Biodiversity Conservation Network have in-vested significant amounts of money, manpower, and technical support into the RCNP buffer zone program. However, this support is demarcated for a specific period of time. Ensuring true community participation will be crucial to assuring the continued success of the buffer zone program in the absence of international donor support. Otherwise, although these efforts may be successful at maintaining biodiversity in limited protected park areas, they will not prove sustainable without large funding, nor capable of their eventual goal of expansion to cover all protected areas in Nepal.
What are the implications for the future continued success of the buffer zone program? Although this may be effective in the short term in conserving tree cover, user group interviews clearly indicate that decision-making authority is not vested with the community: rather, this power still vests with the warden, and the user groups are not allowed to make significant chan-ges to the management policies. In a country like Ne-pal, where local biophysical, social, economic, and cultural conditions vary so markedly from one region to the next, allowing communities the flexibility to adapt management policies to local conditions is a crucial factor that impacts their success (Gautam and others 2002, 2004, Varughese and Ostrom 2001). The fact that communities do not have the required flexi-bility to incorporate context-specific learning into their management activities indicates problems for the fu-ture (Dietz and others 2003).
This research illustrates the utility of remote sensing for the study of parks, and for evaluation of the po-tential effectiveness of different management strategies in protected areas, using examples of two protected areas with varying degrees of local participation. The study also emphasizes the need for satellite image analysis to be supplemented by detailed field research to provide insights into the social and institutional processes that impact land-cover change and forest conservation. The CNP represents an area with negli-gible local participation, and the RCNP-BZ represents a co-managed buffer zone with local participation. Given the current debate on the effectiveness of protected area management, there is an urgent need for careful, quantitative evaluations that analyze the impact of exclusionary policies of protected area management on forest cover over time. Through the integration of such tools into existing, fieldwork-based studies, the analyses of protected area efficacy will improve greatly. In turn, the ability to obtain frequent images of the park region means that changes in the system can be observed quickly through remote sensing. Access to such information should be coupled with improved information exchange with park managers and local residents, hopefully resulting in a quicker response time for park infringements and a better sharing of information for those areas that are a success.
Acknowledgments
(CI-PEC) at Indiana University, and by the Society in Sci-ence: Branco Weiss Fellowship to Harini Nagendra. We thank John Jacob Matthys for creating GIS coverages and Lilian Marquez for help with translating docu-ments related to the Honduras research. Our research in Honduras would not have been possible without the assistance of Victor Archaga, Jessica Fonseca, Martha Moreno, Jose Atanacio Perez, Francisco Amadeo San-tos, and Juan Bautista. Representatives of the Hondu-ran Forest Development Corporation (COHDEFOR) and the National Coffee Institute (IHCAFE), especially Hermes Reyes, provided key insights and information. We also thank Sudil Acharya, and Kanchan Thapa for their assistance in the field in Chitwan. Dr. Elinor Os-trom, Dr. Charles Schweik, Dr. George Varughese, Dr. Ganesh Shivakoti, and Dr. Edward Webb provided invaluable feedback on our Nepal research. Finally, we are very grateful to the Friends of Celaque group and especially Alexis Aguilar for sharing information with us.
Literature Cited
Agrawal, A., and E. Ostrom. 2001. Collective action, property rights, and decentralization in resource use in India and Nepal.Politics and Society29:485–514.
Archaga, V. 1998a. Descripcio´n fı´sica y caracterizacio´n del Parque Nacional Montan˜a de Celaque. Proyecto Celaque. AFE-COHDEFOR y GTZ, Santa Rosa de Copa´n.
Archaga, V. 1998b. Enfoque de la participacio´n social en el marco del Proyecto Conservacio´n del Parque Nacional Montan˜a del Celaque. Proyecto Celaque, Santa Rosa de Copa´n.
AFE-COHDEFOR/GTZ/GFA TERRA Systems. 2002. Plan general de manejo: Parque Nacional Montan˜a Celaque. Proyecto Conservacio´n del Parque Nacional Montan˜a Cel-aque. Mayo del 2002.
Bates, D., and T. K. Rudel. 2000. The political ecology of conserving tropical rain forests: A cross-national analysis.
Society and Natural Resources13:619–633.
Bishop, K., A. Phillips, and L. Warren. 1995. Protected for ever? Factors shaping the future of protected areas policy.
Land Use Policy12:291–305.
Bookbinder, M. P., E. Dinerstein, A. Rijal, H. Cauley, and A. Rajouria. 1998. Ecotourism’s support of biodiversity con-servation.Conservation Biology12:1399–1404.
Brandon K., K. Redford and S. Sanderson (eds.). 1998. Parks in peril: People, politics and protected areas. Island Press, Washington, DC.
Brockington, D. 2002. Fortness conservation: The preserva-tion of the Mkomazi Game Reserve, Tanzania. James Curry and Bloomington: Indiana University Press, Oxford. Bruner, A. G., R. E. Gullison, R. E. Rice, R. E. Gustavo, and
A. B. da Fonseca. 2001. Effectiveness of parks in protecting tropical biodiversity.Science291:125–128.
Chavez Borjas, M. 1992. Co´mo subsisten los campesinos. Tegucigalpa: Editorial Guaymuras.
Dietz, T., E. Ostrom, and P. C. Stern. 2003. The struggle to govern the commons.Science302:1907–1912.
Fonseca, J. P., M. L. Moreno, and G. S. Padgett. 1999. Estructura florı´stica, uso de recursos y educacio´n ambiental del parque nacional Montan˜a de Celaque. Tesis Licencia-tura en Biologia, Universidad Nacional Auto´noma de Honduras.
Gautam, A. P., E. L. Webb, and A. Eiumnoh. 2002. GIS assessment of land use/land cover changes associated with community forestry implementation in the middle hills of Nepal.Mountain Research and Development22:63–69. Gautam, A.P, G. P. Shivakoti, and E. L. Webb. 2004. Forest
cover change, physiography, local economy and institu-tions in a mountain watershed in Nepal. Environmental Management33:48–61.
Harcourt, C. S., and J. Sayer. 1996. The conservation atlas of tropical forests. The Americas. Simon and Schuster, New York.
Heinen, J. T., and J. N. Mehta. 2000. Emerging issues in legal and procedural aspects of buffer zone management with case studies from Nepal.Journal of Environment and Devel-opment9:45–67.
Heywood, V. 1995. Global biodiversity assessment. Cam-bridge University Press, CamCam-bridge.
His Majesty’s Government of Nepal (HMG). 1999. Buffer zone management guidelines. His Majesty’s Government, Ministry of Forests and Soil Conservation and Department of National Parks and Wildlife Conservation, Kathmandu. Instituto Honduren˜o del Cafe´. 2002. Boletı´n estadı´stico: El
cafe´ en cifras 1970–2001, segunda edicio´n. Tegucigalpa: IHCAFE.
Instituto Honduren˜o del Cafe´. 1997. Boletı´n estadı´stico: El cafe´ en cifras 1970–1996. Tegucigalpa: IHCAFE.
Jensen, J. R. 2000. Remote sensing of the environment. An earth resource perspective. Prentice Hall, Englewood Cliffs, New Jersey.
Lee, L., n.d. Tallest peak struggled to become park, yet still losing trees. Honduras This Week. [Online] URL: http:// www.marrder.com/htw/special/environment/1.htm. Liu, J., M. Linderman, Z. Ouyang, L. An, J. Yang, and H.
Zhang. 2002. Ecological degradation in protected areas: The case of Wolong Nature Reserve for Giant Pandas. Sci-ence292:98–101.
Maskey, T. M., S. Bajimaya, B. R. Dhamala, B. K. L. Joshi, and P. Budhathoki. 1999. Park People Pro-gramme: 1999 the year in review. Department of Na-tional Parks and Wildlife Conservation Parks People Programme and United Nations Development Pro-gramme, Kathmandu.
Moran, E. F., and E. Brondizio. 1998. Land-use change after deforestation in Amazonia. Pages 94–120inD. Liverman, E. F. Moran, R. Rindfuss, P. C. Stern (eds.), People and pixels: Linking remote sensing and social science. National Academy Press, Washington, DC.
exploring spatial and temporal complexity. Agricultural Economics27:355–369.
Nagendra, H. 2001. Using remote sensing to assess biodiver-sity.International Journal of Remote Sensing22:2377–2400. Nagendra, H. 2002. Tenure and forest conditions:
Commu-nity forestry in the Nepal Terai.Environmental Conservation
29:530–539.
Nagendra, H., J. Southworth, and C. Tucker. 2003. Accessi-bility as a determinant of landscape transformation in Western Honduras: Linking pattern and process.Landscape Ecology18:141–158.
Nagendra H., D. Munroe, J. Southworth. 2004. Introduction to the special issue ’From pattern to process: Landscape fragmentation and the analysis of land use/land cover change’. Agriculture, Ecosystems and Environment 101:111– 115.
Nepal, S. K., and K. E. Weber. 1994. A buffer zone for bio-diversity conservation: Viability of the concept of Nepal’s Royal Chitwan National Park. Environmental Conservation
21:333–341.
Ostrom, E. 1998. The International Forestry Resources and Institutions program: A methodology for relating human incentives and actions on forest cover and biodiversity. Pages 1–28in F. Dallmeier, J. A. Comisker (eds.), Forest biodiversity in North, Central and South America, and the Caribbean: Research and monitoring, man and the bio-sphere series (Vol. 1). UNESCO, Paris; Parthenon, New York.
Oveido, M. I. 1999. Informe: Diagno´stico sobre la situacio´n de las familias reubicadas en la zona de amortiguamiento del Parque Nacional Celaque. Proyecto Celaque, Santa Rosa de Copa´n, Honduras.
Parks, S. A., and A. H. Harcourt. 2002. Reserve size, local human density and mammalian extinctions in U.S. pro-tected areas.Conservation Biology16:800–808.
Ponte, S. 2002. The ’latte revolution’? Regulation, markets and consumption in the global coffee chain.World Devel-opment30:1099–1122.
Riitters, K., J. Wickham, R. O’Neill, B. Jones, and E. Smith. 2000. Global-scale patterns of forest fragmentation. Con-servation Ecology 4:3. [online] URL: http://www.cons-ecol.org/vol4/iss2/art3.
Rindfuss, R., and P. C. Stern. 1998. Linking remote sensing and social science: the need and the challenges. Pages 1–27
inD. Liverman, E. F. Moran, R. Rindfuss, P. C. Stern (eds.), People and pixels: Linking remote sensing and social sci-ence. National Academy Press, Washington, D.C.
Rivard, D. H., J. Poitevin, D. Plasse, M. Carleton, and D. J. Currie. 2000. Changing species richness and composition
in Canadian national parks.Conservation Biology 14:1099– 1109.
Sanchez-Azofeifa, G. A., G. C. Daily, A. S. P. Pfaff, and C. Busch. 2003. Integrity and isolation of Costa Rica’s national parks and biological reserves: Examining the dynamics of land cover change.Biological Conservation109:123–135. Schwartz, M. W. 1999. Choosing the appropriate scale of
re-serves for conservation. Annual Review of Ecology and Sys-tematics30:83–108.
Schweik, C., and G. M. Green. 1999. The use of spectral mixture analysis to study human incentives, actions and environmental outcomes. Social Science Computer Review
17:40–63.
Schweik, C., H. Nagendra, and D. R. Sinha. 2003. Using sat-ellites to search for forest management innovations in Nepal.Ambio32:312–319.
Seidensticker, J. 2002. Tiger tracks.Smithsonian32:62–69. Southworth, J., and C. M. Tucker. 2001. Forest cover change
in western Honduras: the role of socio-economic and bio-physical factors, local institutions, and land tenure. Moun-tain Research and Development21:276–283.
Southworth, J., H. Nagendra, and C. M. Tucker. 2002. Frag-mentation of a landscape: Incorporating landscape metrics into satellite analyses of land cover change.Landscape Re-search27:253–269.
Stern, M., S. Bhagwat, N. Brown, T. Evans, S. Jennings, P. Savill, A. G. Bruner, R. E. Gullison, R. E. Rice, and G. A. B. da Fonseca. 2001. Parks and factors in their success [letter].
Science293:1045–1047.
Stræde, S., and F. Helles. 2000. Park-people conflict in Royal Chitwan National Park, Nepal: buying time at high cost?.
Environmental Conservation27:368–381.
Terborgh, J. 1999. Requiem for nature. Shearwater Books. Tucker, C. M. 1999a. Private vs. communal forests: Forest
conditions and tenure in a Honduran community.Human Ecology27:201–230.
Tucker, C. M. 1999b. Manejo forestal y polı´ticas nacionales en La Campa, Honduras.Mesoame´rica37:111–144.
Varangis, P., P. Siegel, D. Giovannucci, and B. Lewin. 2003. Dealing with the coffee crisis in Central America: Impacts and strategies. World Bank Policy Research Working Paper 2993, March 2003. URL: http://econ.worldbank.org. Varughese, G., and E. Ostrom. 2001. The contested role of