Katalog BPS : 9201001.36
Indeks Harga dan Inflasi
Price Indices and Inflation
Keuangan Pemerintah Daerah
Finance of Regional Government
Perbankan
Banking
Penanaman Modal
Investation
Produksi
Production
Neraca Perdagangan Luar Negeri
Balance of International Trade
Perhubungan
Transportation
Hotel dan Pariwisata
Hotel and Tourism
Produk Domestik Regional Bruto
Gross Domestic Regional Product
I
I
IN
N
N
D
DI
D
I
IK
K
KA
A
AT
T
T
O
O
O
R
R
R
E
E
E
K
KO
K
O
ON
N
NO
O
OM
M
MI
I
I
Economic Indicators
B
B
B
A
A
A
N
N
N
T
T
T
E
EN
E
N
N
2
2
2
0
0
0
1
1
1
6
6
6
BADAN PUSAT STATISTIK
PROVINSI BANTEN
ht
tp:/
/bant
en.bps
INDIKATOR EKONOMI
Economic Indicators
BANTEN
2016
ht
tp:/
/bant
en.bps
INDIKATOR EKONOMI
Economic Indicators
BANTEN 2016
ISBN : 978-979-1426-29-9
ISSN
Nomor Publikasi / Publication Number
: 2356-508X : 36550.1608 Katalog BPS / BPS Catalogue : 9201001.36
Diterbitkan oleh Penanggung Jawab Editor
Penyusun Desain Cover
: Badan Pusat Statistik Provinsi Banten : Ir. Agoes Soebeno, MSc.
: Budi Prawoto, MM. : Saeful Hidayat, SSi., MSE. : Teuku MM, SSi.
Serang : Badan Pusat Statistik Provinsi Banten xvii + 239 Halaman; 21 cm x 29,7 cm
Dilarang mengumumkan, mendistribusikan, mengomunikasikan, dan/atau menggandakan sebagian atau seluruh isi buku ini untuk tujuan komersial tanpa izin tertulis dari Badan Pusat Statistik"
Gambar Kulit / Book Cover Image : Peta Administrasi Provinsi Banten – diolah (Dinas Bina Marga dan Tata Ruang Provinsi Banten) AdministrativeMap of Banten Province – modified
(Office of Regional Road Construction and Spatial Planning Service of Banten Province)
ht
tp:/
/bant
en.bps
KATA PENGANTAR
Indikator Ekonomi Banten merupakan publikasi yang diterbitkan secara rutin tiap tahunnya oleh Badan Pusat Statistik Provinsi Banten. Publikasi ini memberikan gambaran umum tentang keadaan perekonomian Banten, terutama perkembangan dari berbagai kinerja perekonomian di Banten melalui serangkaian angka indikator ekonomi.
Data yang dimuat terdiri dari data primer dan data sekunder. Data primer merupakan data yang diperoleh oleh BPS secara langsung melalui serangkaian kegiatan survei dan sensus. Sementara data sekunder adalah data yang diperoleh dari pihak lain, dalam hal ini adalah dinas/instansi pemerintah dan lembaga swasta yang berada di wilayah Provinsi Banten.
Publikasi Indikator Ekonomi Banten 2016, menyajikan informasi mengenai keuangan, harga-harga, investasi, produksi, pariwisata, Produk Domestik Regional Bruto dan data-data ekonomi lainnya. Publikasi ini sekaligus menjawab sebagian kebutuhan akan data indikator perekonomian yang dapat digunakan sebagai salah satu sumber informasi bagi proses perencanaan maupun penilaian terhadap kinerja perekonomian yang telah dicapai Banten.
Penghargaan dan terimakasih disampaikan kepada semua pihak yang telah membantu hingga terbitnya publikasi ini. Kepada para pengguna diharapkan saran dan kritik yang bersifat konstruktif demi penyempurnaan publikasi pada masa yang akan datang.
Semoga publikasi ini dapat bermanfaat bagi masyarakat pada umumnya dan para pengguna data pada khususnya.
Serang, Oktober 2016
Kepala Badan Pusat Statistik Provinsi Banten
Agoes Soebeno
ht
tp:/
/bant
en.bps
PREFACE
Banten Economic Indicators is a publication that issued regularly by the BPS - Statistics of Banten Province every year. This publication gives us
general view of Banten’s economic situation, especially the development of all economic aspects, which is shown by the series of number in economic
indicators.
The data which is shown consists of prime data and secondary data. Prime data is the data that taken directly through numbers of surveys and census that held by BPS - Statistics of Banten Province. Secondary data is the data that we received from other institutions, in this case means governmental and private institutions that located in Banten Province.
Banten’s Economic Indicators 2016 represents all of the information about prices, finance, investments, production, tourism, Gross Regional Domestic Product and all others economic data that needed. This publication also answered some of the needs of economic indicators data which is useful in giving information for development planning process or to evaluate the result of economic development in Banten.
We would like also to express our sincere thanks to those who had helped to issue this publication. Comments and suggestions would be appreciated from the data users on improving this publication in the future.
Finally, we hope this publication can gives benefit to the people, especially for the data users.
Serang, October 2016
Chief of BPS - Statistics of Banten Province
Agoes Soebeno
ht
tp:/
/bant
en.bps
v
DAFTAR ISI
Halaman
TABLE OF CONTENTS
Page
1.1.1 Indeks Harga Konsumen (IHK) Gabungan 3 Kota di Provinsi Banten Menurut Kelompok Barang dan Jasa,
2013-2016 (2012=100) ... 5
1.1.1 Composite Consumer Price Indices (CPI) of 3 Cities in Banten Province by Commodity Group,
2013-2016 (2012=100) ... 5
1.1.2 Indeks Harga Konsumen (IHK) Kota Serang Menurut Kelompok Barang dan Jasa,
2013-2016 (2012=100) ... 6
1.1.2 Consumer Price Indices (CPI) of Serang City by Commodity Group,
2013-2016 (2012=100) ... 6
1.1.3 Indeks Harga Konsumen (IHK) Kota Tangerang Menurut Kelompok Barang dan Jasa,
2013-2016 (2012=100) ... 7
1.1.3 Consumer Price Indices (CPI) of Tangerang City by Commodity Group,
2013-2016 (2012=100) ... 7
1.1.4 Indeks Harga Konsumen (IHK) Kota Cilegon Menurut Kelompok Barang dan Jasa,
2013-2016 (2012=100) ... 8
1.1.4 Consumer Price Indices (CPI) of Cilegon City by Commodity Group,
2013-2016 (2012=100) ... 8
1.1.5 Laju Inflasi Bulanan Gabungan 3 Kota di Provinsi Banten Menurut Kelompok Barang dan Jasa,
2013-2016 (2012=100) ... 9
1.1.5 Composite Monthly Inflation Rate (q to q) of 3 Cities in Banten Province by Commodity Group,
2013-2016 (2012=100) ... 9
1.1.6 Laju Inflasi Bulanan Kota Serang Menurut Kelompok Barang dan Jasa,
2013-2016 (2012=100) ... 10
1.1.6 Monthly Inflation Rate (q to q) of Serang City by Commodity Group,
2013-2016 (2012=100) ... 10
1.1.7 Laju Inflasi Bulanan Kota Tangerang Menurut Kelompok Barang dan Jasa,
2013-2016 (2012=100) ... 11
1.1.7 Monthly Inflation Rate (q to q) of Tangerang City by Commodity Group,
2013-2016 (2012=100) ... 11
1.1.8 Laju Inflasi Bulanan Kota Cilegon Menurut Kelompok Barang dan Jasa,
2013-2016 (2012=100) ... 12
1.1.8 Monthly Inflation Rate (q to q) of Cilegon City by Commodity Group,
2013-2016 (2012=100) ... 12
1.1.9 Laju Inflasi Tahun Kalender Gabungan 3 Kota di Provinsi Banten Menurut Kelompok Barang dan Jasa,
2013-2016 (2012=100) ... 13
1.1.9 Composite Year to Date Inflation Rate (y to d) of 3 Cities in Banten Province by Commodity Group,
2013-2016 (2012=100) ... 13
1.1.10 Laju Inflasi Tahun Kalender Kota Serang Menurut Kelompok Barang dan Jasa,
2013-2016 (2012=100) ... 14
1.1.10 Year to Date Inflation Rate (y to d) of Serang City by Commodity Group,
2013-2016 (2012=100) ... 14
ht
tp:/
/bant
en.bps
INDIKATOR EKONOMI BANTEN 2015 ECONOMIC INDICATORS
Daftar Isi Table of Content
vi
Halaman Page
1.1.11 Laju Inflasi Tahun Kalender Kota Tangerang Menurut Kelompok Barang dan Jasa,
2013-2016 (2012=100) ... 15
1.1.11 Year to Date Inflation Rate (y to d) of Tangerang City by Commodity Group,
2013-2016 (2012=100) ... 15
1.1.12 Laju Inflasi Tahun Kalender Kota Cilegon Menurut Kelompok Barang dan Jasa,
2013-2016 (2012=100) ... 16
1.1.12 Year to Date Inflation Rate (y to d) of Cilegon City by Commodity Group,
2013-2016 (2012=100) ... 16
1.1.13 Laju Inflasi Tahunan Gabungan 3 Kota di Provinsi Banten Menurut Kelompok Barang dan Jasa,
2013-2016 (2012=100) ... 17
1.1.13 Composite Year on Year Inflation Rate (y on y) of 3 Cities in Banten Province by Commodity Group,
2013-2016 (2012=100) ... 17
1.1.14 Laju Inflasi Tahunan Kota Serang Menurut Kelompok Barang dan Jasa,
2013-2016 (2012=100) ... 18
1.1.14 Year on Year Inflation Rate (y on y) of Serang City by Commodity Group,
2013-2016 (2012=100) ... 18
1.1.15 Laju Inflasi Tahunan Kota Tangerang Menurut Kelompok Barang dan Jasa,
2013-2016 (2012=100) ... 19
1.1.15 Year on Year Inflation Rate (y on y) of Tangerang City by Commodity Group,
2013-2016 (2012=100) ... 19
1.1.16 Laju Inflasi Tahunan Kota Cilegon Menurut Kelompok Barang dan Jasa,
2013-2016 (2012=100) ... 20
1.1.16 Year on Year Inflation Rate (y on y) of Cilegon City by Commodity Group,
2013-2016 (2012=100) ... 20
1.1.17 Laju Inflasi Menurut Kota dan Kelompok Barang dan Jasa,
2013-2016 (2012=100) ... 21
1.1.17 Inflation Rate by City and Commodity Group,
2013-2016 (2012=100) ... 21
1.1.18 Laju Inflasi Banten dan Nasional Menurut Kelompok Barang dan Jasa,
2013-2016 (2012=100) ... 22
1.1.18 Banten and Indonesian Inflation Rate by Commodity Group,
2013-2016 (2012=100) ... 22
1.2.1 Indeks Harga yang Diterima (It), Indeks Harga yang Dibayar (Ib) dan Nilai Tukar Petani (NTP) Bulanan
2013-2016 (2012=100) ... 23
1.2.1 Indices of Prices Received by Farmers (It), Paid by Farmers (Ib),
and Farmers’ Term of Trade (NTP) by Month
2013-2016 (2012=100) ... 23
1.2.2 Perubahan Indeks Harga yang Diterima (It), Indeks Harga yang Dibayar (Ib) dan Nilai Tukar Petani (NTP)
Bulanan (persen),
2013-2016 (2012=100) ... 24
1.2.2 Changes of Indices of Prices Received by Farmers (It), Paid by Farmers (Ib), and Farmers’ Term of Trade (NTP)
by Month (percent),
2013-2016 (2012=100) ... 24
1.2.3 Nilai Tukar Petani (NTP) Menurut Subsektor
2013-2016 (2012=100) ... 25
1.2.3 Farmers’ Term of Trade (FTT) by Subsector
2013-2016 (2012=100) ... 25
1.2.4 Perubahan Nilai Tukar Petani (NTP) Menurut Subsektor,
2013-2016 (2012=100) ... 26
1.2.4 Changes of Farmers’ Term of Trade (FTT) by Subsector,
2013-2016 (2012=100) ... 26
1.2.5 Indeks Harga yang Diterima, Indeks Harga yang Dibayar dan Nilai Tukar Petani Tanaman Pangan,
2013-2016 (2012=100) ... 27
1.2.5 Indices of Prices Received by Farmers, Paid by Farmers, and Food Crops Farmers’ Term of Trade,
2013-2016 (2012=100) ... 27
1.2.6 Indeks Harga yang Diterima, Indeks Harga yang Dibayar dan Nilai Tukar Petani Hortikultura,
2013-2016 (2012=100) ... 28
1.2.6 Indices of Prices Received by Farmers, Paid by Farmers, and Horticulture Farmers’ Term of Trade,
2013-2016 (2012=100) ... 28
ht
tp:/
/bant
en.bps
INDIKATOR EKONOMI BANTEN 2015 ECONOMIC INDICATORS
Daftar Isi Table of Content
vii
Halaman Page
1.2.7 Indeks Harga yang Diterima, Indeks Harga yang Dibayar dan Nilai Tukar Petani Tanaman Perkebunan Rakyat,
2013-2016 (2012=100) ... 29
1.2.7 Indices of Prices Received by Farmers, Paid by Farmers, and Smallholder Plantation Estate Crops Farmers’ Term of Trade,
2013-2016 (2012=100) ... 29
1.2.8 Indeks Harga yang Diterima, Indeks Harga yang Dibayar dan Nilai Tukar Petani Peternakan,
2013-2016 (2012=100) ... 30
1.2.8 Indices of Prices Received by Farmers, Paid by Farmers, and Animal Husbandary Farmers’ Term of Trade,
2013-2016 (2012=100) ... 30
1.2.9 Indeks Harga yang Diterima, Indeks Harga yang Dibayar dan Nilai Tukar Petani Perikanan,
2013-2016 (2012=100) ... 31
1.2.9 Indices of Prices Received by Farmers, Paid by Farmers, and Fishery Farmers’ Term of Trade,
2013-2016 (2012=100) ... 31
1.2.10 Indeks Harga yang Diterima, Indeks Harga yang Dibayar dan Nilai Tukar Petani,
2013-2016 (2012=100) ... 32
1.2.10 Indices of Prices Received by Farmers, Paid by Farmers, and
Farmers’ Term of Trade,
2013-2016 (2012=100) ... 32
1.2.11 Perubahan Indeks Harga yang Diterima, Indeks Harga yang Dibayar dan Nilai Tukar Petani Tanaman Pangan (persen),
2013-2016 (2012=100) ... 33
1.2.11 Change of Indices of Prices Received by Farmers, Paid by Farmers, and Food Crops Farmers’ Term of Trade (percent),
2013-2016 (2012=100) ... 33
1.2.12 Perubahan Indeks Harga yang Diterima, Indeks Harga yang Dibayar dan Nilai Tukar Petani Hortikultura (persen),
2013-2016 (2012=100) ... 34
1.2.12 Change of Indices of Prices Received by Farmers, Paid by Farmers, and Horticulture Farmers’ Term of Trade (percent),
2013-2016 (2012=100) ... 34
1.2.13 Perubahan Indeks Harga yang Diterima, Indeks Harga yang Dibayar dan Nilai Tukar Petani Tanaman Perkebunan Rakyat (persen),
2013-2016 (2012=100) ... 35
1.2.13 Change of Indices of Prices Received by Farmers, Paid by Farmers, and Smallholder Plantation Estate Crops Farmers’ Term of Trade (percent),
2013-2016 (2012=100) ... 35
1.2.14 Perubahan Indeks Harga yang Diterima, Indeks Harga yang Dibayar dan Nilai Tukar Petani Peternakan
(persen),
2013-2016 (2012=100) ... 36
1.2.14 Change of Indices of Prices Received by Farmers, Paid by Farmers, and Animal Husbandary Farmers’ Term of Trade (percent),
2013-2016 (2012=100) ... 36
1.2.15 Perubahan Indeks Harga yang Diterima, Indeks Harga yang Dibayar dan Nilai Tukar Petani Perikanan (persen),
2013-2016 (2012=100) ... 37
1.2.15 Change of Indices of Prices Received by Farmers, Paid by Farmers, and Fishery Farmers’ Term of Trade (percent),
2013-2016 (2012=100) ... 37
1.2.16 Perubahan Indeks Harga yang Diterima, Indeks Harga yang Dibayar dan Nilai Tukar Petani (persen),
2013-2016 (2012=100) ... 38
1.2.16 Change of Indices of Prices Received by Farmers, Paid by
Farmers, and Farmers’ Term of Trade (percent),
2013-2016 (2012=100) ... 38
1.2.17 Nilai Tukar Petani (NTP) Menurut Subsektor di Provinsi Banten dan Indonesia,
2013-2016 (2012=100) ... 39
1.2.17 Farmers’ Term of Trade (FTT) by Subsector in Banten Province and Indonesia,
2013-2016 (2012=100) ... 39
1.2.18 Perubahan Nilai Tukar Petani (NTP) Menurut Subsektor di Provinsi Banten dan Indonesia (persen),
2013-2016 (2012=100) ... 40
1.2.18 Changes of Farmers’ Term of Trade (FTT) by Subsector in Banten Province and Indonesia (percent),
2013-2016 (2012=100) ... 40
ht
tp:/
/bant
en.bps
INDIKATOR EKONOMI BANTEN 2015 ECONOMIC INDICATORS
Daftar Isi Table of Content
viii
Halaman Page
1.3.1 Indeks Harga Konsumen Daerah Perdesaan di Provinsi Banten Menurut Kelompok Barang dan Jasa,
2013-2016 (2012=100) ... 41
1.3.1 Consumer Price Indices of Rural Areas in Banten Province by Commodity Group,
2013-2016 (2012=100) ... 41
1.3.2 Laju Inflasi Bulanan di Daerah Perdesaan di Provinsi Banten Menurut Kelompok Barang dan Jasa,
2013-2016 (2012=100) ... 42
1.3.2 Monthly Inflation Rate (q to q) of Rural Areas in Banten Province by Commodity Group,
2013-2016 (2012=100) ... 42
1.3.3 Laju Inflasi Tahun Kalender di Daerah Perdesaan di Provinsi Banten Menurut Kelompok Barang dan Jasa,
2013-2016 (2012=100) ... 43
1.3.3 Year to Date Inflation Rate (y to d) of Rural Areas in Banten Province by Commodity Group,
2013-2016 (2012=100) ... 43
1.3.4 Laju Inflasi Tahunan Kalender di Daerah Perdesaan di Provinsi Banten Menurut Kelompok Barang dan Jasa,
2013-2016 (2012=100) ... 44
1.3.4 Year on Year Inflation Rate (y on y) of Rural Areas in Banten Province by Commodity Group,
2013-2016 (2012=100) ... 44
1.3.5 Laju Inflasi di Daerah Perdesaan di Provinsi Banten dan Indonesia Menurut Kelompok Barang dan Jasa,
2013-2016 (2012=100) ... 45
1.3.5 Inflation Rate of Rural Areas in Banten Province and Indonesia by Commodity Group,
2013-2016 (2012=100) ... 45
II. KEUANGAN PEMERINTAH DAERAH
PENJELASAN TEKNIS ... 49
II. FINANCE OF REGIONAL GOVERNMENT
TECHNICAL NOTES ... 49
2.1 Rekapitulasi Realisasi Anggaran Pendapatan dan Belanja (APBD) Pemerintah Provinsi Banten (juta rupiah),
2013-2016 ... 50
2.1 Recapitulation of Local Government Budget Realization of Banten Province (million rupiahs),
2013-2016 ….………. 50
2.2 Realisasi Pendapatan Daerah Pemerintah Provinsi Banten (juta rupiah),
2013-2016 ... 51
2.2 Actual Local Government Receipts of Banten Province (million rupiahs),
2013-2016 ... 51
2.3 Realisasi Belanja Daerah Pemerintah Provinsi Banten (juta rupiah),
2013-2016 ... 52
2.3 Actual Local Government Expenditures of Banten Province (million rupiahs),
2013-2016 ... 52
2.4 Realisasi Pembiayaan Daerah Pemerintah Provinsi Banten (juta rupiah),
2013-2016 ... 53
2.4 Actual Local Government Financing of Banten Province (million rupiahs),
2013-2016 ... 53
III. PERBANKAN
PENJELASAN TEKNIS ... 57
III. BANKING
TECHNICAL NOTES …...... 57
3.1 Jumlah Kantor Bank Menurut Status Kepemilikan di Provinsi Banten dan Indonesia,
2013-2016 ... 58
3.1 Number of Banks Offices by Ownership Status In Banten Province and Indonesia,
2013-2016 ………..... 58
3.2 Posisi Dana Simpanan Rupiah dan Valuta Asing dari Bank Umum dan BPR Menurut Kabupaten/Kota Berdasarkan Kantor Lokasi Penghimpun Dana (juta rupiah),
2013-2016 ... 59
3.2 Outstanding of Private Deposit in Rupiah and Foreign Currency of Commercial and Rural Banks by Region Based on Bank’s Office Funds Location (million rupiahs),
2013-2016 ………..... 59
ht
tp:/
/bant
en.bps
INDIKATOR EKONOMI BANTEN 2015 ECONOMIC INDICATORS
Daftar Isi Table of Content
ix
Halaman Page
3.3 Posisi Dana Simpanan Rupiah dan Valuta Asing dari Bank Umum dan BPR di Provinsi Banten dan Indonesia Berdasarkan Kantor Lokasi Penghimpun Dana (juta rupiah),
2013-2016 ... 63
3.3 Outstanding of Private Deposit in Rupiah and Foreign Currency of Commercial and Rural Banks in Banten Province and Indonesia
Based on Bank’s Office Funds Location (million rupiahs),
2013-2016 ………..... 63
3.4 Posisi Pinjaman Rupiah dan Valuta Asing Yang Diberikan dari Bank Umum dan BPR Menurut Kabupaten/Kota dan Jenis Penggunaan (juta rupiah),
2013-2016 ……….. 64
3.4 Outstanding of Loans in Rupiah and Foreign Currency of Commercial and Rural Bank by Region and Type of Credits (million rupiahs),
2013-2016 ……….... 64
3.5 Posisi Pinjaman Rupiah dan Valuta Asing Yang Diberikan dari Bank Umum dan BPR Menurut Jenis Penggunaan di Provinsi Banten dan Indonesia (juta rupiah),
2013-2016 ……….. 66
3.5 Outstanding of Loans in Rupiah and Foreign Currency
of Commercial and Rural Bank by Type of Credits (million rupiahs) in Banten Province and Indonesia,
2013-2016 ……….... 66
3.6 Posisi Pinjaman Rupiah dan Valuta Asing Yang Diberikan dari Bank Umum dan BPR Menurut Kabupaten/Kota dan Sektor Ekonomi (juta rupiah),
2013-2016 ……….. 67
3.6 Outstanding of Loans in Rupiah and Foreign Currency of Commercial and Rural Bank by Region and Economic Sector (million rupiahs),
2013-2016 ……….... 67
3.7 Posisi Pinjaman Rupiah dan Valuta Asing Yang Diberikan dari Bank Umum dan BPR Menurut Sektor Ekonomi di Provinsi Banten dan Indonesia (juta rupiah),
2013-2016 ……….. 71
3.7 Outstanding of Loans in Rupiah and Foreign Currency of Commercial and Rural Bank by Economic Sector in Banten Province and Indonesia (million rupiahs),
2013-2016 ……….... 71
3.8 Posisi Pinjaman Modal Kerja Rupiah dan Valuta Asing Yang Diberikan dari Bank Umum dan BPR Menurut Sektor Ekonomi di Provinsi Banten dan Indonesia (juta rupiah),
2013-2016 ……….. 72
3.8 Outstanding of Working Capital Loans in Rupiah and Foreign Currency of Commercial and Rural Bank by Economic Sector in Banten Province and Indonesia (million rupiahs),
2013-2016 ……….... 72
3.9 Posisi Pinjaman Investasi Rupiah dan Valuta Asing Yang Diberikan dari Bank Umum dan BPR Menurut Sektor Ekonomi
di Provinsi Banten dan Indonesia (juta rupiah),
2013-2016 ……….. 73
3.9 Outstanding of Investment Loans in Rupiah and Foreign Currency of Commercial and Rural Bank by Economic Sector
in Banten Province and Indonesia (million rupiahs),
2013-2016 ……….... 73
3.10 Posisi Pinjaman Konsumesi Rupiah dan Valuta Asing Yang Diberikan dari Bank Umum dan BPR Menurut Sektor Ekonomi di Provinsi Banten dan Indonesia (juta rupiah),
2013-2016 ……….. 74
3.10 Outstanding of Consumption Loans in Rupiah and Foreign Currency of Commercial and Rural Bank by Economic Sector in Banten Province and Indonesia (million rupiahs),
2013-2016 ……….... 74
3.11 Posisi Kredit Mikro, Kecil dan Menengah yang Diberikan Bank Umum Menurut Kabupaten/Kota (miliar rupiah),
2013-2016 …..……... 75
3.11 Outstanding of Commercial Banks Credit to Micro, Small and Medium Scale Enterprise by Region (billion rupiahs),
2013-2016 ... 75
3.12 Posisi Kredit Mikro, Kecil dan Menengah yang Diberikan Bank Umum di Provinsi Banten dan Indonesia (miliar rupiah),
2013-2016 ………....…… 77
3.12 Outstanding of Commercial Banks Credit to Micro, Small and Medium Scale Enterprise in Banten Province dan Indonesia
(billion rupiahs), 2013-2016 ……….. 77
3.13 Posisi Kredit Mikro, Kecil dan Menengah yang Diberikan Bank Umum Menurut Kabupaten/Kota dan Jenis Penggunaan
(miliar rupiah), 2013-2016 …... 78
3.13 Outstanding of Commercial Banks Credit to Micro, Small and Medium Scale Enterprise by Region and Type of Credits
(billion rupiahs), 2013-2016 ... 78
ht
tp:/
/bant
en.bps
INDIKATOR EKONOMI BANTEN 2015 ECONOMIC INDICATORS
Daftar Isi Table of Content
x
Halaman Page
3.14 Posisi Kredit Mikro, Kecil dan Menengah yang Diberikan Bank Umum Menurut Jenis Penggunaan di Provinsi Banten dan Indonesia (miliar rupiah),
2013-2016 …... 80
3.14 Outstanding of Commercial Banks Credit to Micro, Small and Medium Scale Enterprise by Type of Credits in Banten Province and Indonesia (billion rupiahs),
2013-2016 ... 80
3.15 Posisi Kredit Mikro, Kecil dan Menengah yang Diberikan Bank Umum Menurut Kabupaten/Kota dan Sektor Ekonomi
(miliar rupiah), 2013-2016 …... 81
3.15 Outstanding of Commercial Banks Credit to Micro, Small and Medium Scale Enterprise by Region and Economic Sector
(billion rupiahs), 2013-2016 ... 81
3.16 Posisi Kredit Mikro, Kecil dan Menengah yang Diberikan Bank Umum Menurut Sektor Ekonomi di Provinsi Banten dan Indonesia (miliar rupiah),
2013-2016 …... 85
3.14 Outstanding of Commercial Banks Credit to Micro, Small and Medium Scale Enterprise by Economic Sector in Banten Province and Indonesia (billion rupiahs),
2013-2016 ... 85
IV. PENANAMAN MODAL
PENJELASAN TEKNIS ... 89
IV. INVESTMENT
TECHNICAL NOTES ... 89
4.1 Realisasi Penanaman Modal Asing (PMA) di Provinsi Banten dan Indonesia,
2010-2016 ... 90
4.1 Realization of Foreign Direct Invesment (FDI) in Banten Province and Indonesia,
2010-2016 ... 90
4.2 Realisasi Penanaman Modal Asing (PMA) Menurut Kabupaten/Kota di Provinsi Banten,
2014-2015 ... 91
4.2 Realization of Foreign Direct Invesment (FDI) by Regency/Municipality in Banten Province,
2014-2015 ... 91
4.3 Realisasi Penanaman Modal Asing (PMA) Menurut Sektor Ekonomi di Provinsi Banten,
2014-2015 ... 93
4.3 Realization of Foreign Direct Invesment (FDI) by Economic Sector in Banten Province,
2014-2015 ... 93
4.4 Realisasi Penanaman Modal Asing (PMA) Menurut Negara Asal Investor di Provinsi Banten,
2014-2015 ... 93
4.4 Realization of Foreign Direct Invesment (FDI) by Investor Countries in Banten Province,
2014-2015 ... 93
4.5 Realisasi Penanaman Modal Dalam Negeri (PMDN) di Provinsi Banten dan Indonesia,
2010-2016 ... 94
4.5 Realization of Domestic Direct Invesment (DDI) in Banten Province and Indonesia,
2010-2016 ... 94
4.6 Realisasi Penanaman Modal Dalam Negeri (PMDN) Menurut Kabupaten/Kota di Provinsi Banten,
2014-2015 ... 95
4.6 Realization of Domestic Direct Invesment (DDI) by Regency/Municipality in Banten Province,
2014-2015 ... 95
4.7 Realisasi Perluasan Penanaman Modal Dalam Negeri (PMDN) Menurut Kabupaten/Kota di Provinsi Banten,
2014-2015 ... 96
4.7 Realization of Domestic Direct Invesment (DDI) Expansion by Regency/Municipality in Banten Province,
2014-2015 ... 96
V. PRODUKSI
PENJELASAN TEKNIS ... 99
V. PRODUCTION
TECHNICAL NOTES ………... 99
5.1 Jumlah Perusahaan Industri Besar dan Sedang Menurut Golongan Pokok Industri,
2011-2015 ………...……… 101
5.1 Number of Large and Medium Manufacturing Establishment by Industrial Major Group,
2011-2015 ………...……… 101
ht
tp:/
/bant
en.bps
INDIKATOR EKONOMI BANTEN 2015 ECONOMIC INDICATORS
Daftar Isi Table of Content
xi
Halaman Page
5.2 Jumlah Tenaga Kerja Perusahaan Industri Besar dan Sedang Menurut Golongan Pokok Industri,
2011-2014 ………...……… 103
5.2 Number of Workers Engaged in Large and Medium Manufacturing Establishment by Industrial Major Group,
2011-2015 ………...……… 103 5.3 Nilai Output dari Perusahaan Industri Besar dan Sedang
Menurut Golongan Pokok Industri (miliar rupiah),
2011-2014 ………...……… 105
5.3 Output Value in Large and Medium Manufacturing Establishment by Industrial Major Group (billion rupiahs),
2011-2014 ………...……… 105 5.4 Nilai Tambah Bruto dari Perusahaan Industri Besar dan Sedang
Menurut Golongan Pokok Industri (miliar rupiah),
2011-2014 ………...……… 107
5.4 Value Added in Large and Medium Manufacturing Establishment by Industrial Major Group (billion rupiahs),
2011-2014 ………...……… 107 5.5 Indikator Ketenagalistrikan,
2011-2015 ………...……… 109
5.5 Electricity Indicators,
2011-2015 ………...……… 109 5.6 Indikator Kinerja Perusahaan Konstruksi,
2011-2015 ………...……… 110
5.6 Perfomance Indicators of The Construction Establishment ,
2011-2015 ………...……… 110 5.7 Realisasi Penjualan Semen Triwulanan
di Provinsi Banten (ton),
2011-2016 ……….... 111
5.7 Actual Quarterly Selling of Cement in Banten Province (ton),
2011-2016 ………... 111 5.8 Realisasi Penjualan Gas Kota Triwulanan
di Provinsi Banten (m3),
2011-2016 ……….... 112
5.8 Actual Quarterly Selling of City Gas in Banten Province (m3), 5.10 Produktivitas Tanaman Pangan (ku/ha),
2010-2015 ………...……… 114
5.10 Productivity of Food Crops (ku/ha,)
2010-2015 ………...……… 114 5.11 Produksi Tanaman Pangan (ton),
2010-2015 ………...……… 115
5.11 Production of Food Crops (ton,)
2010-2015 ………...……… 115 5.12 Produksi Tanaman Pangan Menurut Kabupaten/Kota
di Provinsi Banten (ton),
2013-2015 …………...……… 116
5.12 Production of Food Crops by Regency/Municipality in Banten Province (tons),
2013-2015 ………...……… 116 5.13 Perkembangan Produksi Komoditas Perkebunan
Menurut Jenis Tanaman di Provinsi Banten (ton),
2008-2013 ... 119
5.13 Plantation Crop Production by Type of Plant in Banten Province (tons),
2008-2013 ... 119 5.14 Produksi dan Nilai Produksi Kayu Jati dan Rimba
di Provinsi Banten,
2000-2014 ……… 120
5.14 Production of Jati and Rimba Woods and It’s Value in Banten Province,
2000-2014 ……… 120 5.15 Produksi Daging Menurut Jenis Ternak/Unggas di Provinsi Banten
(ton), 2010-2015 ………... 121
5.15 Meat Production by Kind of Livestock/Poultries in Banten Province
(tons), 2010-2014 ... 121
VI. NERACA PERDAGANGAN LUAR NEGERI
PENJELASAN TEKNIS ……... 125
VI. BALANCE OF INTERNATIONAL TRADE
TECHNICAL NOTES ... 125
6.1 Nilai Ekspor-Impor Banten dan Indonesia,
2011-2016 ... 127
6.1 Export-Impor Value of Banten and Indonesia,
2011-2016 ... 127
ht
tp:/
/bant
en.bps
INDIKATOR EKONOMI BANTEN 2015 ECONOMIC INDICATORS
Daftar Isi Table of Content
xii
Halaman Page
6.2 Volume Ekspor Menurut Bulan, (Berat bersih : ribu ton),
2011-2016 ... 128
6.2 Volume of Exports by Month, (Net weight : thousand ton),
2011-2016 ... 128
6.3 Pertumbuhan Volume Ekspor Menurut Bulan, (persen),
2011-2016 ... 129
6.3 Growth Rate of Volume of Exports by Month, (percent),
2011-2016 ... 129
6.4 Nilai Ekspor Menurut Bulan, (Nilai FOB : juta US$),
2011-2016 ... 130
6.4 Value of Exports by Month, (FOB value : million US$),
2011-2016 ... 130
6.5 Pertumbuhan Nilai Ekspor Menurut Bulan, (persen),
2011-2016 ... 131
6.5 Growth Rate of Value of Exports by Month, (percent),
2011-2016 ... 131
6.6 Volume Impor Menurut Bulan, (Berat bersih : ribu ton),
2011-2016 ... 132
6.6 Volume of Imports by Month, (Net weight : thousand ton),
2011-2016 ... 132
6.7 Pertumbuhan Volume Impor Menurut Bulan, (persen),
2011-2016 ... 133
6.7 Growth Rate of Volume of Imports by Month, (percent),
2011-2016 ... 133
6.8 Nilai Impor Menurut Bulan, (Nilai FOB : juta US$),
2011-2016 ... 134
6.8 Value of Imports by Month, (FOB value : million US$),
2011-2016 ... 134
6.9 Pertumbuhan Nilai Impor Menurut Bulan, (persen),
2011-2016 ... 135
6.9 Growth Rate of Value of Imports by Month, (percent),
2011-2016 ... 135
6.10 Neraca Perdagangan Luar Negeri Menurut Bulan, (juta US$),
2011-2016 ... 136
6.10 Balance of International Trade by Month, (million US$),
2011-2016 ... 136
6.11 Pertumbuhan Neraca Perdagangan Luar Negeri Menurut Bulan, (persen),
2011-2016 ... 137
6.11 Growth Rate of Balance of International Trade by Month, (percent),
2011-2016 ... 137
6.12 Nilai Ekspor Menurut Pelabuhan/Bandara Bongkar (Nilai FOB : juta US$),
2011-2016 …...…... 138
6.12 Value of Exports by Major Ports (FOB value : million US$),
2011-2016 ………..... 138
6.13 Nilai Impor Menurut Pelabuhan/Bandara Muat (Nilai CIF : juta US$),
2011-2016 …...…... 139
6.13 Value of Imports by Major Ports (CIF value : million US$),
2011-2016 ………... 139
6.14 Nilai Ekspor Menurut Negara Tujuan (Nilai FOB : juta US$),
2011-2015 …...…... 140
6.14 Value of Exports by Country of Destination (FOB value : million US$),
2011-2015 ………..... 140
6.15 Nilai Impor Menurut Negara Asal (Nilai CIF : juta US$),
2011-2015 …...…... 141
INDIKATOR EKONOMI BANTEN 2015 ECONOMIC INDICATORS
Daftar Isi Table of Content
xiii
Halaman Page
6.16 Neraca Perdagangan Luar Negeri Menurut Negara Mitra Dagang, (juta US$),
2011-2015 ... 142
6.16 Balance of International Trade by Country Trading Partners, (million US$),
2011-2015 ... 142
6.17 Nilai Ekspor Menurut Golongan SITC (Nilai FOB : juta US$),
2011-2015 …...…... 143
6.17 Value of Exports by SITC Group (FOB value : million US$),
2011-2015 ………..... 143
6.19 Nilai Impor Menurut Golongan SITC (Nilai CIF : juta US$),
2011-2015 …...…... 144
6.18 Value of Imports by SITC Group (CIF value : million US$),
2011-2015 ………..... 144
6.19 Neraca Perdagangan Luar Negeri Menurut Golongan SITC, (juta US$),
2011-2015 ... 145
6.19 Balance of International Trade by SITC Group, (million US$),
2011-2015 ... 145
6.20 Nilai Ekspor Menurut Golongan HS 2 Digit (Nilai FOB : juta US$),
2011-2015 …...…... 146
6.20 Value of Exports by 2 Digit HS Group (FOB value : million US$),
2011-2015 ………..... 146
6.21 Nilai Impor Menurut Golongan HS 2 Digit (Nilai CIF : juta US$),
2011-2015 …...…... 147
6.21 Value of Imports by 2 Digit Group (CIF value : million US$),
2011-2015 ………..... 147
6.22 Nilai Ekspor Menurut Jenis Produk (Nilai FOB : juta US$),
2011-2016 …...…... 148
6.22 Value of Exports by Type of Product (FOB value : million US$),
2011-2016 ………..... 148
6.23 Nilai Impor Menurut Golongan Penggunaan Barang (Nilai CIF : juta US$),
2011-2016 …...…... 149
6.23 Value of Imports by Category of Kind of Goods (CIF value : million US$),
2011-2016 ………..... 149
VII. PERHUBUNGAN
PENJELASAN TEKNIS ... 153
VII. TRANSPORTATION
TECHNICAL NOTES ... 153
7.1 Volume Lalulintas Kendaraan Yang Melalui Ruas Tol Jakarta-Tangerang dan Serpong-Ulujami (kendaraan),
2013-2016 ………... 155
7.1 Vehicle Traffic Volume Through Toll Road Jakarta-Tangerang and Serpong-Ulujami (vehicles),
2013-2016 ………... 155
7.2 Realisasi Penumpang dan Barang Angkutan Kereta Api Beberapa Stasiun di Provinsi Banten,
2012-2016 ... 156
7.2 Realization of Passengers and Goods of Rail Transportations of Some Stations in Banten Province,
2010-2013 ………... 156
7.3 Data Bulanan Angkutan Penyeberangan Merak-Bakahuni di Pelabuhan Merak,
2015………..………...…….. 157
7.3 Monthly Data of Merak-Bakahuni Ferry Transport at Merak Port,
2014………..………...…….. 157
7.4 Data Bulanan Angkutan Penyeberangan Merak-Bakahuni di Pelabuhan Merak,
2016………..………...…….. 159
7.4 Monthly Data of Merak-Bakahuni Ferry Transport at Merak Port,
2015………..………...…….. 159
7.5 Data Tahunan Angkutan Penyeberangan Merak-Bakahuni di Pelabuhan Merak,
2012-2016 ………... 160
INDIKATOR EKONOMI BANTEN 2015 ECONOMIC INDICATORS
Daftar Isi Table of Content
xiv
Halaman Page
7.6 Jumlah Kapal Yang Melakukan Aktivitas Bongkar Muat Menurut Status Kepemilikan di Seluruh Pelabuhan di Provinsi Banten (unit),
2012-2015 ... 161
7.6 Number of Ship Conducting the Activity Load and Unload by Status Ownership at All Ports
in Banten Province (units),
2012-2015 ………... 161
7.7 Jumlah Barang Dari / Tujuan Ke Luar Negeri Yang Dibongkar dan Dimuat di Seluruh Pelabuhan di Provinsi Banten (ton),
2012-2015 ...
162
7.7 Number of Goods from Abroad or Overseas Destinations Which are Load and Unload at All Ports
in Banten Province (tons),
2012-2015 ………... 162
7.8 Jumlah Barang Dari / Tujuan Ke Provinsi Lain Yang Dibongkar dan Dimuat di Seluruh Pelabuhan di Provinsi Banten (ton),
2012-2015 ... 163
7.8 Number of Goods from Other Province / To Another Province Which are Load and Unload at All Ports
in Banten Province (tons),
2012-2015 ………... 163
7.9 Banyaknya Penerbangan dan Penumpang Domestik di Bandara Soekarno-Hatta,
2011-2016 ... 164
7.9 Number of Domestic Flights and Passangers at Soekarno-Hatta Airport,
2011-2016 ………... 164
7.10 Banyaknya Penerbangan dan Penumpang Internasional di Bandara Soekarno-Hatta,
2011-2016 ... 165
7.10 Number of International Flights and Passangers at Soekarno-Hatta Airport,
2011-2016 ………... 165
7.11 Bongkar/Muat Barang/Paket Pos Angkutan Udara Domestik di Bandara Soekarno-Hatta,
2011-2016 ... 166
7.11 Volume of Domestic Aircraft Cargoes / Postal Packages at Soekarno-Hatta Airport,
2011-2016 ………... 166
7.12 Bongkar/Muat Barang/Paket Pos Angkutan Udara Internasional di Bandara Soekarno-Hatta,
2011-2016 ... 167
7.12 Volume of International Aircraft Cargoes / Postal Packages at Soekarno-Hatta Airport,
2011-2016 ………... 167
VIII. HOTEL DAN PARIWISATA
PENJELASAN TEKNIS ... 171
VIII. HOTEL AND TOURISM
TECHNICAL NOTES ... 171
8.1 Banyaknya Akomodasi, Kamar, Tempat Tidur dan Tingkat Penghunian Kamar (TPK) Hotel Menurut Kualifikasi Hotel di Provinsi Banten,
2011-2015 ... 173
8.1 Number of Accomodations, Rooms, and Beds Available in Hotel and Room Occupancy Rate (ROR) of Hotel by Hotel Qualifications in Banten Province,
2011-2015 ………... 173
8.2 Banyaknya Tamu Hotel Menurut Kualifikasi Hotel di Provinsi Banten (orang),
2011-2015 ... 174
8.2 Number of Hotel Visitors by Hotel Qualifications in Banten Province (person),
2011-2015 ………... 174
8.3 Rata-Rata Lama Menginap Tamu Hotel Menurut Kualifikasi Hotel di Provinsi Banten (hari),
2011-2015 ... 175
8.3 Average Length of Stay in Hotel by Hotel Qualifications in Banten Province (days),
2011-2015 ………... 175
8.4 Jumlah Wisatawan Nusantara dan Wisatawan Mancanegara Yang Berkunjung ke Objek Wisata
di Provinsi Banten (orang),
2009-2013 ... 176
8.7 Number of Domestic and Foreign Tourist Who Visit to Tourism Object in Banten Province by Regency/Municipality in Banten Province (visitors),
2009-2013 ………... 176
ht
tp:/
/bant
en.bps
INDIKATOR EKONOMI BANTEN 2015 ECONOMIC INDICATORS
Daftar Isi Table of Content
xv
Halaman Page
IX. PRODUK DOMESTIK REGIONAL BRUTO
PENJELASAN TEKNIS ... 179
IX. GROSS REGIONAL DOMESTIC PRODUCT
TECHNICAL NOTES ... 179
9.1.1 PDRB Triwulanan Provinsi Banten Atas Dasar Harga Berlaku Menurut Lapangan Usaha (juta rupiah),
2015-2016 ... 181
9.1.1 Quarterly GRDP of Banten Province at Current Market Prices by Industrial Origin (billion rupiahs),
2015-2016 ………... 181
9.1.2 PDRB Triwulanan Provinsi Banten Atas Dasar Harga Konstan 2010 Menurut Lapangan Usaha (juta rupiah),
2015-2016 ... 183
9.1.2 QuarterlyGRDP of BantenProvince at 2010 ConstantMarket Prices by Industrial Origin (billion rupiahs),
2015-2016 ………... 183
9.1.3 Distribusi PDRB Triwulanan Provinsi Banten Atas Dasar Harga Berlaku Menurut Lapangan Usaha (juta rupiah),
2015-2016 ... 185
9.1.3 Percentage Distribution of Quarterly GRDP of Banten Province at Current Market Prices by Industrial Origin
(billion rupiahs),
2015-2016 ………... 185
9.1.4 Distribusi PDRB Triwulanan Provinsi Banten
Atas Dasar Harga Konstan 2000 Menurut Lapangan Usaha (juta rupiah),
2015-2016 ... 187
9.1.4 Percentage Distribution of Quarterly GRDP of Banten Province at 2010 ConstantMarket Prices by Industrial Origin
(billion rupiahs),
2015-2016 ………... 187
9.1.5 Laju Pertumbuhan PDRB Triwulanan Provinsi Banten Atas Dasar Harga Konstan 2010 Menurut Lapangan Usaha (Q to Q, persen),
2015-2016 ... 189
9.1.5 Growth Rate of Quarterly GRDP of Banten Province at 2010 Constant Market Prices by Industrial Origin (Q to Q, percent),
2015-2016 ………... 189
9.1.6 Laju Pertumbuhan PDRB Triwulanan Provinsi Banten Atas Dasar Harga Konstan 2010 Menurut Lapangan Usaha (Y on Y, persen),
2015-2016 ... 191
9.1.6 Growth Rate of Quarterly GRDP of Banten Province at 2010 Constant Market Prices by Industrial Origin (Q to Q, percent),
2015-2016 ………... 191
9.1.7 Laju Pertumbuhan PDRB Triwulanan Provinsi Banten Atas Dasar Harga Konstan 2010 Menurut Lapangan Usaha (C to C, persen),
2015-2016 ... 193
9.1.7 Growth Rate of Quarterly GRDP of Banten Province at 2010 Constant Market Prices by Industrial Origin (Q to Q, percent),
2015-2016 ………... 193
9.1.8 PDRB Triwulanan Provinsi Banten Atas Dasar Harga Berlaku Menurut Jenis Pengeluaran (juta rupiah),
2015-2016 ... 195
9.1.8 Quarterly GRDP of Banten Province at Current Market Prices by Type of Expenditures (billion rupiahs),
2015-2016 ………... 195
9.1.9 PDRB Triwulanan Provinsi Banten Atas Dasar Harga Konstan 2010 Menurut Jenis Pengeluaran (juta rupiah),
2015-2016 ... 196
9.1.9 QuarterlyGRDP of BantenProvince at 2010 ConstantMarket Prices by Type of Expenditures (billion rupiahs),
2015-2016 ………... 196
9.1.10 Distribusi PDRB Triwulanan Provinsi Banten Atas Dasar Harga Berlaku Menurut Jenis Pengeluaran (juta rupiah),
2015-2016 ... 197
9.1.10 Percentage Distribution of Quarterly GRDP of Banten Province at Current Market Prices by Type of Expenditures
(billion rupiahs),
2015-2016 ………... 197
9.1.11 Distribusi PDRB Triwulanan Provinsi Banten Atas Dasar Konstan 2010 Menurut Jenis Pengeluaran (juta rupiah),
2015-2016 ... 198
INDIKATOR EKONOMI BANTEN 2015 ECONOMIC INDICATORS
Daftar Isi Table of Content
xvi
Halaman Page
9.1.12 Laju Pertumbuhan PDRB Triwulanan Provinsi Banten Atas Dasar Harga Konstan 2010 Menurut Jenis Pengeluaran (Q to Q, persen),
2015-2016 ... 199
9.1.12 Growth Rate of Quarterly GRDP of Banten Province at 2010 Constant Market Prices by Type of Expenditures (Q to Q, percent),
2015-2016 ………... 199
9.1.13 Laju Pertumbuhan PDRB Triwulanan Provinsi Banten Atas Dasar Harga Konstan 2010 Menurut Jenis Pengeluaran (Y on Y, persen),
2015-2016 ... 200
9.1.13 Growth Rate of Quarterly GRDP of Banten Province at 2010 Constant Market Prices by Type of Expenditures (Q to Q, percent),
2015-2016 ………... 200
9.1.14 Laju Pertumbuhan PDRB Triwulanan Provinsi Banten Atas Dasar Harga Konstan 2010 Menurut Jenis Pengeluaran (C to C, persen),
2015-2016 ... 201
9.1.14 Growth Rate of Quarterly GRDP of Banten Province at 2010 Constant Market Prices by Type of Expenditures (Q to Q, percent),
2015-2016 ………... 201
9.1.15 Kontribusi Ekonomi dan Laju Pertumbuhan Ekonomi Regional Menurut Provinsi di Jawa (persen),
Triwulan II - 2015 ... 202
9.1.15 Economic Contribution and Regional Growth Rate in Java (percent),
Quarter II - 2015 ... 202
9.2.1 PDRB Provinsi Banten Atas Dasar Harga Berlaku Menurut Lapangan Usaha (miliar rupiah),
2011-2015 ………... 203
9.2.1 GRDP of Banten Province at Current Market Prices by Industrial Origin (billion rupiahs),
2011-2015 ………... 203
9.2.2 PDRB Provinsi Banten Atas Dasar Harga Konstan 2010 Menurut Lapangan Usaha (miliar rupiah),
2011-2015 ………... 208
9.2.2 GRDP of Banten Province at 2010 Constant Market Prices by Industrial Origin (billion rupiahs),
2011-2015 ………... 208
9.2.3 Distribusi PDRB Provinsi Banten Atas Dasar Harga Berlaku Menurut Lapangan Usaha,
2011-2015 ………... 213
9.2.3 Percentage Distribution of GRDP of Banten Province at Current Market Prices by Industrial Origin (billion rupiahs),
2011-2015 ………... 213
9.2.4 Distribusi PDRB Provinsi Banten Atas Dasar Harga Konstan 2010 Menurut Lapangan Usaha,
2011-2015 ………... 218
9.2.4 Percentage Distribution of GRDP of Banten Province at Current Market Prices by Industrial Origin (billion rupiahs),
2011-2015 ………... 218
9.2.5 Laju Pertumbuhan PDRB Provinsi Banten Atas Dasar Harga Konstan 2010 Menurut Lapangan Usaha,
2011-2015 ………... 223
9.2.5 Growth Rate of GRDP of Banten Province at 2010 Constant Market Prices by Industrial Origin,
2011-2015 ………... 223
9.2.6 Laju Pertumbuhan Indeks Implisit PDRB Provinsi Banten Menurut Lapangan Usaha (persen),
2011-2015 ………... 228
9.2.6 Growth Rate of Implicit Price Indice of GRDP of Banten Province by Industrial Origin,
2011-2015 ………... 218
9.2.7 PDRB Provinsi Banten Atas Dasar Harga Berlaku Menurut Jenis Pengeluaran (miliar rupiah),
2011-2015 ………... 233
9.2.7 GRDP of Banten Province at Current Market Prices by Type of Expenditure (billion rupiahs),
2011-2015 ………... 233
9.2.8 PDRB Provinsi Banten Atas Dasar Harga Konstan 2010 Menurut Jenis Pengeluaran (miliar rupiah),
2011-2015 ………... 234
9.2.8 GRDP of Banten Province at 2010 Constant Market Prices by Type of Expenditure (billion rupiahs),
2011-2015 ………... 234
ht
tp:/
/bant
en.bps
INDIKATOR EKONOMI BANTEN 2015 ECONOMIC INDICATORS
Daftar Isi Table of Content
xvii
Halaman Page
9.2.9 Distribusi PDRB Provinsi Banten Atas Dasar Harga Berlaku Menurut Jenis Pengeluaran,
2011-2015 ………... 235
9.2.9 Percentage Distribution of GRDP of Banten Province at Current Market Prices by Type of Expenditure (billion rupiahs),
2011-2015 ………... 235
9.2.10 Distribusi PDRB Provinsi Banten Atas Dasar Harga Konstan 2010 Menurut Jenis Pengeluaran,
2011-2015 ………... 236
9.2.10 Percentage Distribution of GRDP of Banten Province at Current Market Prices by Type of Expenditure (billion rupiahs),
2011-2015 ………... 236
9.2.11 Laju Pertumbuhan PDRB Provinsi Banten Atas Dasar Harga Konstan 2010 Menurut Jenis Pengeluaran,
2011-2015 ………... 237
9.2.11 Growth Rate of GRDP of Banten Province at 2010 Constant Market Prices by Type of Expenditure,
2011-2015 ………... 237
9.2.12 Laju Pertumbuhan Indeks Implisit PDRB Provinsi Banten Menurut Jenis Pengeluaran (persen),
2011-2015 ………... 238
9.2.12 Growth Rate of Implicit Price Indice of GRDP of Banten Province by Type of Expenditure,
2011-2015 ………... 238
9.2.13 Perkembangan Beberapa Agregat PDRB Provinsi Banten,
2011-2015 ………... 239
9.2.13 Trend of Several GRDP Agregates of Banten Province,
2011-2015 ………... 239
ht
tp:/
/bant
en.bps
ht
tp:/
/bant
en.bps
INDIKATOR EKONOMI
Economic Indicators
BANTEN 2016
INDEKS HARGA
Price Indices
1
ht
tp:/
/bant
en.bps
INDIKATOR EKONOMI BANTEN 2016 ECONOMIC INDICATORS
Indeks Harga Price Indices
2
ht
tp:/
/bant
en.bps
INDIKATOR EKONOMI BANTEN 2016 ECONOMIC INDICATORS
Indeks Harga Price Indices
3 Serang (346 komoditi). Sebelum bulan Januari 2014 Indeks Harga Konsumen (IHK) didasarkan pada pola konsumsi hasil Survei Biaya Hidup (SBH) tahun 2007 dan dihitung di tiga kota, yaitu Kota Serang, Kota Tangerang dan Kota Cilegon.
2. Dalam penyajian IHK dengan metode baru, jenis barang / jasa tersebut dikelompokkan menjadi 7 kelompok, yaitu :
1. Bahan Makanan
2. Makanan Jadi, Minuman, Rokok dan Tembakau
3. Perumahan, Air, Listrik, Gas dan Bahan Bakar 4. Sandang
5. Kesehatan
6. Pendidikan, Rekreasi dan Olahraga
7. Transportasi, Komunikasi dan Jasa Keuangan
3. a. Angka inflasi tahunan diperoleh dari :
In– In- 1
1. Since January 2014, the calculation of Consumer Price Index (CPI) has been based on a consumtion pattern obtained from the 2012 Cost of Living Survey (CLS). The CPI of Banten (covering 394 commodities) is obtained by surveys of consumer price in three cities,i.e. Tangerang (317 commodities), Cilegon (311 commodities) and Serang (346 commodities). Before January 2014, the calculation of Consumer Price Index (CPI) has been based on a consumtion pattern obtained from the 2007 Cost of Living Survey (CLS) in three cities, i.e. Serang, Tangerang, and Cilegon.
2. In the new method of CPI, commodities divided into 7 groups as follows :
1. Food
2. Prepared Food, Beverages, and Tobacco Products 3. Housing, Water, Electricity, Gas, and Fuel 4. Clothing
5. Health
6. Education, Recreation and Sports
7. Transportation, Communication and Financial Services
3. a. Yearly inflation figures is obtained from :
INDIKATOR EKONOMI BANTEN 2016 ECONOMIC INDICATORS
Indeks Harga Price Indices
4
PENJELASAN TEKNIS
b. Persentase (%) perubahan IHK dalam satu tahun dihitung dengan menggunakan metode point to point. Sebelumnya, perhitungan inflasi menggunakan metode kumulatif bulanan.
4. IHK dihitung menggunakan formula Laspeyres yang dikembangkan, yaitu :
6. Indeks harga yang diterima petani sumbernya adalah dari hasil survei harga produsen yang dilaksanakan setiap bulan dengan
memakai daftar HKD dan HD.
7. Sejak Desember 2013, indeks harga yang diterima dan dibayar petani serta nilai tukarnya menggunakan tahun dasar 2012.
8. Indeks harga yang diterima petani (It) dan indeks harga yang dibayar petani (Ib) dihitung menggunakan formula Laspeyres yang
dikembangkan.
9. Nilai tukar petani adalah rasio antara indeks harga yang diterima (It) dengan yang dibayar petani (Ib).
TECHNICAL NOTES
b. The percentage change of yearly CPI is calculated using point to point method. A couple years ago, the inflation is calculated by
using a monthly cumulative method.
4. The CPI, is calculated using a modified Laspeyres formula :
In =
INDIKATOR EKONOMI BANTEN 2016 ECONOMIC INDICATORS
Indeks Harga Price Indices
5
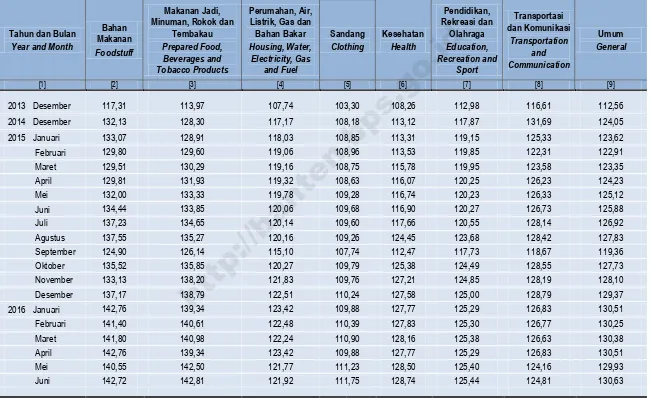
Tabel
1.1.1 Indeks Harga Konsumen (IHK) Gabungan 3 Kota di Provinsi Banten Menurut Kelompok Barang dan Jasa Composite Consumer Price Indices (CPI) of 3 Cities in Banten Province by Commodity Group
2013-2016 (2012=100) Table
Tahun dan Bulan
Year and Month
Bahan Makanan
Foodstuff
Makanan Jadi, Minuman, Rokok dan
Tembakau
Prepared Food, Beverages and Tobacco Products
Perumahan, Air, Listrik, Gas dan
Bahan Bakar
Sumber / Source : BPS Provinsi Banten / BPS - Statistics of Banten Province
ht
tp:/
/bant
en.bps
INDIKATOR EKONOMI BANTEN 2016 ECONOMIC INDICATORS
Indeks Harga Price Indices
6
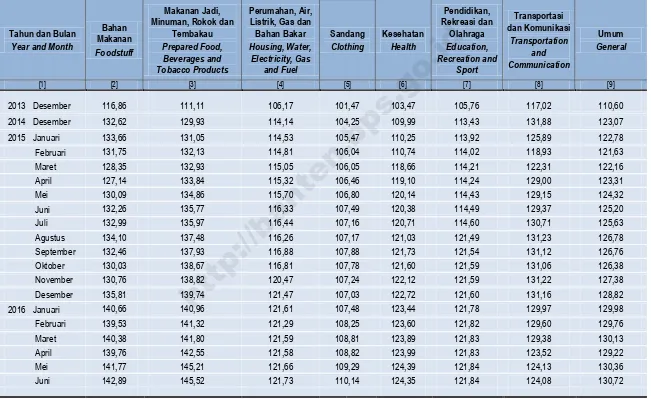
Tabel
1.1.2 Indeks Harga Konsumen (IHK) Kota Serang Menurut Kelompok Barang dan Jasa Consumer Price Indices (CPI) of Serang City by Commodity Group
2013-2016 (2012=100) Table
Tahun dan Bulan
Year and Month
Bahan Makanan
Foodstuff
Makanan Jadi, Minuman, Rokok dan
Tembakau
Prepared Food, Beverages and Tobacco Products
Perumahan, Air, Listrik, Gas dan
Bahan Bakar
Sumber / Source : BPS Provinsi Banten / BPS - Statistics of Banten Province
ht
tp:/
/bant
en.bps
INDIKATOR EKONOMI BANTEN 2016 ECONOMIC INDICATORS
Indeks Harga Price Indices
7
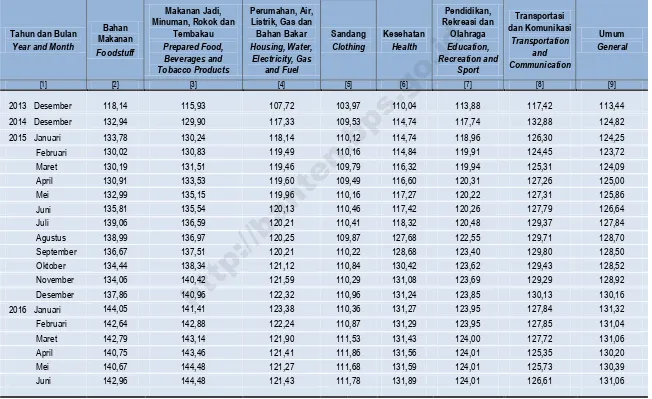
Tabel
1.1.3 Indeks Harga Konsumen (IHK) Kota Tangerang Menurut Kelompok Barang dan Jasa Consumer Price Indices (CPI) of Tangerang City by Commodity Group
2013-2016 (2012=100) Table
Tahun dan Bulan
Year and Month
Bahan Makanan
Foodstuff
Makanan Jadi, Minuman, Rokok dan
Tembakau
Prepared Food, Beverages and Tobacco Products
Perumahan, Air, Listrik, Gas dan
Bahan Bakar
Sumber / Source : BPS Provinsi Banten / BPS - Statistics of Banten Province
ht
tp:/
/bant
en.bps
INDIKATOR EKONOMI BANTEN 2016 ECONOMIC INDICATORS
Indeks Harga Price Indices
8
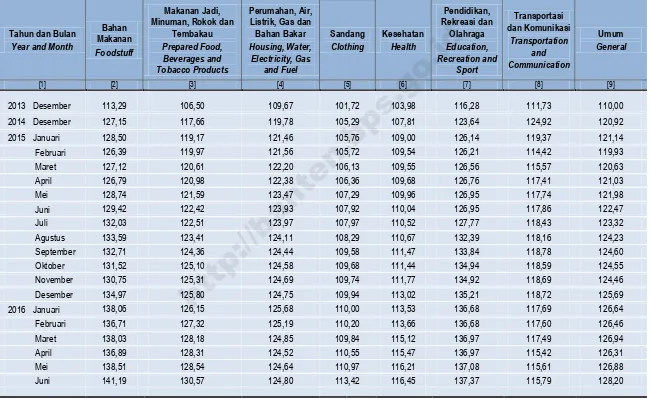
Tabel
1.1.4 Indeks Harga Konsumen (IHK) Kota Cilegon Menurut Kelompok Barang dan Jasa Consumer Price Indices (CPI) of Cilegon City by Commodity Group
2013-2016 (2012=100) Table
Tahun dan Bulan
Year and Month
Bahan Makanan
Foodstuff
Makanan Jadi, Minuman, Rokok dan
Tembakau
Prepared Food, Beverages and Tobacco Products
Perumahan, Air, Listrik, Gas dan
Bahan Bakar
Sumber / Source : BPS Provinsi Banten / BPS - Statistics of Banten Province
ht
tp:/
/bant
en.bps
INDIKATOR EKONOMI BANTEN 2016 ECONOMIC INDICATORS
Indeks Harga Price Indices
9
Tabel
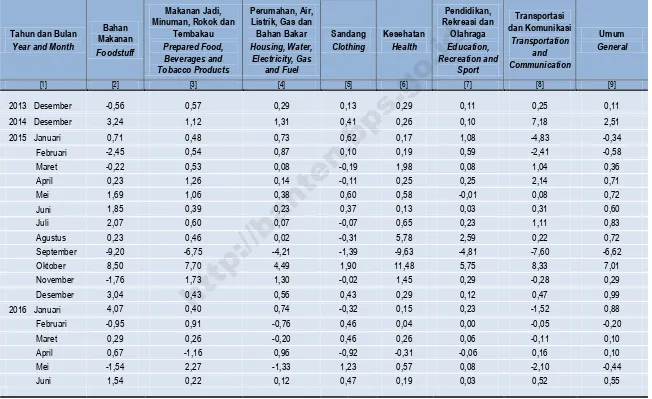
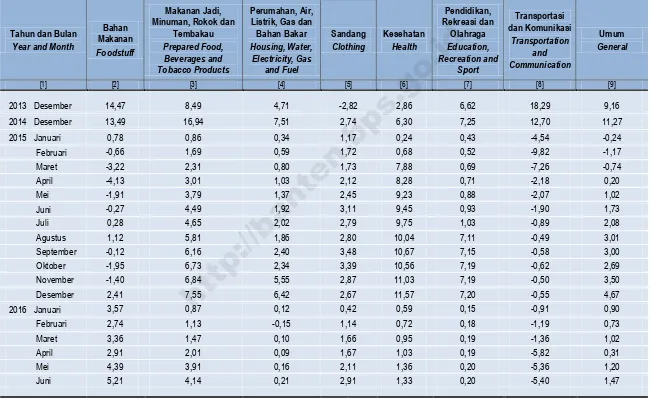
1.1.5 Laju Inflasi Bulanan Gabungan 3 Kota di Provinsi Banten Menurut Kelompok Barang dan Jasa (persen) Composite Monthly Inflation Rate (q to q) of 3 Cities in Banten Province by Commodity Group (persent)
2013-2016 (2012=100) Table
Tahun dan Bulan
Year and Month
Bahan Makanan
Foodstuff
Makanan Jadi, Minuman, Rokok dan
Tembakau
Prepared Food, Beverages and Tobacco Products
Perumahan, Air, Listrik, Gas dan
Bahan Bakar
Sumber / Source : BPS Provinsi Banten / BPS - Statistics of Banten Province
ht
tp:/
/bant
en.bps
INDIKATOR EKONOMI BANTEN 2016 ECONOMIC INDICATORS
Indeks Harga Price Indices
10
Tabel
1.1.6 Laju Inflasi Bulanan di Kota Serang Menurut Kelompok Barang dan Jasa (persen) Monthly Inflation Rate (q to q) of Serang City by Commodity Group (percent)
2013-2016 (2012=100) Table
Tahun dan Bulan
Year and Month
Bahan Makanan
Foodstuff
Makanan Jadi, Minuman, Rokok dan
Tembakau
Prepared Food, Beverages and Tobacco Products
Perumahan, Air, Listrik, Gas dan
Bahan Bakar
Sumber / Source : BPS Provinsi Banten / BPS - Statistics of Banten Province
ht
tp:/
/bant
en.bps
INDIKATOR EKONOMI BANTEN 2016 ECONOMIC INDICATORS
Indeks Harga Price Indices
11
Tabel
1.1.7 Laju Inflasi Bulanan di Kota Tangerang Menurut Kelompok Barang dan Jasa (persen) Monthly Inflation Rate (q to q) of Tangerang City by Commodity Group (percent)
2013-2016 (2012=100) Table
Tahun dan Bulan
Year and Month
Bahan Makanan
Foodstuff
Makanan Jadi, Minuman, Rokok dan
Tembakau
Prepared Food, Beverages and Tobacco Products
Perumahan, Air, Listrik, Gas dan
Bahan Bakar
Sumber / Source : BPS Provinsi Banten / BPS - Statistics of Banten Province
ht
tp:/
/bant
en.bps
INDIKATOR EKONOMI BANTEN 2016 ECONOMIC INDICATORS
Indeks Harga Price Indices
12
Tabel
1.1.8 Laju Inflasi Bulanan di Kota Cilegon Menurut Kelompok Barang dan Jasa (persen) Monthly Inflation Rate (q to q) of Cilegon City by Commodity Group (percent)
2013-2016 (2012=100) Table
Tahun dan Bulan
Year and Month
Bahan Makanan
Foodstuff
Makanan Jadi, Minuman, Rokok dan
Tembakau
Prepared Food, Beverages and Tobacco Products
Perumahan, Air, Listrik, Gas dan
Bahan Bakar
Sumber / Source : BPS Provinsi Banten / BPS - Statistics of Banten Province
ht
tp:/
/bant
en.bps
INDIKATOR EKONOMI BANTEN 2016 ECONOMIC INDICATORS
Indeks Harga Price Indices
13
Tabel
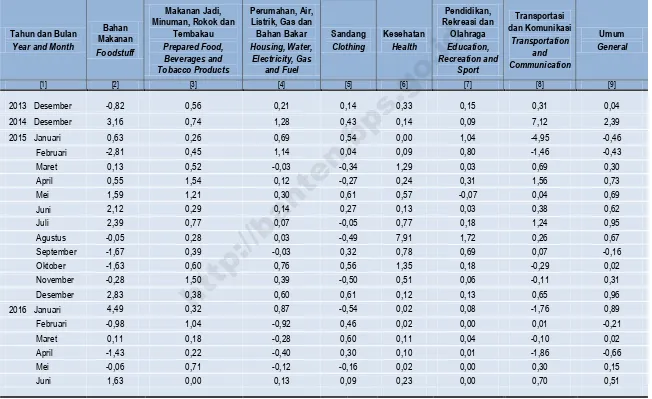
1.1.9 Laju Inflasi Tahun Kalender Gabungan 3 Kota di Provinsi Banten Menurut Kelompok Barang dan Jasa (persen) Composite Year to Date Inflation Rate (y to d) of 3 Cities in Banten Province by Commodity Group(percent)
2013-2016 (2012=100) Table
Tahun dan Bulan
Year and Month
Bahan Makanan
Foodstuff
Makanan Jadi, Minuman, Rokok dan
Tembakau
Prepared Food, Beverages and Tobacco Products
Perumahan, Air, Listrik, Gas dan
Bahan Bakar
Sumber / Source : BPS Provinsi Banten / BPS - Statistics of Banten Province
ht
tp:/
/bant
en.bps
INDIKATOR EKONOMI BANTEN 2016 ECONOMIC INDICATORS
Indeks Harga Price Indices
14
Tabel
1.1.10 Laju Inflasi Tahun Kalender di Kota Serang Menurut Kelompok Barang dan Jasa (persen) Year to Date Inflation Rate (y to d) of Serang City by Commodity Group (percent)
2013-2016 (2012=100) Table
Tahun dan Bulan
Year and Month
Bahan Makanan
Foodstuff
Makanan Jadi, Minuman, Rokok dan
Tembakau
Prepared Food, Beverages and Tobacco Products
Perumahan, Air, Listrik, Gas dan
Bahan Bakar
Sumber / Source : BPS Provinsi Banten / BPS - Statistics of Banten Province
ht
tp:/
/bant
en.bps
INDIKATOR EKONOMI BANTEN 2016 ECONOMIC INDICATORS
Indeks Harga Price Indices
15
Tabel
1.1.11 Laju Inflasi Tahun Kalender di Kota Tangerang Menurut Kelompok Barang dan Jasa (persen) Year to Date Inflation Rate (y to d) of Tangerang City by Commodity Group (percent)
2013-2016 (2012=100) Table
Tahun dan Bulan
Year and Month
Bahan Makanan
Foodstuff
Makanan Jadi, Minuman, Rokok dan
Tembakau
Prepared Food, Beverages and Tobacco Products
Perumahan, Air, Listrik, Gas dan
Bahan Bakar
Sumber / Source : BPS Provinsi Banten / BPS - Statistics of Banten Province
ht
tp:/
/bant
en.bps
INDIKATOR EKONOMI BANTEN 2016 ECONOMIC INDICATORS
Indeks Harga Price Indices
16
Tabel
1.1.12 Laju Inflasi Tahun Kalender di Kota Cilegon Menurut Kelompok Barang dan Jasa (persen) Year to Date Inflation Rate (y to d) of Cilegon City by Commodity Group (percent)
2013-2016 (2012=100) Table
Tahun dan Bulan
Year and Month
Bahan Makanan
Foodstuff
Makanan Jadi, Minuman, Rokok dan
Tembakau
Prepared Food, Beverages and Tobacco Products
Perumahan, Air, Listrik, Gas dan
Bahan Bakar
Sumber / Source : BPS Provinsi Banten / BPS - Statistics of Banten Province