CHAPTER IV
RESEARCH FINDINGS AND DISCUSSION
In this chapter, the data were presented which had been collected from the
research. The data were obtained from the students’ scores in writing descriptive
text in the experiment class who is taught using peer tutoring method and the data
obtained of the students’ scores in writing descriptive text in control class who is
taught without using peer tutoring method.
A.Description of the Data student were 36 students. Then pre test was given to the control class. It was conducted on Thursday, August 13th, 2015, at 10.50 – 11.30 am; in room VII-2 with the number of students were 36 students. The pretest score of both class was explained in Table 4.1
Table 4.1The Description of Pre Test Scores Achieved by the Students in Experimental Class and Control Class
No. Control Class No. Experiment Class
5 C05 59 5 E05 54
Standard Deviation 7.01 Standard Deviation 6.22
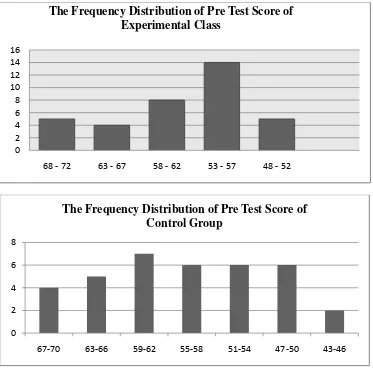
lowest pre test score was 48, the mean of experiment class was 58.61 and the standard deviation of experiment class was 6.22. Meanwhile, the result of research in class VII-2 as control class before being taught by direct method, the highest pre test score was 70 and the lowest pre test score was 43, the mean of control class was 57.15 and the standard deviation of control class was 7.01 As described in Figure 4.1 as follow
Figure 4.1 Histogram of Frequency Distribution of Pre Test Score of Experimental Class and Control Class
0 2 4 6 8 10 12 14 16
68 - 72 63 - 67 58 - 62 53 - 57 48 - 52
The Frequency Distribution of Pre Test Score of Experimental Class
0 2 4 6 8
67-70 63-66 59-62 55-58 51-54 47-50 43-46
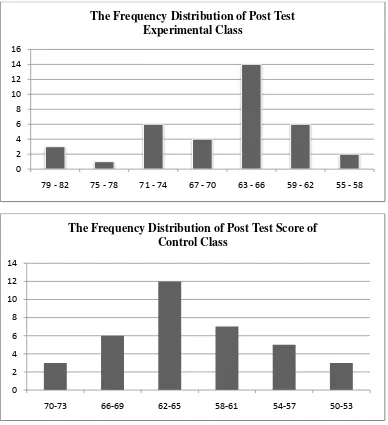
2. The Result of Post Test Score of the Experimental Class and Control Class
The post test was given to the experiment class and control class. First, post test was conducted to the experiment class. It was conducted on Tuesday, Sept 1th, 2015, at 10.50-11.30 am; in room VII-1 with the number of student were 36 students. Then, Post test was conducted to the control class. It was conducted on Thursday, Sept 4th, 2015, at 10.50-11.30 am; in room VII-2 with the number of student were 36 students. The post test score of both class was explained in Table 4.2.
Table 4.2The Description of Post Test Scores Achieved by the Students in Experimental Class and Control Class
No. Control Class No. Experiment Class Improvement
20 C20 64 20 E20 70 6
Standard Deviation 5.48 Standard Deviation 6.21
Figure 4.2 Histogram Frequency Distribution of Post Test Score for Experimental Class and Control Class
B. Testing Normality and Homogeneity
Before analyzing the data, it was calculated the normality and homogeneity as required to test the hypothesis.
0 2 4 6 8 10 12 14 16
79 - 82 75 - 78 71 - 74 67 - 70 63 - 66 59 - 62 55 - 58
The Frequency Distribution of Post Test Experimental Class
0 2 4 6 8 10 12 14
70-73 66-69 62-65 58-61 54-57 50-53
1. Normality
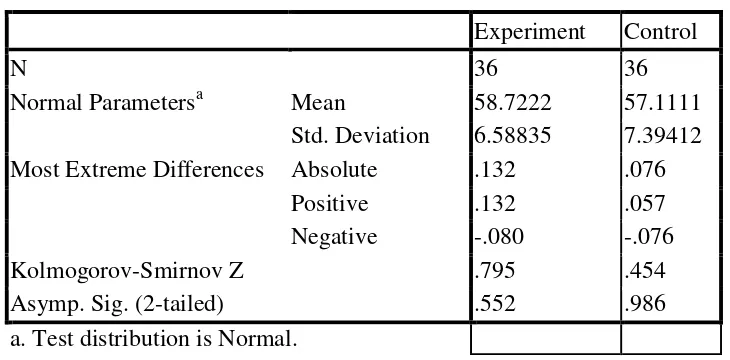
a. Testing of Normality of Pre Test of Experimental Class and Control Class
In this study, one sample kolmogorov-smirnov test was used to examine find the normality.
Table 4.3 Testing of Normality of Pre Test of Experiment Class and Control Class
One-Sample Kolmogorov-Smirnov Test
Experiment Control
N 36 36
Normal Parametersa Mean 58.7222 57.1111
Std. Deviation 6.58835 7.39412 Most Extreme Differences Absolute .132 .076
Positive .132 .057
Negative -.080 -.076
Kolmogorov-Smirnov Z .795 .454
Asymp. Sig. (2-tailed) .552 .986
a. Test distribution is Normal.
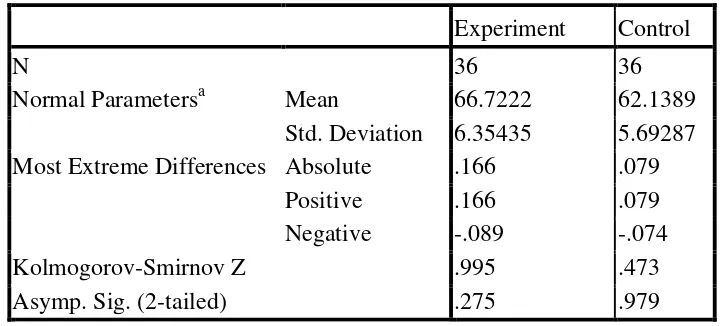
b. Testing of Normality of Post Test of Experimental Class and Control Class
In this study, was used One Sample Kolmogorov-Smirnov Test to find the normality.
Table 4.4 Testing of Normality of Post Test of Experiment Class and Control Class
One-Sample Kolmogorov-Smirnov Test
Experiment Control
N 36 36
Normal Parametersa Mean 66.7222 62.1389
Std. Deviation 6.35435 5.69287 Most Extreme Differences Absolute .166 .079
Positive .166 .079
Negative -.089 -.074
Kolmogorov-Smirnov Z .995 .473
Asymp. Sig. (2-tailed) .275 .979
a. Test distribution is Normal.
2. Homogeneity
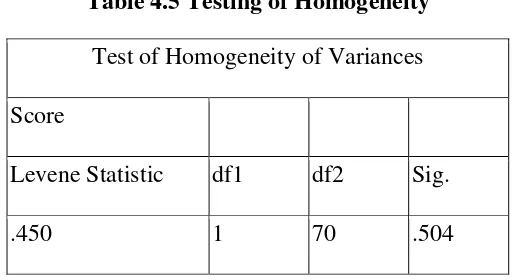
In this study, was used Levene Statistic to examine the homogeneity as can be seen in Table 4.5.
Table 4.5 Testing of Homogeneity Test of Homogeneity of Variances
Score
Levene Statistic df1 df2 Sig.
.450 1 70 .504
Based on the table above, it could be seen that the result of homogeneity calculation using SPSS program was 0.504. Then, the result of homogeneity was interpreted on f table with level of significance 5% (0.05). It was found that f value was higher than f table at 5% significance level (0.50 > 0.05). It meant both of variances were homogeneity as required to test the hypothesis using T- test.
C.The Result of Data Analysis
1. Testing Hypothesis Using Manual Calculation
T test formula was used to examine hypothesis, before hypothesis was examined, the score was tabulated of standard deviation and standard error into table as follows:
Table 4.6 The Standard Deviation and the Standard Error of Experiment Class and Control Class
Group Standard Deviation Standard Error
Experiment 6.21 1.05
Based on the table above, it could be seen that the result of the standard deviation calculation of experiment class was 6.21 and the result of the standard error calculation of experiment class was 1.05 meanwhile, the result of the standard deviation calculation of control class was 5.47and the result of the standard error calculation of control class was 9.25. Then was calculated the standard error of mean of difference.
𝑆𝐸𝑚1− 𝑆𝐸𝑚2 = 𝑆𝐸𝑚12 +𝑆𝐸𝑚22
= 104952 + 92572
= 110145025 + 86025625
= 196170650
= 14006093316838 = 1400
Then, to examine the hypothesis, the writer used the formula as follow:
𝑡𝑜= 𝑀1− 𝑀2
𝑆𝐸𝑚1− 𝑆𝐸𝑚2
=66.9−62.5 1400
= 4.4 1400
Next, was accounted degree of freedom (df) with the formula as follow:
𝑑𝑓 = (𝑁1 +𝑁2−2)
= 36 + 36−2
= 70
After that, was interpreted the result of t test. To know the hypothesis was accepted or rejected, the writer used the criterion as follow:
If t-test ≥ ttable, it meant Ha was accepted and Ho was rejected. If t-test ≤ ttable, it meant Ha was rejected and Ho was accepted.
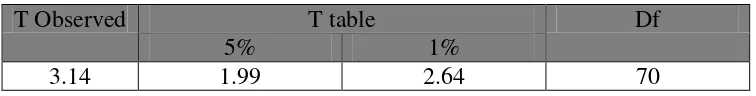
The next step, was tabulated the result of the t test calculation into table 4.7 as follows:
Table 4.7 The Result of T Test Using Manual Calculation
T Observed T table Df
5% 1%
3.14 1.99 2.64 70
Based on the table above, it could be seen that the result of t test using manual calculation was 3.14 and the result of degree of freedom (df) calculation was 70. Then the result of t test was interpreted on the result of degree of freedom to get value of the ttable. It was found that tobserved was higher than ttable at 5% and 1%
significance level (1.99 < 3.14 > 2.64). It meant Ha stating that there is significant
between the students who taught using peer tutoring and those who taught by direct method at seventh grade SMPN 3 SAMPIT was rejected. It showed that teaching writing using peer tutoring gave effect on writing ability at the seventh grade students at SMPN 3 SAMPIT.
2. Testing Hypothesis Using SPSS 16.0 Program
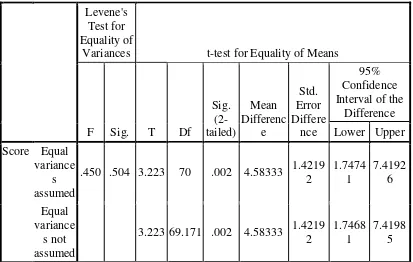
SPSS 16.0 Program was used to examine the hypothesis. The result of t test using SPSS 16.0 Program was used to support the result of t test using manual calculation. The result of t test using SPSS 16.0 Program could be seen in table 4.8 as follow:
Table 4.8 The Calculation of T Test Using SPSS 16.0 Program Independent Samples Test
Levene's Test for Equality of
Variances t-test for Equality of Means
interpreted on the result of degree of freedom to get value of the ttable. It was found
that tobserved was higher than the ttable at 5% and 1% significance level (1.99 <
3.223 > 2.64). It meant Ha was accepted and Ho was rejected.
D.Interpretation
The hypothesis testing used T-test to measure the significant effect of peer
tutoring to increase students’ ability in writing descriptive text. First, based on
the manual calculation and SPSS 16 program , it was found the tobserved was
greater than the ttable at 1% and 5% the level significance or (1.99 < 3.14 >
2.64. It could be concluded that using peer tutoring method toward the
students’ ability in writing descriptive text was significant. The result of using
peer tutoring method toward the students’ ability in writing descriptive text
had better mean (66.86) than student’s who taught without peer tutoring with
mean (61.94).
Based on the result of the research, was interpreted that Ha stating that peer tutoring was effective for the students’ writing ability at the seventh
grade students at SMPN 3 SAMPIT was accepted and Ho stating that peer tutoring was not effective for the students’ writing ability at the seventh grade
students at SMPN 3 SAMPIT was rejected. It meant that teaching writing using peer tutoring gave effect on writing ability at the seventh grade students at SMPN 3 SAMPIT.
E. Discussions
seen from the students who were taught using peer tutoring method got higher score than the students who were taught without using peer tutoring method
(direct method). It proved by the students’ post test result in which most of
their score were improved. (It could be seen at appendix 6, for the detail
explanation of students’ score). The finding was suitable with M. Syaichul
Muchyidin S. on his research stated that teaching writing by using peer tutoring is more effective than the one using direct method.
After the data was calculated using manual calculation with t test formula, it was found that tobserved was higher than ttable at 5% and 1% significance level
(1.99 < 3.22 > 2.64). It meant Ha was accepted and Ho was rejected. This
finding indicated that the alternative hypothesis (Ha) stating that using peer tutoring gave effect to students’ writing ability at the seventh grade students
at SMPN 3 SAMPIT was accepted. In other words, the null hypothesis (Ho)
stating that using peer tutoring did not gave effect to students’ writing ability at the seventh grade students at SMPN 3 SAMPIT was rejected.
There were some reasons why using peer tutoring gave effect on writing ability at the seventh grade students at SMPN 3 SAMPIT. First, peer tutoring
increased the students’ score. It could be seen from score of mean between pre
test and post test of experiment class. The score of mean in post test was higher than the score of mean in pre test (Post test = 66.9 > pre test = 58.6). (It could be seen at appendix 7, for the detail explanation of calculating the data).
It indicated that the students’ score increased after was conducted treatment. It
tutoring based on Vygostsky’s concept of ZPD and Scaffolding did better
than the students taught through conventional method of teaching English.1 Second, through peer tutoring, the peer tutoring are able increase cognitive ability the students. It supported by Vygotsky argued that in addition to teachers, peers also have an important effect on the cognitive development of children, as opposed to learning. Vygotsky stated views interaction with peers as an effective way of developing skills and strategies. he suggests that teachers use cooperative learning exercises where competent children develop with help from more skillful peers.2
Third, peer tutoring could motivate the students in improve the quality learning. It supported by dobos et al, biggs, bruffe and boud et al stated that peer tutoring are able increase motivation, which is to improve the quality of the learning process and the 'product' teaching.3
Based on the result the study there are students’ responses related to peer tutoring method writing descriptive text. In the teaching learning process using peer tutoring, student response was good, the students became interested in learning to use peer tutoring, difficult to understand at the first meeting but can be understood at the next meeting. Students argued that peer tutoring methods was very attractive for used in learning, but it is difficult to be applied if there is no teacher in the classroom.
1
Razia, Rizvein, The Effect of Peer Tutoring on Student Achivment in the Subject of English at Secondary Level in the Light eory, Unpublished Thesis, Pakistan: Foundation University College of Liberal Arts and Sciences Islamaabad- Pakistan. 2012, p. 190-191.
2
Daniel Mujis dan David Reynolds, Effective Teaching. Terj. Helly Prajitno Soetjipto dan Sri Mulyatini. Yogyakarta:Pustaka Pelajar, 2008. P. 28
3
Although based on statistical calculation interpreted that the alternative
hypothesis state that the peer tutoring method increased the students’ writing