Open Access
Research article
Assessing the validity of tuberculosis surveillance data in California
Joan E Sprinson
1, Elizabeth S Lawton
1, Travis C Porco
1,2,
Jennifer M Flood*
1,3and Janice L Westenhouse
1Address: 1TB Control Branch, Division of Communicable Disease Control, California Department of Health Services, 850 Marina Bay Parkway,
Building P, 2nd floor, Richmond, CA 94804–6403, USA, 2Center for Infectious Disease Preparedness, University of California at Berkeley School
of Public Health, 1918 University Avenue, 4th floor, MC 7350, Berkeley, CA 94720–7350, USA and 3Box 1211 – EXCP, University of California
of San Francisco, San Francisco, CA 94143–1211, USA
Email: Joan E Sprinson - [email protected]; Elizabeth S Lawton - [email protected]; Travis C Porco - [email protected]; Jennifer M Flood* - [email protected]; Janice L Westenhouse - [email protected]
* Corresponding author
Abstract
Background: The Centers for Disease Control and Prevention (CDC) convened a workgroup to revise the tuberculosis (TB) case report in the United States of America (U.S.). The group proposed substantial revisions. Study objectives were to systematically assess the validity and completeness of reported TB case surveillance data in California and to inform TB case report revision process.
Methods: A sample of 594 cases was retrospectively selected from the cohort of all TB cases reported during 6/1/96-5/31/97 to the State TB Registry. Cases, stratified by treatment outcome, were randomly sampled within each outcome category. Data for 53 variables were abstracted from each case's public health medical record and compared to data recorded on the TB case report. Using the medical record as the "gold standard," estimates were developed for 1) concordance, sensitivity, and positive predictive value of reported data for categorical variables; 2) the absolute mean difference between the two information source for date variables; and 3) the completeness of data on the case report and in medical record.
Results: At least 90% of the values for 35 (79.5%) categorical variables submitted on the TB case report form were identical to values in the medical record. Concordance between data on the case report and medical record was lower for the remaining nine (20.5%) categorical variables: status of abnormal chest x-ray (46.8%); directly observed therapy (48.6%); smear result for tissue or body fluid other than sputum (49.2%); type(s) of tissue or body fluid for smears and cultures other than sputum (76.4% and 73.9% respectively); provider type (73.4%); occupation (84.4%); sputum culture conversion (85.4%); and sputum smear result (89.6%). Case report data were more complete than data in the medical record; 2.9% versus 9.8% of data were missing/unknown, respectively.
Conclusion: For most variables examined on the TB case report, data validity was excellent, indicating a robust surveillance system. However, lower data quality was noted for a small number of variables primarily impacting treatment adherence, including assessment and planning; advocacy; allocation and garnering of resources; and research. The study provides compelling evidence supporting the CDC workgroup's proposed revisions to the TB case report.
Published: 25 August 2006
BMC Public Health 2006, 6:217 doi:10.1186/1471-2458-6-217
Received: 20 January 2006 Accepted: 25 August 2006
This article is available from: http://www.biomedcentral.com/1471-2458/6/217
© 2006 Sprinson et al; licensee BioMed Central Ltd.
Background
Tuberculosis (TB) surveillance data are essential to evalu-ate the effectiveness of TB control programs, identify defi-ciencies, and design and assess interventions. Surveillance data are also critical in advocacy efforts and in garnering and allocating resources. For these reasons, the World Health Organization's (WHO) enhanced DOTS initiative [1-3] and the Centers for Disease Control and Prevention (CDC) emphasize the importance of monitoring and evaluating program performance [4,5]. In order to per-form these important functions, it is essential that the right variables are collected and reported in a timely man-ner, and that these data are valid and complete. Inade-quate data quality may impair our understanding of the true epidemiology of TB, compromise core program func-tions, and undermine our ability to meet program objec-tives and goals. Although the availability of accurate and complete TB surveillance data varies considerably by region and by country, these data provide an essential tool for local, national, and global efforts to control and elim-inate TB.
Since 1985, all 50 states within the United States of Amer-ica (U.S.) have collected and submitted data for each con-firmed TB case to the CDC on the Report of Verified Case of Tuberculosis (RVCT). In January 1993, in response to the TB resurgence in the U.S., CDC increased the length of the RVCT from 1 to 4 pages, the number of questions from 23 to 41, and the number of variables from 37 to 114 [6,7]. The RVCT collects the following categories of infor-mation on confirmed TB cases: personal identifier, demo-graphic, social/behavioral risk factor, clinical, treatment, outcome, and case management. The CDC convened a workgroup of local and state TB surveillance directors to examine the need for revisions to the RVCT and accompa-nying instructions. Over a two year period, the workgroup developed a draft that proposed substantial revisions. At this time, RVCT revisions are still in process. As the draft undergoes review by stakeholders, further revisions are anticipated, with implementation of the revised case report form planned for 2008 (V. Robison, Chief of Sur-veillance Team, Division of Tuberculosis Elimination, CDC, personal communication; 6/8/06).
In California, a state which for many years has reported over 20% of U.S. TB cases, medical providers report sus-pected and confirmed TB cases to the 61 local health juris-dictions in which the case resides. Local health departments report confirmed cases, either electronically or manually, to the California TB Registry in the state health department. This reporting occurs: 1) at TB case confirmation; 2) when the health department receives ini-tial drug susceptibility test results (for culture positive cases); and 3) when final treatment outcome information is available, typically 6–18 months after treatment is
initi-ated. Local health departments may also submit updated information to the State TB Registry subsequent to the ini-tial case report submission. After the submission of RVCTs, State Registry staff perform systematic quality con-trol (QC) checks of data and collaborate with local TB reg-istry staff to ensure valid and complete data.
To our knowledge, there are no published studies that have comprehensively assessed the validity and complete-ness of TB surveillance data in the U.S. or within Califor-nia. Two U.S. researchers who examined the quality of TB surveillance data for a small number of variables found inaccuracies when comparing information obtained from public health medical records and electronic case reports. In one report, a state health department found substantial differences in the values of ten variables at six local health districts [8]. In another study of causes for delayed treat-ment completion in three state cohorts, incorrect report-ing in one state resulted in misclassification of therapy completion status for 36% of its cases [9].
The primary objectives of this study were to systematically assess the validity and completeness of RVCT data in Cal-ifornia and to inform the RVCT revision process.
Methods
This evaluation of the validity and completeness of TB sur-veillance data used data from two sources: 1) a case study conducted by the California Department of Health Serv-ices in 1999 on adverse outcomes during treatment of Cal-ifornia TB patients; and 2) RVCTs submitted to the California TB Registry for cases in this study population. There were 594 cases in the study population, sampled from a cohort of 2,627 eligible cases reported during 6/1/ 96-5/31/97 to the California TB Registry. Cases in the study population met the following criteria: alive at diag-nosis; started TB therapy for culture positive TB disease; resided in one of 18 California counties reporting ≥ 50 cases during the study period; did not move outside Cali-fornia during TB treatment; had drug susceptibility testing results available. A stratified random sample design was used to select cases by reported treatment outcome. The sample consisted of 17.7% of patients who completed treatment, 93.2% of patients defaulting from treatment (defined as patient lost, uncooperative, or refused treat-ment), and 46.7% of patients who died during treatment reported in the study period. RVCTs from all 18 participat-ing local health jurisdictions were submitted electroni-cally to the California TB Registry.
review and patient consent were not required. Informa-tion collected included baseline socio-demographic, clin-ical, and provider characteristics; treatment information, including initial regimens, the number of doses of anti-TB medications, documentation of bacterial conversion of sputum cultures from positive to negative, and case man-agement characteristics such as therapy administration and assessment of risk factors for treatment non-adher-ence. For patients whose care was managed or co-man-aged by the health department (approximately two-thirds of the sample), the public health medical record was essentially the same as the patient record. For patients whose TB treatment was managed by private practitioners, the public health medical record (hereinafter referred to as the medical record) was frequently less complete, but typically contained information sufficient for health department oversight and reporting, including socio-demographic, clinical, and treatment information, and documentation of medical oversight and case manage-ment activities provided by the health departmanage-ment. Since local health departments use the medical record as the pri-mary information source to complete the RVCT, and all reported information should be contained in this record, we considered it the "gold standard." Study staff did not abstract information from the RVCT if a paper RVCT form was included in the medical record, but all other data per-taining to RVCT variables of interest were abstracted from the medical record.
We used the California-specific RVCT reporting instruc-tions in effect during the study period to determine how information contained in the medical record should have been reported [10]. These instructions, based largely on CDC reporting instructions, contain additional detail for a small number of variables. With minor exceptions, these reporting instructions have remained in effect from the study period until the present.
We assessed the validity of reported data for 53 RVCT var-iables, consisting of 44 categorical variables and nine dates. Table 1 presents a breakdown of the types of varia-bles, values, and validation measures estimated. We fol-lowed the CDC's recommendations for assessing data quality in public health surveillance systems [11]. Specifi-cally, we estimated the sensitivity and the predictive value of the positive (PVP) reported value for each categorical variable. We defined sensitivity as the probability of a pos-itive value on the RVCT given documentation of a pospos-itive value in the medical record. We defined the PVP as the probability of a documented positive value in the medical record given a positive value on the RVCT. We also esti-mated the concordance, as a general measurement of agreement, between data in the medical record and the RVCT. We excluded from the validation analyses all null
values and values of 'unknown' and 'not done' on the RVCT and 'not charted' in the medical record.
In order to maximize the comparability of the RVCT and medical record for sputum smear and sputum culture results, we restricted the validation of these variables to results from patients diagnosed with pulmonary TB dis-ease only who did not have positive results associated with smear and/or culture non-sputum specimens. This restriction was necessary because the field study did not distinguish between results from sputum specimens, other types of pulmonary specimens such as bronchial wash or tracheal aspirate, and specimens from non-pul-monary sites, whereas the RVCT distinguishes between sputum and non-sputum specimen results. We also cre-ated a variable for site of TB disease based on the sites of smear and culture specimens documented in the medical record and compared this to a variable calculated from reported information regarding TB disease site.
We calculated two validation measures for dates: the abso-lute mean difference in days (seven dates) or months (two dates) between the RVCT and the medical record.
To assess the completeness of data from the case report and the medical record, we estimated the proportion of missing/unknown data in both data sources for all varia-bles. For nine RVCT variables, values are expected depend-ing on the value of another variable (e.g., a value for type of chest x-ray abnormality or status of chest x-ray is expected only if chest x-ray results are abnormal). For these nine variables, we restricted our estimate of missing/ unknown values to instances in which a subsequent value was expected, but missing, and did not count expected absent values as 'missing'. We also excluded the value, 'not done,' from the estimate of the proportion of missing/ unknown values for 15 RVCT variables associated with test results.
Results and discussion
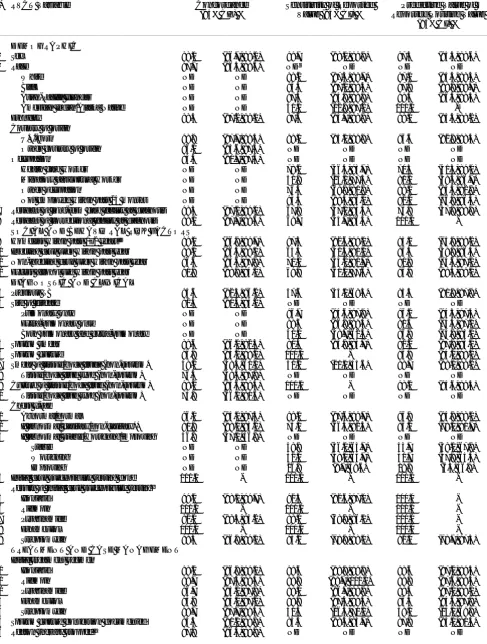
Most reported data submitted to the California TB Regis-try on the RVCT were highly concordant with data abstracted from the public health medical record. Survey-weighted mean validation measures for 44 categorical var-iables examined are presented in Table 2. Henceforth, all results are presented as survey-weighted mean estimates for the statewide cohort from which the sample was drawn. Across all categorical variables, concordance ranged from 46.8–100.0%; sensitivity from 26.4–100.0%; and PVP from 1.1–100.0%. Concordance ranged from 84.4–99.0% for demographic data, 91.8–99.1% for social/behavioral risk factor data, 46.8–100.0% for diag-nostic and clinical data, and 48.6–100.0% for treatment and case management data. At least 90% of the reported values for 35 (79.5%) categorical variables were identical with values in the medical record. Reported data for the remaining nine (20.5%) categorical variables had lower concordance with the medical record: status of abnormal chest x-ray (46.8%); directly observed therapy (48.6%);
smear result for tissue or body fluid other than sputum (49.2%); type(s) of tissue or body fluid for smears and cultures other than sputum (76.4% and 73.9% respec-tively); provider type (73.4%); occupation (84.4%); spu-tum culture conversion (85.4%); and spuspu-tum smear result (89.6%).
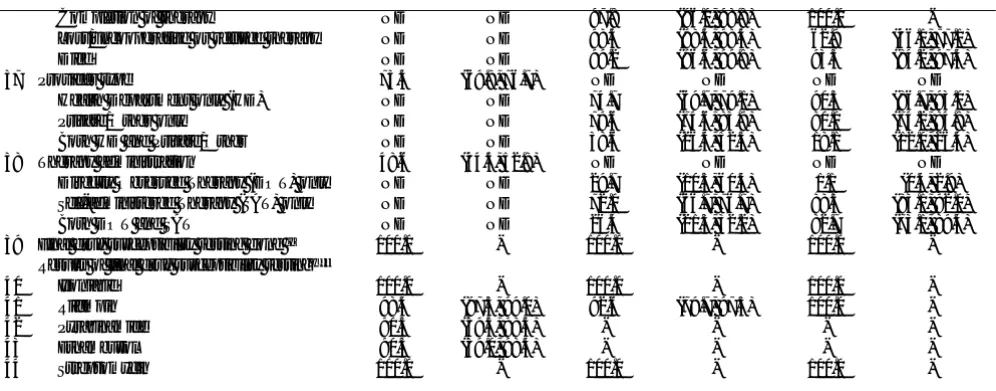
Results for the validity of dates are shown in Table 3. The weighted mean absolute difference in dates in a month-day-year format ranged from 2.6–110.9 days. For dates in a month-year format, the weighted mean absolute differ-ence ranged from 0.7–11.5 months.
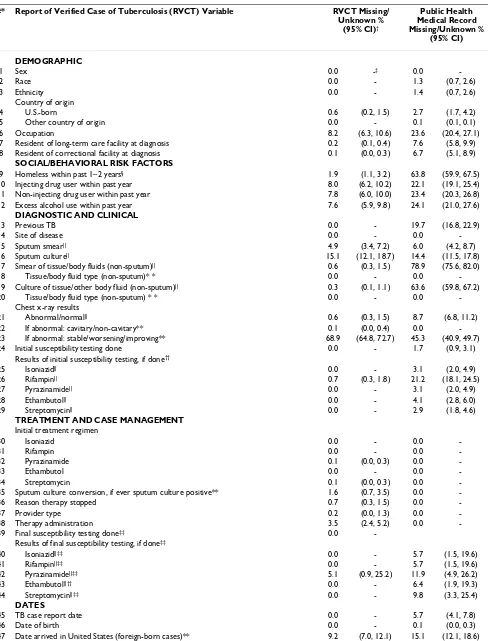
The proportion of missing/unknown data for categorical variables and dates for both the RVCT and the medical record is presented in Table 4. Across all variables, the pro-portion of missing/unknown data on the RVCT ranged from 0.0% to 68.9%, and, for the medical record, the pro-portion of missing/unknown data ranged from 0.0% to 78.9%. Certain RVCT variables associated with clinical
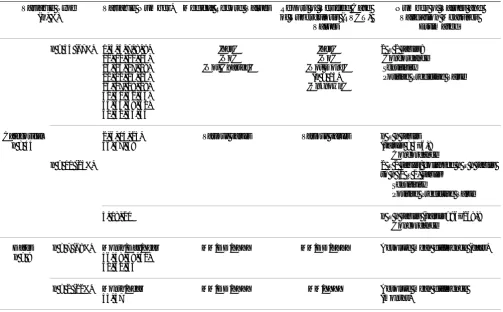
Table 1: Summary of variables and validation measures estimated in the medical record and case report
Variable Type (n, %)
Variable Number* Medical Record Values Report of Verified Case of Tuberculosis (RVCT)
Values
Number of Values and Validation Measures
Various values Various values n × n tables
(values = 3–6):
5, 18, 20 n × n tables (values=96–268):
Concordance
Dates n = 9
n = 7 (78%) Month/Day/Year 46, 48, 49, 50, 51, 52, 53
MM/DD/YYYY MM/DD/YYYY Absolute mean difference (days)
n = 2 (22%) Month/Year 45, 47
MM/DD/YYYY MM/YYYY Absolute mean difference
(months)
* See Table 2, first column, for variable number (Note: these numbers do not correspond to the variable numbers on the RVCT form).
† For each of the n values, we constructed a 2 × 2 table from (1) the number of individuals for which the medical record and RVCT both exhibited that value, (2) the number for which only the medical record exhibited that value, (3) the number for which only the RVCT exhibited that value, and (4) the number for which neither exhibited that value. Specifically, for each k (k = 1, ..., n), we constructed a collapsed 2 × 2 table of values
Table 2: Weighted mean validation measures for categorical variables in Report of Verified Case of Tuberculosis (RVCT)
#* RVCT Variable Concordance
(95% CI†) %
Sensitivity of Reported Value (95% CI) %
Predictive Value of Reported Positive Value
(95% CI) %
DEMOGRAPHIC
1 Sex 98.1 (96.7, 99.0) 99.7 (98.0, 99.9) 97.5 (95.3, 98.6)
2 Race 97.7 (96.3, 98.6) ND‡ ND ND ND
White ND ND 99.2 (97.5, 99.7) 97.0 (94.4, 98.4)
Black ND ND 95.3 (87.1, 98.4) 97.9 (88.8, 99.7)
Asian-Pacific Islander ND ND 97.5 (94.9, 98.8) 98.4 (96.3, 99.3)
American Indian/Alaska Native ND ND 50.0 (12.8, 87.2) 100.0 -§
3 Ethnicity 98.5 (97.2, 99.1) 97.6 (94.7, 98.9) 98.1 (95.5, 99.2)
Country of origin
4 U.S.-born 98.9 (97.7, 99.4) 99.1 (95.1, 99.9) 96.6 (92.8, 98.4)
5 Other country of origin 96.0 (93.6, 97.5) ND ND ND ND
6 Occupation 84.4 (80.7, 87.5) ND ND ND ND
Health care worker ND ND 78.2 (46.4, 93.7) 70.5 (41.3, 89.0)
Migratory agricultural worker ND ND 51.8 (25.1, 77.5) 81.1 (38.3, 96.7)
Other occupation ND ND 76.4 (69.8, 81.9) 89.0 (83.3, 92.9)
Not employed within past 24 months ND ND 93.5 (89.5, 96.0) 82.2 (76.9, 86.5)
7 Resident of long-term care facility at diagnosis 98.3 (97.1, 99.0) 67.8 (47.1, 83.3) 76.8 (57.8, 88.9)
8 Resident of correctional facility at diagnosis 99.0 (97.7, 99.6) 69.7 (45.7, 86.3) 100.0
-SOCIAL AND BEHAVIORAL RISK FACTORS
9 Homeless within past 1–2 years|| 99.1 (96.9, 99.7) 97.3 (92.6, 99.0) 95.1 (75.9, 99.2)
10 Injecting drug user within past year 98.1 (96.5, 99.0) 63.5 (41.5, 81.0) 86.5 (59.8, 96.5)
11 Non-injecting drug user within past year 96.6 (94.6, 97.9) 70.1 (55.2, 81.7) 90.9 (74.6, 97.1)
12 Excess alcohol use within past year 91.8 (88.8, 94.0) 69.9 (61.0, 77.6) 96.8 (89.3, 99.1)
DIAGNOSTIC AND CLINICAL
13 Previous TB 94.6 (92.3, 96.2) 57.6 (45.0, 69.3) 93.5 (81.9, 97.9)
14 Site of disease 92.5 (90.4, 94.2) ND ND ND ND
Pulmonary only ND ND 96.7 (94.6, 97.9) 96.2 (94.3, 97.4)
Extra-pulmonary only ND ND 98.6 (96.8, 99.4) 81.6 (74.4, 87.0)
Both pulmonary and extra-pulmonary ND ND 51.1 (39.7, 62.4) 86.9 (73.9, 94.0)
15 Sputum smear 89.6 (86.0, 92.3) 90.5 (85.8, 93.7) 92.2 (87.9, 95.1)
16 Sputum culture 96.8 (94.2, 98.2) 100.0 - 96.8 (94.2, 98.2)
17 Smear of tissue/body fluids (non-sputum) 49.2 (38.4, 60.0) 31.2 (21.0, 43.6) 98.7 (98.1, 99.2)
18 Tissue/body fluid type (non-sputum) 76.4 (59.3, 87.8) ND ND ND ND
19 Culture of tissue/body fluid (non-sputum) 98.2 (94.6, 99.4) 100.0 - 98.2 (94.6, 99.4)
20 Tissue/body fluid type (non-sputum) 73.9 (66.0, 80.6) ND ND ND ND
Chest x-ray
21 Abnormal/normal 96.0 (94.0, 97.3) 99.1 (97.6, 99.7) 96.8 (94.8, 98.0)
22 If abnormal: cavitary/non-cavitary** 90.9 (88.0, 93.2) 75.1 (66.3, 82.3) 86.2 (78.0, 91.7)
23 If abnormal: stable/worsening/improving 46.8 (37.0, 56.9) ND ND ND ND
Stable ND ND 49.9 (36.0, 63.7) 53.7 (39.0, 67.9)
Worsening ND ND 52.0 (38.0, 65.7) 51.7 (37.8, 65.4)
Improving ND ND 26.9 (8.7, 58.6) 19.8 (6.5, 46.8)
24 Initial drug susceptibility testing done 100.0 - 100.0 - 100.0
-Results of initial drug susceptibility testing††
25 Isoniazid 99.2 (98.1, 99.7) 92.5 (82.6, 97.0) 100.0
-26 Rifampin 100.0 - 100.0 - 100.0
-27 Pyrazinamide 92.1 (89.3, 94.2) 88.1 (68.8, 96.1) 100.0
-28 Ethambutol 100.0 - 100.0 - 100.0
-29 Streptomycin 98.3 (96.8, 99.1) 93.2 (78.8, 98.0) 92.0 (78.7, 97.3)
TREATMENT AND CASE MANAGEMENT Initial treatment regimen
30 Isoniazid 98.2 (96.8, 99.0) 99.6 (98.8, 99.9) 98.6 (97.2, 99.3)
31 Rifampin 98.7 (97.5, 99.4) 99.9 (99.7, 100.0) 98.8 (97.6, 99.4)
32 Pyrazinamide 96.7 (95.1, 97.8) 98.1 (96.7, 98.9) 98.4 (97.1, 99.1)
33 Ethambutol 95.9 (94.0, 97.2) 98.8 (97.4, 99.4) 96.5 (94.6, 97.8)
34 Streptomycin 98.7 (97.7, 99.3) 40.3 (16.3, 70.1) 38.1 (14.1, 69.9)
35 Sputum culture conversion documented 85.4 (81.1, 88.8) 93.3 (89.5, 95.7) 87.8 (83.0, 91.3)
tests have a value of 'not done.' Since the field study did not distinguish between 'not done' and 'not charted' for these variables and recorded both as 'not charted,' a higher proportion of missing/unknown values was noted in the medical record for variables such as results of microscopic smear and culture of other tissue and body fluids.
This is the first study in the U.S. to assess data validity and completeness for the majority of the variables on the RVCT. As the largest single reporter of U.S. TB surveillance data, reporting over 4,000 cases during the 12-month study period, our findings may have direct implications for data quality of the U.S. TB surveillance system. These findings may also be relevant to TB control programs in other U.S. reporting areas or regions of the world. Areas with established TB surveillance systems may benefit from specific findings and evaluation methodology presented [16], while regions with nascent surveillance systems may apply general findings toward the successful development and implementation of surveillance systems.
Our study found generally excellent data validity and completeness for the RVCT variables assessed. From the vantage point of disease control, the most important var-iables, including initial drug regimen, initial drug suscep-tibility test results, and patient outcome, were found to be valid. These findings indicate a robust surveillance system
that completely and accurately captures essential informa-tion to support TB control activities. The nine RVCT vari-ables noted for which data was less concordant with the medical record included demographic, clinical, and case management variables. Data quality for some of these var-iables may impair program planning and evaluation efforts, especially in the areas of treatment adherence and treatment response, policy development, research, pro-gram advocacy, and the allocation of resources for TB con-trol efforts. Variables with potentially the greatest impact on these activities are discussed below in the order of importance.
Ensuring patient adherence to treatment is a core function of TB control programs. Non-adherent patients may be involved in on-going disease transmission and are at increased risk of treatment failure and developing drug-resistant disease [5,17-19]. Directly observed therapy administration (DOT), in which health department per-sonnel watch the patient swallow each dose of medica-tion, is recommended by WHO and CDC to ensure adherence through the required six to nine months of TB treatment (and longer for treatment of multi-drug resist-ant disease)[1,2,4,20]. Since completion of TB therapy is based on receipt of a prescribed number of doses of a ther-apeutic regimen, DOT also ensures that patients receive the correct number of doses to complete therapy and achieve cure.
Completion of therapy ND ND 97.8 (96.0, 98.8) 100.0
-Lost/uncooperative or refused therapy ND ND 98.4 (98.4, 98.4) 62.9 (46.1, 77.1)
Died ND ND 99.2 (96.6, 99.8) 93.3 (84.2, 97.4)
37 Provider type 73.4 (69.8, 76.7) ND ND ND ND
Health Department only (HD) ND ND 74.7 (69.7, 79.1) 90.3 (86.7, 93.0)
Private/Other only ND ND 79.6 (74.6, 83.9) 80.0 (74.2, 84.8)
Both HD and Private/Other ND ND 38.6 (26.4, 52.5) 18.1 (12.0, 26.4)
38 Therapy administration 48.6 (44.4, 52.8) ND ND ND ND
Directly Observed Therapy (DOT) only ND ND 29.7 (10.5, 60.4) 1.1 (0.4, 2.9)
Self-administered Therapy (SAT) only ND ND 72.0 (66.7, 76.7) 88.3 (83.1, 92.0)
Both DOT and SAT ND ND 26.4 (21.3, 32.2) 82.7 (73.1, 89.4)
39 Final drug susceptibility testing done ‡‡ 100.0 - 100.0 - 100.0
-Results of final drug susceptibility testing††§§
40 Isoniazid 100.0 - 100.0 - 100.0
-41 Rifampin 98.4 (97.3, 99.0) 92.6 (79.7, 97.5) 100.0
-42 Pyrazinamide 90.5 (59.5, 98.4) - - -
-43 Ethambutol 90.3 (59.0, 98.4) - - -
-44 Streptomycin 100.0 - 100.0 - 100.0
-Note: All results are presented as survey-weighted mean estimates for the statewide cohort from which the sample was drawn. * Variable number (see Table 1)
† Confidence interval ‡ Not determined, by design
§ No value computed (e.g., division by 0)
|| RVCT defines homeless within 1 year of diagnosis; medical record review defined homeless within 2 years of diagnosis
** RVCT values: cavitary, non-cavitary consistent with TB, non-cavitary not consistent with TB; medical record review values: cavitary, abnormal/ non-cavitary
†† As a result of a very small number of second-line drug susceptibility test results, these results are not presented. ‡‡ Excludes 9 cases: 1 case without TB; 5 cases reported as 'moved' on RVCT; 3 cases reported as 'other" on RVCT
To support the core function of DOT, TB control programs must have valid data with which to evaluate the effective-ness of their DOT activities. RVCT instructions define 'DOT only' as 100% of doses by DOT; 'self-administered therapy only (SAT)' as 0 doses by DOT; and 'both DOT and SAT' as ≥1 DOT dose and ≥1 SAT dose. However, local health departments generally do not implement these strict definitions, which would require them to report therapy given predominantly by DOT or predominantly by SAT as 'both DOT and SAT,' thereby significantly limit-ing the usefulness of this value. The approach to reportlimit-ing this variable varies widely by jurisdiction and within juris-dictions (JES personal experience). Concordance between data on the RVCT and the medical record for 'DOT only' was 48.6%. However, the PVP for reported 'DOT only' was 1.1%, indicating that DOT, as defined in the reporting instructions, is rarely provided when it is reported. The PVP for reported 'SAT only,' by comparison, was 88.3%, indicating that 'SAT only' is employed when reported for the vast majority of cases. Thus 'SAT only' may be a more valid indicator of therapy administration. For this reason, many local TB control programs and the state health department in California use 'inappropriate SAT' to eval-uate their DOT programs.
The CDC workgroup proposed substantial revisions for this variable, increasing the current three categories to five. Under these proposed revisions, 'total DOT' is defined as 90–100% of doses by DOT, 'predominantly DOT' as 80–89% DOT, and 'predominantly SAT' is defined as 1–49% doses by DOT. The five proposed values correspond to the impact that varying proportions of treatment given by DOT are likely to have on adherence and much better conform to the realities of therapy
administration in local health departments. Under this proposed revision, the reported PVP for therapy provided at least predominantly by DOT would improve from 1.1% to 49.9% (not shown). The proposed revised definition of therapy administration is likely to result in substantially more valid and meaningful data for this variable. How-ever, even with these revisions, the challenges local pro-grams face in accurately counting doses received by DOT over a patient's entire treatment may continue to result in inaccurate reporting of the proportion of DOT doses after revised definitions are implemented.
Although CDC recommends universal DOT for TB ther-apy [4], many California TB control programs do not have sufficient resources to provide universal DOT. In this cir-cumstance, it is recommended that programs prioritize patients for DOT by factors associated with an increased risk of treatment non-adherence and/or the consequences of non-adherence [20]. Drug and alcohol abuse and homelessness figure largely in these factors. Although concordance between data on the RVCT and in the medi-cal record for drug and alcohol abuse ranged from 91.8– 98.1%, sensitivity for reported data ranged from 63.5– 70.1%. The latter finding indicates that the medical record documented the presence of one or more of these factors approximately one-third more often than was reported on the RVCT.
This review highlighted another issue related to the reporting of these social/behavioral risk factor variables. A relatively high proportion (ranging from 22.1–63.8% for these four variables) of medical records contained no information regarding alcohol use, injection and non-injection drug use, and homelessness (not shown). For
Table 3: Weighted absolute mean difference between dates on the case report and the medical record
Dates Weighted Absolute Mean
Difference (days)
Coefficient of Variation (C.V.) %
Month/day/year dates
Birth date 48.4 39.9
Treatment start 2.6 17.0
Isolate collection for drug susceptibility testing 13.0 26.1
First positive culture 6.1 31.0
First consistently negative culture 25.0 15.1
Treatment stop 19.2 11.3
Isolate collection for final susceptibility testing 110.9* 44.5
Dates Weighted Absolute Mean Difference
(months)
Coefficient of Variation (C.V.) %
Month/year dates
Case reported to local health department 0.74 10.0
Entry into U.S. 11.5 20.2
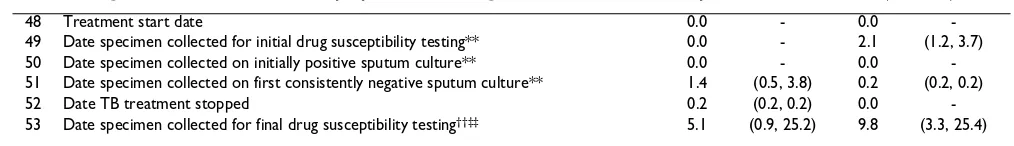
Table 4: Weighted mean estimates for the proportion of missing/unknown values on case report and medical record
#* Report of Verified Case of Tuberculosis (RVCT) Variable RVCT Missing/
Unknown % (95% CI)†
Public Health Medical Record Missing/Unknown %
(95% CI)
DEMOGRAPHIC
1 Sex 0.0 -‡ 0.0
-2 Race 0.0 - 1.3 (0.7, 2.6)
3 Ethnicity 0.0 - 1.4 (0.7, 2.6)
Country of origin
4 U.S.-born 0.6 (0.2, 1.5) 2.7 (1.7, 4.2)
5 Other country of origin 0.0 - 0.1 (0.1, 0.1)
6 Occupation 8.2 (6.3, 10.6) 23.6 (20.4, 27.1)
7 Resident of long-term care facility at diagnosis 0.2 (0.1, 0.4) 7.6 (5.8, 9.9)
8 Resident of correctional facility at diagnosis 0.1 (0.0, 0.3) 6.7 (5.1, 8.9)
SOCIAL/BEHAVIORAL RISK FACTORS
9 Homeless within past 1–2 years§ 1.9 (1.1, 3.2) 63.8 (59.9, 67.5)
10 Injecting drug user within past year 8.0 (6.2, 10.2) 22.1 (19.1, 25.4)
11 Non-injecting drug user within past year 7.8 (6.0, 10.0) 23.4 (20.3, 26.8)
12 Excess alcohol use within past year 7.6 (5.9, 9.8) 24.1 (21.0, 27.6)
DIAGNOSTIC AND CLINICAL
13 Previous TB 0.0 - 19.7 (16.8, 22.9)
14 Site of disease 0.0 - 0.0
-15 Sputum smear|| 4.9 (3.4, 7.2) 6.0 (4.2, 8.7)
16 Sputum culture|| 15.1 (12.1, 18.7) 14.4 (11.5, 17.8)
17 Smear of tissue/body fluids (non-sputum)|| 0.6 (0.3, 1.5) 78.9 (75.6, 82.0)
18 Tissue/body fluid type (non-sputum)* * 0.0 - 0.0
-19 Culture of tissue/other body fluid (non-sputum)|| 0.3 (0.1, 1.1) 63.6 (59.8, 67.2)
20 Tissue/body fluid type (non-sputum) * * 0.0 - 0.0
-Chest x-ray results
21 Abnormal/normal|| 0.6 (0.3, 1.5) 8.7 (6.8, 11.2)
22 If abnormal: cavitary/non-cavitary** 0.1 (0.0, 0.4) 0.0
-23 If abnormal: stable/worsening/improving** 68.9 (64.8, 72.7) 45.3 (40.9, 49.7)
24 Initial susceptibility testing done 0.0 - 1.7 (0.9, 3.1)
Results of initial susceptibility testing, if done††
25 Isoniazid|| 0.0 - 3.1 (2.0, 4.9)
26 Rifampin|| 0.7 (0.3, 1.8) 21.2 (18.1, 24.5)
27 Pyrazinamide|| 0.0 - 3.1 (2.0, 4.9)
28 Ethambutol|| 0.0 - 4.1 (2.8, 6.0)
29 Streptomycin|| 0.0 - 2.9 (1.8, 4.6)
TREATMENT AND CASE MANAGEMENT Initial treatment regimen
30 Isoniazid 0.0 - 0.0
-31 Rifampin 0.0 - 0.0
-32 Pyrazinamide 0.1 (0.0, 0.3) 0.0
-33 Ethambutol 0.0 - 0.0
-34 Streptomycin 0.1 (0.0, 0.3) 0.0
-35 Sputum culture conversion, if ever sputum culture positive** 1.6 (0.7, 3.5) 0.0
-36 Reason therapy stopped 0.7 (0.3, 1.5) 0.0
-37 Provider type 0.2 (0.0, 1.3) 0.0
-38 Therapy administration 3.5 (2.4, 5.2) 0.0
-39 Final susceptibility testing done‡‡ 0.0
-Results of final susceptibility testing, if done‡‡
40 Isoniazid||‡‡ 0.0 - 5.7 (1.5, 19.6)
41 Rifampin||‡‡ 0.0 - 5.7 (1.5, 19.6)
42 Pyrazinamide||‡‡ 5.1 (0.9, 25.2) 11.9 (4.9, 26.2)
43 Ethambutol||†† 0.0 - 6.4 (1.9, 19.3)
44 Streptomycin||‡‡ 0.0 - 9.8 (3.3, 25.4)
DATES
45 TB case report date 0.0 - 5.7 (4.1, 7.8)
46 Date of birth 0.0 - 0.1 (0.0, 0.3)
medical records that lacked information on these varia-bles, a large proportion of RVCTs did not report 'unknown.' The vast majority of these RVCTs reported that these four factors were explicitly absent (ranging from 76.9–94.7%), rather than present (ranging from 1.3– 3.4%) (not shown). Local TB control staff may have pro-cured information regarding these factors outside the medical record and used a paper RVCT only to document this information prior to reporting it. In this circumstance, since data from paper RVCTs in the medical record were not abstracted by the study team, more complete informa-tion for these variables may be contained on the RVCT than the abstracted medical record. However, it is unlikely that such a high proportion of these variables, in compar-ison to other variables, were differentially reported only on a paper RVCT, without other documentation in the medical record. It is also possible that the absence of doc-umentation regarding these factors in the medical record was taken as evidence of their absence by local reporting staff and others. During data abstraction, approximately one-sixth of the medical records that had missing infor-mation for drug and alcohol abuse and homelessness were documented as 'no,' rather than 'not charted.' Thus, an even greater proportion of medical records did not contain information on these important factors associated with treatment non-adherence.
Accurate and complete elicitation and reporting of sub-stance abuse and homelessness should be a high priority to ensure that patients with these factors are identified and prioritized for DOT and other adherence-promoting strategies. These core risk factors should be part of stand-ard intake forms for suspected TB patients. In addition to DOT, homeless patients and those with substance abuse often require more complex case management [5,17]. For this reason, CDC's revised funding formula, implemented in January 2005 (K. Castro, Director, CDC Division of
Tuberculosis Elimination, letter to colleagues; October 15, 2004), increased funding for cases with these and other characteristics. Programs receive less federal funding than warranted if information about homelessness and sub-stance abuse within the year prior to diagnosis is not accu-rately elicited from patients and reported.
Another factor that may be associated with non-adher-ence to treatment is a prior episode of TB disease, which also increases the risk of drug-resistant TB disease [5,17-19]. Thus, it is a high priority to identify patients with pre-vious TB to ensure that they receive DOT and an appropri-ate initial drug regimen. Information about a prior episode of TB is also important to distinguish between pri-mary and acquired drug-resistant TB, which should lead to very different TB control strategies. Although 94.6% of RVCT data for previous TB was concordant with the med-ical record, sensitivity for reported previous TB was 57.6%, indicating that previous TB was documented in the medical record over 40% more often than it was reported on the RVCT. Furthermore, it is of note that almost one-fifth of medical records lacked any informa-tion regarding previous TB. However, unlike other cate-gorical variables on the RVCT, the paper RVCT restricted values for previous TB to 'yes' and 'no,' while the elec-tronic form permitted the entry of 'unknown.' If local health departments use the paper RVCT or similar forms, based on the RVCT, to capture information from the med-ical record for computer data entry, none of the cases with missing information for previous TB in the medical record could be correctly reported as 'unknown.' In the reporting of previous TB that was not documented in the medical record, an estimated 2.2% (11) of the statewide cohort was reported with previous TB versus 97.8% (509) reported without previous TB (not shown). This may result in an underestimate of cases with previous TB. From the standpoint of data quality, the electronic information
48 Treatment start date 0.0 - 0.0
-49 Date specimen collected for initial drug susceptibility testing** 0.0 - 2.1 (1.2, 3.7)
50 Date specimen collected on initially positive sputum culture** 0.0 - 0.0
-51 Date specimen collected on first consistently negative sputum culture** 1.4 (0.5, 3.8) 0.2 (0.2, 0.2)
52 Date TB treatment stopped 0.2 (0.2, 0.2) 0.0
-53 Date specimen collected for final drug susceptibility testing††‡‡ 5.1 (0.9, 25.2) 9.8 (3.3, 25.4)
Note: All results are presented as survey-weighted mean estimates for the statewide cohort from which the sample was drawn. * Variable number (see Table 1)
† Confidence Interval
‡ With an estimate of 0.0% missing/unknown, a confidence interval was not determined
§ RVCT defines homeless within 1 year of diagnosis; medical record review defined homeless within 2 years of diagnosis || 'Not done' on RVCT excluded
** For nine RVCT variables, values are expected depending on the value of another variable (e.g., a value for type of chest x-ray abnormality or status of chest x-ray is expected only if chest x-ray results are abnormal). For these nine variables, we restricted our estimate of missing/unknown values to instances in which a subsequent value was expected, but missing, and did not count expected absent values as 'missing'.
†† As a result of a very small number of second-line drug susceptibility test results, these results are not presented, either for initial or final drug susceptibility testing.
system should capture the same values as the paper form for each RVCT variable, and variables should be structured to permit reporting of 'unknown' values.
The time to documented sputum culture conversion (con-version of an initially positive M. tuberculosis sputum cul-ture to a consistently negative result) is an important indicator of a patient's response to therapy. As such, timely sputum culture conversion is an important evalua-tion measure for TB control programs. If delayed sputum culture conversion (conversion >60 days) is noted, the following interventions are recommended: assessment of factors potentially associated with suboptimal response to treatment, extended duration of TB therapy, and initiation of DOT (if not already provided) [20]. Reported data for documentation of sputum culture conversion were 85.4% concordant with data in the medical record, and the PVP for a reported positive was 87.8%, indicating that greater than 10% of cases reported with sputum culture conver-sion lacked documentation in the medical record. For cases with documented sputum culture conversion, the absolute mean difference between the RVCT and medical record in the date for the first consistently negative spu-tum culture was 25.0 days. The magnitude of this differ-ence is almost half of the timeframe (60 days) recommended to trigger interventions for delayed sputum culture conversion noted above. Complete and accurate data validity for these variables is essential for TB control programs to evaluate their performance in achieving timely sputum culture conversion. This performance measure highlights medical oversight, case management, and laboratory functions. Inadequate data impairs the ability of programs to identify and address problems in these important areas, to prevent on-going transmission from patients who remain sputum culture positive, and to ensure cure of TB patients.
RVCT data for cases with an initial abnormal chest x-ray were only 46.8% concordant with the medical record in assessing chest x-ray status (stable, improving, or worsen-ing) of a follow-up chest film. The poor concordance has multiple possible explanations: unclear RVCT instructions regarding the timeframe from the initial to the follow-up chest x-ray; follow-up chest x-ray results received after the RVCT was submitted; multiple chest x-ray results with potentially differing values; and inadequate correspond-ence between RVCT values and terms used in chest x-ray reports. The variable, 'chest x-ray status,' is used primarily to execute an algorithm to verify that patients without positive M. tuberculosis cultures have TB disease [21]; since only culture positive cases were included in the study sam-ple, validity of this variable is not relevant for cases in the study population. But poor concordance between RVCT data and the medical record suggests that using a reported change in chest x-ray status as a criterion to verify
culture-negative TB cases may be problematic. A high proportion of data for this variable was also missing/unknown from both the medical record and the RVCT (45.3% and 68.9%, respectively). The CDC workgroup proposed to eliminate this variable entirely from the RVCT; poor data validity and a high proportion of missing data in our study support this proposal.
As noted, data for the smear result of tissue or body fluid other than sputum were 49.2% concordant. On both the RVCT and the medical record, at least one tissue or body fluid type was associated with each positive smear result, with 76.4% concordance on tissue/body fluid types(s). Among discordant results for positive smear, 54.4% were associated with a specific tissue/body fluid type that was documented in the medical record, but not reported on the RVCT (not shown). Conversely, the RVCT reported 45.6% of positive smear results associated with a specific tissue or fluid that was not documented in the medical record (not shown). Local TB control staff may have received telephone reports of these results and docu-mented them only on a paper RVCT in the medical record before reporting it. In this circumstance, since the study team did not abstract data from paper RVCTs in the med-ical record, more complete information on these variables for some cases may be contained on the RVCT than the abstracted medical record. Results that were documented in the medical record, but were not reported may be explained by the retrospective nature of the field study which benefited from results and documentation that may not have been available at the time the RVCT was submitted. Data on microscopic smear results for tissue or body fluid other than sputum are used for TB case confir-mation among a very small proportion (approximately 0.5%) of TB cases who lack sputum and/or other cultures to confirm TB [21]. Since all cases in the sample were M. tuberculosis culture positive, discordance of data between the RVCT and the medical record for these variables has little consequence for the study population. Among patients whose TB case confirmation relies on micro-scopic smear results, the absence of these data could delay case confirmation and reporting. The proposed RVCT revi-sion provides much more detailed and specific instruc-tions for reporting and updating information for these variables that will likely improve data quality.
illness lasting 6–18 months. Proposed revisions of the CDC workgroup would expand categories for provider type, clarify definitions and instructions, and allow reporting of as many provider types that apply.
RVCT data for case occupation in the year prior to TB diag-nosis were 84.4% concordant with data in the medical record. The sensitivity for migratory agricultural worker was 51.8%, indicating that nearly twice as many of these workers were documented in the medical record but not reported on the RVCT. The sensitivity for 'other employ-ment' (employment other than migratory agricultural worker, health care worker, and correctional employee) was 76.4%. The vast majority of patients who were identi-fied with other employment in the medical record were reported as 'unemployed' on the RVCT (not shown). The CDC workgroup proposed to expand and redefine occu-pational categories and clarify instructions for reporting case occupation.
Turning from the categorical variables to the nine date var-iables we compared, we found that for dates in month/ day/year format, the weighted mean absolute difference in days between the medical record and the report was generally within 25 days, except for birth date which had a difference of 48 days. However, any difference may be problematic when a variable, such as birth date, is used to match cases in surveillance datasets. For foreign-born cases, the weighted mean difference between the date of entry to the U.S. (in month/year format) on the RVCT and in the medical record was 11.2 months. Such discordance may be related to recall bias of the TB patient and may be difficult to rectify. Alternatively, it may be related to unclear reporting instructions principally affecting patients with repeated entries to the U.S. or with different countries of birth from their countries of origin.
With notable exceptions, across all variables, the propor-tion of missing data on the RVCT was lowest for demo-graphic variables, drug susceptibility test results, and the initial treatment regimen. Across all variables, the mean proportion of missing/unknown data was greater in the medical record (9.8%) versus the RVCT (2.9%), including data noted above for drug and alcohol use, homelessness, and previous TB. However, it should be noted that 15 RVCT variables pertaining to clinical tests have a 'not done' value, which was abstracted as 'not charted' in the field study. Missing data potentially compromise the quality of surveillance data and the surveillance system, especially if data are not missing completely at random. In the latter circumstance, biases may be introduced that impair our understanding of the true epidemiology of TB and compromise activities that rely on accurate data.
The study findings provide strong support of the CDC workgroup's proposed revisions to the 1993 RVCT, including restructuring certain variables (e.g., previous TB, DOT, type of health care provider); enhanced reporting instructions for other variables (e.g., proposed instruc-tions specify submission of updated information as it becomes available for drug and alcohol abuse, and smear and culture results of tissue and other body fluids); clari-fication of instructions for some date fields (e.g., date of entry to the U.S. for foreign-born cases); and deletion of one variable (e.g., chest x-ray status).
Implementation of the proposed RVCT is likely to make a substantial contribution to improving the validity and value of TB surveillance data. However, additional inter-ventions are needed to ensure valid TB surveillance data nationally. As more and more health departments imple-ment comprehensive electronic patient manageimple-ment sys-tems, it is important for the accuracy of the RVCT generated by these systems to be fully evaluated. These systems should be designed to ensure that definitions and values for RVCT variables are consistent nationally and reinforced by the functionality of the system so that the information needed to support and sustain our TB control activities is accurately captured.
Although CDC has provided instructions for completing the RVCT, detailed documentation regarding electronic reporting, and extensive electronic data validation, it has not provided guidance on effective data QC practices at the local level. An informal survey of many California health departments revealed that nearly half did not have processes in place to check the completed RVCT against the medical record, and 80% did not check for data entry errors [22]. Since it is likely that gaps in QC practices exist broadly across the nation and there are numerous gener-ally applicable QC practices for an established TB surveil-lance system, it is appropriate for the CDC to address these deficiencies and implement enhanced QC practices for the surveillance system. In order to ensure data quality in surveillance systems, development of best practices for recordkeeping and documentation in the public health medical record is also needed. As public heath programs and bioterrorism preparedness entities move toward elec-tronic surveillance and patient management systems, the importance of electronic data quality in effective patient management cannot be overemphasized.
To improve and ensure RVCT data quality as CDC imple-ments the revised RVCT, targeted interventions at the national, state, and local levels are also needed. Potential interventions include the following:
▪ Field test proposed RVCT revisions and reporting instructions prior to their implementation
▪ Develop recommendations and tools for QC prac-tices at the local level that facilitate implementation of effective practices
▪ Develop best practices and tools for recordkeeping and documentation to support accurate and complete capture of data for RVCT variables
▪ Develop and maintain a TB surveillance users group to provide on-going training and capacity-building of TB registry staff nationally
▪ State level
▪ Provide regular training to local TB control staff who complete and enter the RVCT to ensure that staff under-stand definitions and instructions and appreciate the importance of data quality
▪ Modernize and centralize user-assistance resources (i.e., Help functions) either directly within new informa-tion systems or via the World Wide Web to ensure access and uniform distribution of revisions
▪ Provide technical assistance to support implementa-tion of QC practices by local staff
▪ Local level
▪ Expand use of data QC procedures
▪ Implement effective recordkeeping and documenta-tion in the public health medical record to support com-plete and accurate capture of data for RVCT variables
▪ Routinely update case reports as more current case information becomes available
▪ Ensure that replacement or upgraded information systems can capture TB surveillance data according to national requirements
There are several limitations to this study. First, the study population is drawn from cases counted during 6/1/96-5/ 31/97. However, significant statewide interventions to improve data quality have not been undertaken since 1997, nor have the noted structural problems with RVCT variables or unclear reporting instructions been resolved. For these reasons, it is likely that findings of the study sub-stantially reflect data quality at the present time. Second, the findings may not be representative of RVCT data valid-ity in other states or in other health jurisdictions in
Cali-fornia. Third, the field study was not primarily designed to validate the RVCT; some definitions in the field study do not exactly match RVCT definitions (e.g., history of home-lessness), and a small number of RVCT variables were not abstracted from the medical record so that they could not be validated. Fourth, the medical record may be an imper-fect "gold standard", and there may be situations in which more accurate and complete information is reported than is contained in the medical record. Fifth, abstractors coded approximately one-sixth of medical records that lacked documentation for homelessness and substance abuse as explicitly lacking these factors. This may have resulted in an underestimate of the relatively high propor-tion of RVCTs that recorded the absence of these factors, with no documentation in the medical record. Sixth, the estimates for sputum smear and sputum culture were less robust than for other variables because of the way that data was abstracted in the field study. In assessing the validity of these two variables, we limited the comparison to patients with pulmonary TB only without non-sputum specimen results.
In closing the discussion on limitations, several interpre-tive comments regarding the validation measures are in order. In general, concordance is most appropriate in assessing the level of agreement between two equivalent data sources, rather than a primary and secondary data source. Moreover, because concordance does not account for agreement that occurs by chance alone, our estimates of concordance should be considered 'high' estimates for measures of data validity. Similarly, estimates for sensitiv-ity of the reported positive value should also be seen as 'high' estimates, since we restricted our calculations to 'yes' and 'no' values on the RVCT and medical record. In fact, if the medical record contained documentation of a positive value that was reported on the RVCT as 'unknown' or 'not done,' our estimates would have excluded these discordant values, thereby resulting in a higher estimate of sensitivity.
Conclusion
Our study found that data validity and completeness for most reported variables were excellent, indicating a robust surveillance system. However, lower data validity was noted for nine categorical (20.5%) variables, with the most important impacts on evaluation of DOT, a core component in TB control programs to ensure treatment adherence and cure. In addition, it is likely that some of the factors (e.g., homelessness, substance abuse, and pre-vious TB) on which TB control programs prioritize patients for DOT may not be captured accurately and completely by the RVCT, further compromising DOT activities and our evaluation of them.
The study findings provide compelling evidence in sup-port of the CDC workgroup's proposed revisions of the TB case report. The proposed enhanced instructions and def-initions, revisions to variable structures, and the addition of new variables are likely to contribute substantially both to improved data quality and more useful data. Since the RVCT remains under revision and will undergo stake-holder review before it is finalized, additional revisions are anticipated. Regardless, greater attention to QC and recordkeeping at the national, state, and local levels will help to ensure that implementation of the revised RVCT achieves maximum impact.
Competing interests
The author(s) declare that they have no competing inter-ests.
Authors' contributions
JES conceived the study, participated in study design and data analysis, and drafted the manuscript.
ESL conducted original field study, including data collec-tion and data management, participated in study design and drafting of manuscript.
TCP participated in data analysis and review of manu-script drafts.
JMF participated in study design and review of manuscript drafts.
JLW coordinated the California TB Registry, participated in study design and review of manuscript drafts.
All authors read and approved the final manuscript.
Acknowledgements
The authors wish to thank the following for their assistance in various phases of the study: Karen Ben-Moshe (word processing); Peter Oh and Rachel Steinhart (data abstraction); Bill Elms (analytic assistance); Alan Hub-bard (statistical consultation); Robert German, Marisa Moore, Sarah Royce, Eileen Schneider (manuscript review); and staff in the California local health jurisdictions who participated in the study.
References
1. Stop TB Partnership and World Health Organization. In Glo-bal Plan to Stop TB 2006–2015. (WHO/HTM/STB/2006.35) Geneva World Health Organization; 2006. http://www.stoptb.org/globalplan/ assets/documents/GlobalPlanFinal.pdf
2. Stop TB Partnership and World Health Organization. In The Stop TB Strategy: building on and enhancing DOTS to meet the TB-related millennium development goals. (WHO/HTM/STB/2006.37) Geneva World Health Organization; 2006. http://www.stoptb.org/
3. Ravigione MC, Uplekar M: WHO's new Stop TB Strategy. The
Lancet 2006, 367:952-955.
4. Centers for Disease Control and Prevention: Essential
compo-nents of a tuberculosis prevention and control program: rec-ommendations of the Advisory Council for the Elimination of Tuberculosis. MMWR 1995, 44(No. RR-11):. http:// www.cdc.gov/mmwr/preview/mmwrhtml/00038823.htm
5. Centers for Disease Control and Prevention: Controlling
tubercu-losis in the United States: recommendations from the American Thoracic Society, CDC, and the Infectious Dis-eases Society of America. MMWR Recomm Rep 2005, 54(RR-12):1-81.
6. U.S. Department of Health and Human Services Centers of Disease
Control and Prevention: Form CDC 72.9A. .
7. Bloch AB, Onorato IM, Ihle WW, Hadler JL, Hayden CH, Snider DE
Jr: The need for epidemic intelligence. Public Health Rep 1996,
111:26-31.
8. Cofer A, Privett T, Gibson L, Koppaka V: SURVS-TB data may
underestimate program performance. Proceedings of The Inter-national Union Against Tuberculosis and Lung Disease, North American Region 2000, 4(2sl):S88-S105.
9. Cairns KL, Daugherty-Gibson J, Danner S, Simone P: Leading
causes of delayed completion of TB therapy in three U.S. states, 1995–1996. Proceedings of American Thoracic Society Confer-ence 2000.
10. California Department of Health Services Tuberculosis Control
Branch: Report of Verified Case of Tuberculosis Form Completion Instruc-tions: California State Protocols Berkeley; 1996.
11. Centers for Disease Control and Prevention: Updated guidelines
for evaluating public health surveillance systems: recom-mendations from the Guidelines Working Group. MMWR
2001, 50(No. RR-13):. http://www.cdc.gov/mmwr/preview/
mmwrhtml/rr5013a1.htm
12. Thompson SK: Sampling New York: Wiley; 2002.
13. Lumley T: Analysis of complex survey samples.
[http://cran.r-project.org/doc/packages/survey.pdf].
14. Rice JA: . In Mathematical Statistics and Data Analysis California: Dux-bury Press; 1995.
15. The R Project for Statistical Computing [http://www.r-project.org]
16. Rieder HL, Watson JM, Raviglione MC, Forssbohm M, Migliori GB,
Schwoebel V, Leitch AG, Zellweger JP: Surveillance of
tuberculo-sis in Europe. Eur Respir J 1996, 9(5):1097-1104.
17. Burman WJ, Cohn DL, Rietmeijer CA, Judson FN, Sbarbaro JA, Reves
RR: Non-compliance with directly observed therapy for tuberculosis. Chest 1997, 111(5):1168-1173.
18. Frieden TR, Sterling T, Pablos-Mendez A, Kilburn JO, Cauthen GM,
Dooley SW: The emergence of drug-resistant tuberculosis in
New York City. N Engl J Med 1993, 328(8):521-526.
19. Weis SE, Slocum PC, Blais FX, King B, Nunn M, Matney GB, Gomez
E, Foresman BH: The effect of directly observed therapy on the
rates of drug resistance and relapse in tuberculosis. N Engl J
Med 1994, 330(17):1179-1184.
20. American Thoracic Society, Centers for Disease Control and
Preven-tion, Infectious Diseases Society of America: Treatment of
tuber-culosis. Am J Respir Crit Care Med 2003, 167:603-662.
21. Centers for Disease Control and Prevention: Tuberculosis information
management system (TIMS) user's guide; surveillance appendix IV Atlanta; 2003.
22. Westenhouse JL, Chin DP: Survey of local tuberculosis case
reg-istry practices and capacities in California. TB Notes 1999, 3:4-7.
Pre-publication history
Publish with BioMed Central and every scientist can read your work free of charge
"BioMed Central will be the most significant development for disseminating the results of biomedical researc h in our lifetime."
Sir Paul Nurse, Cancer Research UK
Your research papers will be:
available free of charge to the entire biomedical community peer reviewed and published immediately upon acceptance cited in PubMed and archived on PubMed Central yours — you keep the copyright
Submit your manuscript here:
http://www.biomedcentral.com/info/publishing_adv.asp
BioMedcentral http://www.biomedcentral.com/1471-2458/6/217/pre