Counteracting Osmolyte Trimethylamine
N
-Oxide Destabilizes
Proteins at pH below Its p
K
aMEASUREMENTS OF THERMODYNAMIC PARAMETERS OF PROTEINS IN THE PRESENCE AND ABSENCE OF TRIMETHYLAMINEN-OXIDE*
Received for publication, September 17, 2004, and in revised form, January 7, 2005 Published, JBC Papers in Press, January 14, 2005, DOI 10.1074/jbc.M410716200
Rajendrakumar Singh, Inamul Haque, and Faizan Ahmad‡
From the Department of Biosciences, Jamia Millia Islamia, Jamia Nagar, New Delhi 110 025, India
Earlier studies have reported that trimethylamineN
-oxide (TMAO), a naturally occurring osmolyte, is a uni-versal stabilizer of proteins because it folds unstruc-tured proteins and counteracts the deleterious effects of urea and salts on the structure and function of proteins. This conclusion has been reached from the studies of the effect of TMAO on proteins in the pH range 6.0 – 8.0. In this pH range TMAO is almost neutral (zwitterionic
form), for it has a pKaof 4.66ⴞ0.10. We have asked the
question of whether the effect of TMAO on protein sta-bility is pH-dependent. To answer this question we have carried out thermal denaturation studies of lysozyme,
ribonuclease-A, and apo-␣-lactalbumin in the presence
of various TMAO concentrations at different pH values
above and below the pKaof TMAO. The main conclusion
of this study is that near room temperature TMAO
de-stabilizes proteins at pH values below its pKa, whereas it
stabilizes proteins at pH values above its pKa. This
con-clusion was reached by determining theTm(midpoint of
denaturation),⌬H
m(denaturational enthalpy change at
Tm),⌬Cp(constant pressure heat capacity change), and
⌬G
D° (denaturational Gibbs energy change at 25 °C) of
proteins in the presence of different TMAO
concentra-tions. Other conclusions of this study are that Tmand
⌬G
D° depend on TMAO concentration at each pH value
and that⌬H
mand⌬Cpare not significantly changed in
the presence of TMAO.
Many organisms are known to accumulate low molecular weight organic molecules (osmolytes) in their tissues in re-sponse to harsh environmental stresses. These osmolytes are generally categorized into three groups, namely amino acids and their derivatives, polyhydric alcohols, and methylamines (1). Molecules of the first two groups are “compatible os-molytes,” which means that cells accumulate these osmolytes to high concentrations without significantly perturbing protein functions under physiological conditions (1– 4). Molecules of the third group, which reverse the perturbations caused by urea, are known as “counteracting osmolytes” (2, 5). One such coun-teracting osmolyte is trimethylamineN-oxide (TMAO),1which
is present in high concentrations in coelacanth (sharks) and marine elasmobranchs (rays) (6). The effect of TMAO on pro-tein stability and enzyme activity has been widely studied. This osmolyte has been shown in vitro to do the following: (i) in-crease the melting temperature as well as the unfolding free energy of proteins (7–11); (ii) offset the destabilizing effects of urea (8, 10, 11); (iii) restore the enzyme activity that is lost upon urea treatment (12, 13); (iv) force the folding of unstruc-tured proteins (4, 12–15); (v) favor the protein self-association and polymerization of microtubules (16 –18); (vi) correct tem-perature-sensitive folding defects (19); and (vii) interfere with the formation of scrape prion protein (20). TMAO has been shownin vivoto counteract the damaging effects of salts (21), hydrostatic pressure (22, 23), and urea (24, 25) on proteins.
TMAO is a compound that has a pKain the pH range 4.56 –
4.75 (11, 26). Thus, this compound can exist in zwitterionic and positively charged forms, depending on the pH of the medium. Although TMAO-facilitated stabilization of proteins has been studied at length (8, 11–13, 27), these studies were carried out in the pH range 6.0 – 8.0 in which TMAO is almost neutral. To date, no studies have been carried out at pH values below the pKaof
TMAO, where the osmolyte exists predominantly in the posi-tively charged form. Thus, it is not known what the effect of the positively charged TMAO on protein stability is. To answer this question we have investigated the effects of both positively charged and neutral forms of TMAO on the thermal denaturation of three model proteins, namely, pancreatic RNase A, hen egg white lysozyme, and bovine apo-␣-lactalbumin (␣-LA) in the pH range 2.0 –7.0. In this article we report for the first time that the positively charged form of TMAO destabilizes all proteins.
EXPERIMENTAL PROCEDURES
Commercial lyophilized preparations of RNase A (type III-A), hen egg white lysozyme, and bovine␣-lactalbumin were purchased from Sigma. Guanidinium chloride (GdmCl) was the ultrapure sample from Schwarz/Mann. TMAO was obtained from Sigma. These and other chemicals, which were of analytical grade, were used without further purification.
RNase A, lysozyme, and holo-␣-lactalbumin solutions were dialyzed extensively against 0.1MKCl, pH 7.0.␣-LA was prepared by adding 4 mMEGTA to the solution of holoprotein (with Ca2⫹bound). Protein
stock solutions were filtered using 0.45-m Millipore filter paper. All three proteins gave a single band during polyacrylamide gel electro-phoresis. Concentration of the protein was determined experimentally using molar absorption coefficient (M⫺1cm⫺1) values of 9800 at 277.5
nm for RNase A (28), 39,000 at 280 nm for lysozyme (29), and 29,210 at 280 nm for␣-LA (30). The concentration of GdmCl stock solution was determined by refractive index measurements (31). All solutions for optical measurements were prepared in the desired degassed buffer containing 0.1MKCl. For various pH ranges, the buffers used were
* This work was supported by the Council of Scientific and Industrial Research, India and the Department of Science and Technology, India. The costs of publication of this article were defrayed in part by the payment of page charges. This article must therefore be hereby marked “advertisement” in accordance with 18 U.S.C. Section 1734 solely to indicate this fact.
‡ To whom correspondence should be addressed. Tel.: 91-11-2698-1733; Fax: 91-11-2698-0164; E-mail: [email protected].
1The abbreviations used are: TMAO, trimethylamineN-oxide;␣-LA,
apo-␣-lactalbumin; GdmCl, guanidinium chloride; CD, circular dichro-ism; ⌬Cp, constant-pressure heat capacity change; Tm, midpoint of
denaturation;⌬Hm, enthalpy change of denaturation;⌬GD, Gibbs en-ergy change;⌬GD°, Gibbs energy change at 25
oC.
© 2005 by The American Society for Biochemistry and Molecular Biology, Inc. Printed in U.S.A.
This paper is available on line at http://www.jbc.org
11035
by guest, on March 14, 2012
www.jbc.org
0.05Mglycine hydrochloride buffer (pH range 2.0 –3.5), 0.05Mcitrate
buffer (pH 4.0 – 4.5) and 0.05Mcacodylic acid buffer (pH range 5.0 –7.0). The pH of the protein solutions changes upon the addition of TMAO; hence, the required pH was adjusted by adding either HCl or NaOH. Because the change in pH may also occur upon heating or upon the addition of GdmCl, the pH of the solution was therefore measured after the denaturation experiment. It has been observed that the change in
pH is
not significant.
Thermal denaturation studies were carried out in a Jasco V-560 UV/visible spectrophotometer equipped with a Peltier-type tempera-ture controller (ETC-505T) at a heating rate of 1 °C/min. This scan rate was found to provide adequate time for equilibration. Each sample was heated from 20 to 85 °C. The change in absorbance with increasing temperature was followed at 287 nm for RNase A, 300 nm for lysozyme, and 295 nm for␣-LA. About 650 data points of each transition curve were collected. After denaturation, the sample was immediately cooled down to measure reversibility of the reaction. All solution blanks showed negligible change in absorbance with temperature and were, therefore, neglected during the data analysis. The raw absorbance data were converted into a molar absorption co-efficient (M⫺1cm⫺1) at a
given wavelength. Each heat-induced transition curve was analyzed forTm(midpoint of denaturation) and⌬Hm(denaturational enthalpy change atTm) using a non-linear least squares method according to the relation shown in Equation 1,
y共T兲⫽yN共T兲⫹yD共T兲exp关⫺⌬Hm/R共1/T⫺1/Tm兲兴 1⫹exp关⫺⌬Hm/R共1/T⫺1/Tm兲兴
(Eq. 1)
wherey(T) is the optical property at temperatureT(kelvin),yN(T) and yN(D) are the optical properties of the native and denatured protein molecules atT(kelvin), respectively, andRis the gas constant. In the analysis of the transition curve, it was assumed that a parabolic func-tion describes the dependence of the optical properties of the native and denatured protein molecules (i.e. yN(T)⫽aN⫹bNT⫹cNT independent coefficients) (32). A plot of⌬Hmversus Tmat each concen-tration of TMAO gave the value of ⌬Cp, the constant pressure heat capacity change. As shown in Equation 2,
⌬GD共T兲⫽⌬Hm
冉
⌬GD(T), was estimated with the help of the Gibbs-Helmholtz equation. Heat-induced denaturations of lysozyme, RNase A, and␣-LA were measured by near-UV difference spectral measurements. For each pro-tein, measurements were performed in triplicate at each pH and each [TMAO], the molar concentration of TMAO. This osmolyte has pKa values in the range 4.56 – 4.75 (11, 26). Thus, the pH range chosen was to have TMAO in positively charged and neutral states. The selected [TMAO] range was such as to have minimal to maximal effects on the thermal stability of proteins, keeping in view its solubility in solution as well as its tendency to precipitate proteins at higher temperatures. To see whether the stabilizing/destabilizing effect of TMAO depends on the physicochemical properties of proteins, we had chosen three proteins of different pI and hydrophobicity values, namely lysozyme, RNase A, and ␣-LA; pI and hydrophobicity (kcal mol⫺1) values, respectively, are 10.7
and 890 for lysozyme, 9.5 and 780 for RNase A, and 5 and 1050 for␣-LA. Isothermal (25 °C) far- and near-UV spectra of lysozyme, RNase A, and␣-LA were measured at least three times in a Jasco J-715 spec-tropolarimeter equipped with a Peltier-type temperature controller (PTC-348-WI). All solution blanks showed negligible change in elliptic-ity in the entire wavelength range and were, therefore, neglected during the data analysis. The raw CD data were converted into mean residue ellipticity (deg cm2dmol⫺1) at the entire wavelength using the relation
shown in Equation 3,
关兴⫽Mo/10lc (Eq. 3)
whereis the observed ellipticity (millidegrees) at the wavelength, Mois the mean residue weight of the protein,cis the protein concen-tration (mg/cm3), andlis the pathlength (centimeters).
RESULTS
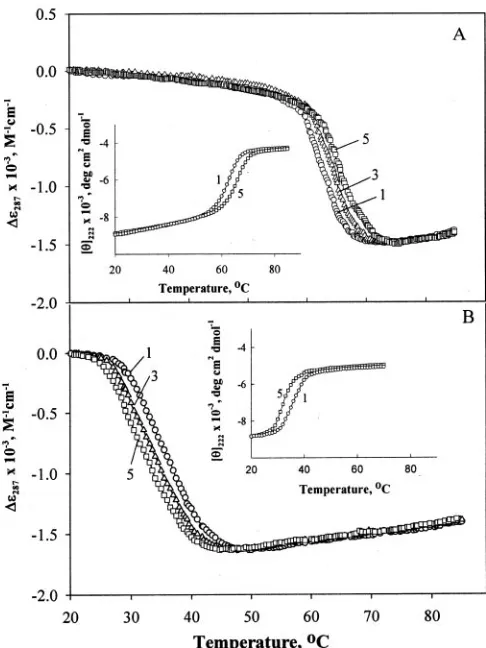
Heat-induced denaturation curves of proteins in the pres-ence of different TMAO concentrations (0, 0.25, 0.50, 0.75, and 1M) at five different pH values were measured by following the
changes in ⌬⑀300of lysozyme,⌬⑀287 of RNase A, and⌬⑀295 of
␣-LA as a function of temperature. Denaturation of each pro-tein was reversible at the all pH values in the entire range of [TMAO]. It was observed that for each protein an increase in [TMAO] raised theTmif pH wasⱖ5 and reducedTmif pH was ⬍5.Panels AandBof Figs. 1-3 show representative denatur-ation curves of lysozyme, RNase A, and ␣-LA, respectively. Each denaturation curve of a protein at a given [TMAO] and pH was analyzed for Tm and ⌬Hm using a nonlinear least
squares method that involves fitting the entire (⌬⑀,T) data of the transition curve to Equation 1 with all eight free parame-ters (aN,bN,cN,aD,bD,cN,Tm, and⌬Hm). The only exception was that in the analysis of the transition curves of␣-LA in the presence and absence of TMAO at pH 4.0, the least squares method involved fitting the entire (⌬⑀295,T) data according to
Equation 1 with fixed values ofaN,bN, andcN, for it has been observed that the temperature-dependence ofyNis
independ-ent of pH and [TMAO]. Table I shows values ofTmand⌬Hmof
all three proteins in the presence and absence of TMAO at different pH values. It should be noted that in the case of lysozyme we could not obtain complete denaturation curves in the measurable temperature range at the pH values 6.0 and 5.0 (see⌬⑀300versustemperature plot in theinsetof Fig. 1A). To
FIG. 1. Representative thermal denaturation profiles of
ly-sozyme in the presence of different concentrations of TMAO at pH 6.0 and pH 2.0.Curves 1,2,3,4, and5represent the denaturation profiles of lysozyme in 0, 0.25, 0.5, 0.75 and 1MTMAO, respectively, at pH 6.0 (A) and pH 2.0 (B). For the sake of clarity, curves 2 and 4 are not shown inpanel A.Insets in theleft cornersofpanels AandBshow thermal denaturation monitored by change in the mean residue ellip-ticity at 222 nm; thecurve numbershave the same meaning as those in thepanels AandBand, for the sake of clarity, the denaturation curve at 0.5MTMAO is not shown. Theinsetin theright cornerofpanel A represents the incomplete transition curves of lysozyme in the absence of GdmCl at the indicated pH values.
by guest, on March 14, 2012
www.jbc.org
bring down thermal denaturation in the measurable tempera-ture range, measurements were carried out in the presence of 2 M GdmCl at these pH values. To correct for the effect of GdmCl onTmand⌬Hm, we also measured thermal denatur-ation curves of lysozyme at three more concentrdenatur-ations, namely 1.5, 3, and 3.5MGdmCl at pH values of 6.0 and 5.0 (transition curves not shown). These transition curves were analyzed for Tmand⌬Hmaccording to Equation 1. At a given pH, the plots of⌬Hmversus[GdmCl] and Tm versus[GdmCl], which were
found to be linear, were used to get values ofTmand⌬Hmin the
absence of GdmCl (see Fig. 4). The Tm and ⌬Hm values of
lysozyme evaluated in this manner at pH values 6.0 and 5.0 are given in Table I.
To estimate the⌬Cpof a protein,⌬Hmvalues are determined
at a number ofTmvalues by varying the solvent condition, and
the slope of the straight line of the⌬Hmversus Tmplot is used to evaluate⌬Cp(i.e.⌬Cp⫽(␦⌬Hm/␦Tm)p) (33). However, it is
seen in Table I that at a given pH the variation in ⌬Hm of
proteins with a change in [TMAO] is not significant, for the mean error from the triplicate measurements of⌬Hmat the given pH and [TMAO] is in the range 2–5%. The only excep-tions were the results of␣-LA at pH values of 7.0 and 4.0. This is the reason for estimating⌬Cpof the protein in the presence
of a given [TMAO] using (⌬Hm,Tm) data obtained at different pH values. For a protein at a given [TMAO], all 15 (⌬Hm,Tm)
values obtained from triplicate measurements at all five pH values were used to construct the⌬Hmversus Tmplot.
Repre-sentative ⌬Hm versus Tm plots of ␣-LA in the absence and
presence of 1M TMAO are shown in Fig. 5. Such plots were analyzed for ⌬Cp, and Table I shows values of the ⌬Cp of
proteins at different TMAO concentrations. It should be noted that a “plus/minus” (⫾) with each ⌬Cpin Table I is the fit
error (S.D.).
At a constant pH and osmolyte concentration, ⌬GD°, the
value of⌬GDat 25 °C, was estimated using Equation 2 with
known values of⌬Hm,Tm, and⌬Cp. However, this estimation
requires a large extrapolation. Hence, a large error may be associated with⌬GD° determination due to errors in the
esti-mations of ⌬Hm, Tm, and ⌬Cp. We have used Becktel and
Schellman’s procedure (33) to determine the maximum and minimum errors associated with the⌬GD° determination in a given solvent condition. Because there were three independent measurements of⌬HmandTmof a protein at the given pH and
[TMAO], we obtained six values of⌬GD° (three maximum and
three minimum values). All of these six values were used to determine the average ⌬GD° and the mean error. It was
ob-served that the mean error associated with the⌬GD°
estima-tion was in the range 5–9% for all proteins. The average values of⌬GD° are given in Table I.
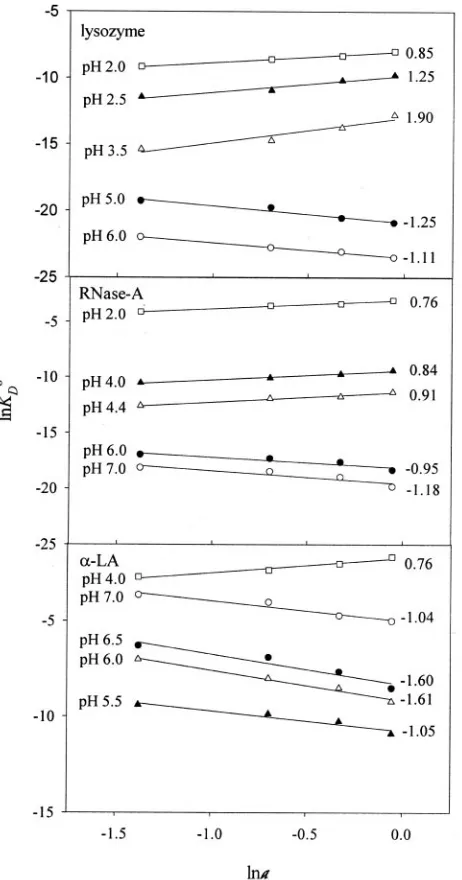
Fig. 6 shows plots of lnKD° (⫽ ⫺⌬GD°/RT)versuslna(ais the
activity coefficient of TMAO estimated using activity coefficient data reported by Lin and Timasheff) (11). Fig. 7 shows the effect of TMAO on the far- and near-UV CD spectra of lysozyme, RNase A, and␣-LA under native and denatured conditions.
DISCUSSION
Heat denaturation curves (plots of⌬⑀versustemperature) of lysozyme, RNase A, and␣-LA were measured in the presence and absence of TMAO at different pH values. Because these conformational transition curves were used for the estimation of different thermodynamic quantities, a few comments are therefore necessary. Analysis of thermal denaturation curves according to Equation 1 assumes that the transition between the native and denatured states is a two-state process. This is indeed true for these proteins in the absence of TMAO (34, 35). However, no calorimetric data are available for these proteins in the presence of TMAO. To check whether the two-state assumption is also valid in the presence of TMAO, thermal denaturation curves were measured by following changes in the []222of each protein in the presence of 0.5 and 1MTMAO at different pH values (e.g. see insets in Figs. 1–3). These transition curves were analyzed for⌬HmandTmaccording to
Equation 1, and these values of thermodynamic quantities were compared with those obtained from difference absorption measurements given in Table I. It has been observed that both measurements gave, within the experimental error range, identical values ofTmand⌬Hm. This comparison suggests that
heat-induced denaturation of proteins in the presence of TMAO is a two-state process.
To compare a thermodynamic quantity of a protein in the presence of TMAO with that in its absence, it is necessary to show that the structural characteristics of the two end states, i.e. the N and D states of heat denaturations of lysozyme, RNase A, and␣-LA, are not affected on the addition of TMAO. It is seen in Fig. 7 that the far- and near-UV CD spectra of both native and denatured proteins in the absence and presence of TMAO are, within the experimental error range, identical. Furthermore, it has been observed that the near-UV absorption spectra of the two end states of proteins were also unperturbed in the presence of TMAO (e.g.see Figs. 1–3). These observations on the native proteins are consistent with the x-ray results showing that the native structure of proteins is unperturbed by TMAO (7) and with the size exclusion chromatography results suggesting that TMAO has no effect on the dimensions of the native proteins FIG. 2.Representative thermal denaturation profiles of RNase
A in the presence of different concentrations of TMAO at pH 7.0 and pH 2.0.Denaturation curves measured by following the changes in ⌬⑀287of RNase A in the absence and presence of various concentrations
of TMAO at pH values of 7.0 (A) and 2.0 (B). Curve numbers have the same meanings as in Fig. 1. Theinsetsin panels AandBshow the thermal denaturation curves measured by []222, and thecurve numbers
have the same meanings as those in Fig. 1. For the sake of clarity, the CD melting curve at 0.5MTMAO is not shown.
by guest, on March 14, 2012
www.jbc.org
(4, 12, 13). Our observation on denatured proteins is in agreement with the report that TMAO is nonperturbational in its effects on fully solvent-exposed amide protons (26). Hence, a comparison of a thermodynamic property of denaturation in the presence and ab-sence of TMAO is valid.
Because the thermodynamic parameters of proteins reported here are obtained by an indirect method based on equilibrium denaturation, it is therefore necessary to validate them against those obtained directly by a thermodynamic method. A com-parison of the⌬Hm,Tm, and⌬Cpof proteins in the absence of
TMAO (Table I) with those obtained from differential scanning calorimetry measurements (34, 35) gave excellent agreement between the values of each thermodynamic quantity obtained by these two different methods; for example, the calorimetric values of ⌬Cp are 1.60, 1.22, and 1.55 kcal mol
⫺1 K⫺1 for
lysozyme, RNase A, and␣-LA, respectively. This agreement led us to believe that our measurements of transition curves and our analysis of these curves for thermodynamic parameters are authentic and accurate.
Equation 2 was used to estimate⌬GD°, the value of⌬GDat 25 °C. It is obvious that the accuracy of this estimate will depend on the accuracy with which Tm,⌬Hm, and ⌬Cp are
determined. It has been observed that the error in the deter-mination of Tm, which is 0.1– 0.6% for all proteins, has no significant effect. On the other hand, if errors in the determi-nations of⌬Hmand⌬Cpare considered, the method of Becktel
and Schellman (33) gave mean errors in the range 5–9%, with
which the⌬GD° values of all proteins are estimated. This then
means that the change in the stability parameter (⌬GD°) on
increasing [TMAO] is not large (see Table I). However, there is a definite trend in the variation of⌬GD° with [TMAO]. It is also seen in Table I that the effect of osmolytes on the protein stability in terms ofTmis significantly large. One of the
im-portant conclusions reached from the results presented in Ta-ble I is that TMAO stabilizes proteins if pH isⱖ5.0 and desta-bilizes proteins if pH is⬍5.0. It is noteworthy that our findings at pH 5.0 and above is consistent with earlier reports (7–11, 36). However, no report is available for the effect of TMAO on protein stability at pH values of⬍5.0.
A large body of data suggests the following. (i) The preferen-tial exclusion of the osmolyte from the protein domain (i.e.the preferential hydration of the protein) stabilizes the native state by shifting the equilibrium, N state7D state, toward the N state. (ii) The preferential binding of the osmolyte to the dena-tured protein destabilizes the N state by shifting the equilib-rium toward the D state. (iii) The observed effect of the os-molyte on the denaturation equilibrium is a balance between these two opposing effects (37). Thus, the stabilization effect of TMAO on all the three proteins at a pH ofⱖ5.0 could be due to the dominating preferential exclusion effect, and the destabili-zation of proteins at pH⬍5.0 could be due to the dominating preferential binding effect. In the absence of data on the pref-erential exclusion of TMAO from the domains of RNase A, lysozyme, and␣-LA and the preferential binding of TMAO with FIG. 3.Representative thermal
de-naturation profiles of ␣-LA in the
presence of different concentrations of TMAO at pH 7.0 and pH 4.0. Dena-turation curves of ␣-LA in the absence and presence of various concentrations of TMAO are shown at pH values of 7.0 (A) and 4.0 (B). Curve numbers have the same meanings as in Fig. 1. The insets shown inpanels AandBare the melting curves measured by []222, and thecurve
numbershave the same meaning as those in Fig. 1. For the sake of clarity, the de-naturation profile of the protein in the presence of 0.5MTMAO is not shown.
by guest, on March 14, 2012
www.jbc.org
these proteins, we have used the Wyman linkage relation (38) to determine the preferential exclusion/binding parameter. Briefly, upon changing only the osmolyte concentration, the change in the equilibrium constant of the two-state denatur-ation is given by the difference in the number of osmolyte molecules bound by the denatured and native protein mole-cules, as shown in Equation 4,
␦lnKD°/␦lna ⫽ ⌬⫽D⫺N (Eq. 4) whereKD° is the equilibrium constant of protein denaturation
at 25 °C,ais the thermodynamic activity of the osmolytes, and
⌬ is the difference between the number of molecules of the osmolyte bound per mole of protein between the denatured (D) and native (N) states. Furthermore, if ⌬, the value of the
slope of the plot of lnKD°versuslna, is negative, the
preferen-tial exclusion effect dominates over the preferenpreferen-tial binding effect; if ⌬ is positive, the preferential binding effect domi-nates over the preferential exclusion effect. It is interesting to recall the study of Wang and Bolen (27), who determined the transfer-free energies of protein groups (side chains and
pep-tide backbone unit) and showed that both binding and exclu-sion effects are observed when a protein is present in a TMAO solution.
We have determined⌬values of all proteins from the plots of lnKD°versuslnaat different pH values. It is seen in Fig. 6
that for all proteins the slope (⌬) is negative at pH values of ⱖ5.0, suggesting that TMAO is preferentially excluded from the domains of RNase A, lysozyme, and␣-LA. Although the preferential interaction parameters of these proteins have not been reported, there is experimental evidence for the preferential hydration of proteins in the presence of TMAO near neutral pH (11). Using the procedure of Wang and Bolen (27) and their data on the transfer-free energies of protein groups, we have determined transfer-free energies of ly-sozyme, RNase A, and ␣-LA from water to 1M TMAO solu-tion. It has been observed that this transfer-free energy change of each protein is positive, suggesting that the effect of the exclusion of osmolytes from the peptide backbone
dom-FIG. 5.Representative⌬H
mversus Tmplots of the protein in
the absence and presence of TMAO.Plots of⌬Hmversus Tmare shown for␣-LA in the absence (E) and presence of 1MTMAO (‚). Three independent measurements of⌬HmandTmwere made at each pH. The solid lineat a given osmolyte concentration shows the best fit of the total 15 points.
TABLE I
Thermodynamic parameters of lysozyme, RNase A, and apo-␣-lactalbumin in the presence of TMAO
Lysozymea,b
关TMAO兴 pH 6.0 pH 5.0 pH 3.5 pH 2.5 pH 2.0 ⌬Cp
Tm ⌬Hm ⌬GD° Tm ⌬Hm ⌬GD° Tm ⌬Hm ⌬GD° Tm ⌬Hm ⌬GD° Tm ⌬Hm ⌬GD°
0.00 84.0 128 12.77 80.0 118 11.05 77.0 110 9.74 63.7 92 6.82 58.0 84 5.63 1.62⫾0.08 0.25 84.9 129 13.30 81.0 120 11.70 75.0 106 9.33 61.8 90 6.61 55.8 82 5.35 1.60⫾0.93 0.50 85.3 131 13.56 82.1 121 11.77 73.5 103 8.78 60.6 87 6.16 54.5 81 5.12 1.59⫾0.07 0.75 85.5 133 13.60 82.8 125 12.20 72.5 100 8.20 59.3 85 5.79 53.3 80 4.90 1.62⫾0.19 1.00 86.8 135 14.00 83.5 126 12.40 72.0 96 7.63 58.3 84 5.63 52.9 79 4.76 1.63⫾0.10
RNase-Aa
关TMAO兴 pH 7.0 pH 6.0 pH 4.4 pH 4.0 pH 2.0 ⌬Cp
Tm ⌬Hm ⌬GD° Tm ⌬Hm ⌬GD° Tm ⌬Hm ⌬GD° Tm ⌬Hm ⌬GD° Tm ⌬Hm ⌬GD°
0.00 63.3 117 10.50 62.4 113 9.91 57.6 101 7.90 53.2 95 6.65 36.0 82 2.63 1.23⫾0.05 0.25 63.8 119 10.80 62.9 114 10.10 56.5 99 7.51 52.0 93 6.28 35.1 81 2.44 1.24⫾0.07 0.50 64.5 120 11.00 63.5 115 10.30 55.2 97 7.10 51.0 92 6.00 34.080 2.20 1.24⫾0.10 0.75 65.2 121 11.20 64.6 116 10.50 55.0 96 7.00 50.5 90 5.80 33.6 79 2.05 1.23⫾0.12 1.00 66.0 124 11.65 66.3 117 10.85 54.4 94 6.70 50.1 88 5.60 32.0 78 1.70 1.24⫾0.09
␣-LAa
关TMAO兴 pH 7.0 PH 6.5 PH 6.0 pH 5.5 pH 4.0 ⌬Cp
Tm ⌬Hm ⌬GD° Tm ⌬Hm ⌬GD° Tm ⌬Hm ⌬GD° Tm ⌬Hm ⌬GD° Tm ⌬Hm ⌬GD°
0.00 42.5 50 2.00 50.5 67 3.70 55.0 72 4.40 59.8 76 5.02 34.0 41 1.02 1.55⫾0.07 0.25 43.5 53 2.26 53.8 68 4.00 56.4 73 4.60 61.8 81 5.70 33.5 38 0.87 1.52⫾0.04 0.50 44.2 55 2.41 55.0 69 4.11 56.8 74 4.77 62.3 83 5.89 32.0 35 0.70 1.50⫾0.08 0.75 46.4 58 2.80 57.8 73 4.74 58.8 75 4.99 62.8 84 6.18 30.2 34 0.52 1.48⫾0.06 1.00 46.3 60 2.91 58.0 75 4.92 59.8 78 5.32 63.5 85 6.49 29.0 32 0.40 1.54⫾0.12 a
Tm,⌬Hmand⌬Cpare in °C, kcal mol
⫺1
, and kcal mol⫺1
K⫺1
, respectively. From triplicate measurements the values of maximum errors from the mean are 0.1– 0.6% and 2–5% inTm, and⌬Hm, respectively. The error in⌬GD° is in the range 5–9%.
bT
mand⌬Hmof lysozyme are corrected for the effect of 2MGdmCl at pH values of 5.0 and 6.0 (see “Experimental Procedures” and “Results”).
FIG. 4.Effect of GdmCl onTmand⌬Hmof lysozyme.Plots ofTm versus[GdmCl] (A) and⌬Hmversus[GdmCl] (B) of lysozyme are shown at pH values of 6.0 and 5.0. Three independent measurements ofTm and⌬Hmwere made at each [GdmCl] value. Thesolid lineat each pH value shows the best fit of the total 12 points.
by guest, on March 14, 2012
www.jbc.org
inates over the preferential binding of the osmolytes with side chains. It is also seen in Fig. 6 that for all proteins the slope (⌬) is positive at pH values⬍5.0, suggesting that the effect of the binding of TMAO with side chains dominates over the effect of the exclusion of TMAO from the peptide backbone. However, no data on the preferential binding and transfer-free energies of protein groups from water to TMAO solution at pH values ⬍5.0 are available to support our argument.
At present we do not have any explanation for the above-mentioned peculiar behavior of TMAO, i.e. that it stabilizes proteins at pH ⬎5.0 and destabilizes proteins at pH⬍5.0. It may, however, be noted that the pKaof TMAO is 4.66⫾0.10.
Hence, the zwiterionic form of TMAO dominates over its posi-tively charged form at all values of pH greater than the pKa,
and the positively charged form dominates at all values of pH less than the pKa. We are therefore tempted to suggest that the
zwitterionic form of TMAO stabilizes proteins, whereas the positively charged form of TMAO destabilizes proteins. To sup-port this proposition, we have studied heat-induced denatur-ation of RNase A and lysozyme in the presence of 1Mglycine betaine at pH values of 6.0 and 2.0.2It has been observed that
1Mglycine betaine (pKa⫽2.17) stabilizes both proteins at pH 6.0, where it exists as a zwitterion, and loses its stabilizing effect at pH 2.0, where it is positively charged. That is why, as suggested by Yancey et al.(2), molecules existing in charged forms are not used by nature as osmolytes.
The⌬Hmvalues of many proteins in the presence of various
osmolytes near neutral pH have been reported (11, 39 – 42). One of the conclusions of these studies is that the ⌬Hm of
proteins in the presence of osmolytes may increase, decrease, or remain unchanged.⌬Hmof RNase-T1 has been measured in
the presence of different concentrations of TMAO near neutral pH, and it has been reported that it increases with increasing [TMAO] (11). It is also seen in Table I that the ⌬Hm of ly-sozyme, RNase A, and␣-LA in the pH range 5.0 –7.0 increases with [TMAO], although this increase in⌬Hmis not very
signif-icant. It is also seen in Table I that ⌬Hm of each protein
decreases with the [TMAO] in the pH range of ⬍5.0, where TMAO acts as a destabilizer. Furthermore, results shown in Fig. 6 show that the preferential binding of TMAO occurs at pH values of⬍5.0 for⌬of⬎0. It is noteworthy that additives that are destabilizers decrease the ⌬Hm of a protein because of preferential binding with proteins (34).
To understand the thermodynamic basis of the mechanism of stabilization of the proteins by TMAO under physiological con-ditions, we have determined the ⌬HD° (enthalpy change at 25 °C) and⌬SD° (entropy change at 25 °C) of lysozyme, RNase
A, and ␣-LA in the presence of different concentrations of TMAO at all pH values. It has been observed that at pH values ⱖ5.0, both ⌬⌬HD° (difference in ⌬HD° of the protein in the presence and absence of TMAO) and⌬⌬SD° (difference in⌬SD°
of the protein in the presence and absence of TMAO) are⬎0. The representative data (⌬⌬HD° and⌬⌬SD°) are given in Table
II and suggest that protein stabilization by TMAO is enthalpi-cally unfavorable and entropienthalpi-cally favorable. However, the un-favorable enthalpy change outweighs the un-favorable entropy change to yield an unfavorable free energy change (⌬⌬GD° of
⬎0). Thus, the stabilization of all the proteins by TMAO is enthalpically controlled at pH 5.0 and above. It is noteworthy that Zouet al.(43) measured⌬Htr° (enthalpy change of
trans-fer) and ⌬Str° (entropy change of transfer) of protein groups
upon transference from water to TMAO solution using isother-mal titration calorimetry near neutral pH and at 25 °C. From these measurements they predicted that protein stabilization by TMAO is enthalpically controlled.
It has been observed that at pH values of ⬍5.0 there is a decrease in⌬HD° of lysozyme and␣-LA upon transferring them
from water to each [TMAO], whereas the⌬⌬SD° for this process
increases for lysozyme and decreases for␣-LA. The represent-ative data (⌬⌬HD° and⌬⌬SD°) of these proteins are given in Table II. These results suggest that the enthalpic contribution to protein destabilization outweighs the entropic contribution leading to a⌬⌬GD° of⬍0; hence, destabilization is under
en-thalpic control. In the case of RNase A, both⌬HD° and ⌬SD° increase upon transferring the protein from water to different TMAO concentrations. The representative (⌬⌬HD°, ⌬⌬SD°)
data are given in Table II, where it is seen that the destabili-zation of RNase A is under entropic control.
The⌬Cpof several proteins have been measured in the
pres-ence of various osmolytes, and it has been observed that
depend-2
R. Singh, I. Haque, and F. Ahmad, unpublished results. FIG. 6.Wyman plots of the effect of TMAO on the denaturation
of proteins at various pH values and 25 °C.Plots of lnKD°versus lnafor lysozyme, RNase A, and␣-LA are shown at the indicated pH values. The number at theright endof eachlineindicates the slope,⌬ (see Equation 4), determined by the linear least squares analysis. The symbols on each line relate to the pH value given at theleft endof theline.
by guest, on March 14, 2012
www.jbc.org
ing on the protein and the osmolyte used, the⌬Cpmay increase,
decrease, or remain unchanged in the presence of osmolytes (11, 39 – 42). It is seen in Table I that the⌬Cpvalues of lysozyme,
RNase A, and␣-LA are unchanged upon the addition of TMAO. The current viewpoint regarding the⌬Cpof a protein is that it
originates from the change in polar and nonpolar accessible sur-face areas on protein denaturation (44). This viewpoint is de-scribed by the relation shown in Equation 5,
⌬Cp⫽⌬Cpap⌬ASAap⫹⌬Cppol⌬ASApol (Eq. 5) where⌬ASAapand⌬ASApol, respectively, are changes in the
accessible surface area of apolar and polar groups on dena-turation, and⌬Cpapand⌬C
p
polare the constant pressure heat
capacity changes associated with the exposure of 1 mol䡠Å2of apolar and polar groups, respectively (44, 45);⌬Cpapis⬎0 and ⌬Cppol is ⬍0 in water (44). It has been reported that the
structure of the native and denatured states of proteins are not affected in the presence of TMAO (7, 26). The results shown in Fig. 7 support these reports. Thus, the change in accessible surface area (⌬ASA) values of polar and apolar groups in the presence of TMAO are expected to be unper-turbed. If this is the case, it is obvious that the ⌬Cp of a
protein will depend only on the dependencies of ⌬Cppol and ⌬Cpapon solvent composition. Therefore, no change in the⌬Cp
of proteins upon transferring them from water to TMAO solution means that the apolar and polar contributions re-main either unchanged or changed in such a way that they lead to no change in the observed⌬Cpof proteins.
This study clearly demonstrates that the zwitterionic form of TMAO stabilizes proteins, for bothTmand⌬GD° increase with
[TMAO], whereas the positively charged form of the osmolyte destabilizes proteins in terms ofTmand ⌬GD°. Furthermore, we have demonstrated that the zwitterionic form is excluded from the protein surface for a ⌬ of ⬍0, whereas positively charged form binds to proteins for a⌬of⬎0.
Recently, Chilson and Chilson (46) have shown that TMAO failed to refold acid and that GdmCl denatured lactate dehy-drogenase at pH 2.3. These observations are in agreement with our finding that TMAO at this pH is a protein destabilizer. Thus, one practical aspect of our study is that TMAO cannot be used to refold proteins at pH below its pKa. Interestingly, there
are many marine animals that are bottom dwellers and use TMAO as an osmolyte to counteract the deleterious effects of pressure on proteins (47). These animals are also known to have a H⫹ pump at their cell membrane to maintain (near
neutral) pH homeostasis (48). As suggested by our study, one obvious reason for having this H⫹ pump is that TMAO can
protect the cellular proteins and enzymes against pressure denaturation, which is possible only when pH is above the pKa
of the osmolyte. This is one possible biological implication of our study of TMAO-protein interaction at pH of⬍5.0.
Acknowledgments—We are grateful to Dr. Rajiv Bhat, Centre for Biotechnology, Jawaharlal Nehru University, New Delhi, India for the critical reading and valuable suggestions on the manuscript. We thank Prof. M. A. Baig, Department of Biochemistry, Jamia Hamdard, New Delhi, India for the use of the CD machine.
FIG. 7.Effect of TMAO on the sec-ondary and tertiary structures of the native and denatured states of ly-sozyme, RNase A, and␣-LA.AandD, lysozyme.Curve 1depicts the far- (A) and near-UV (D) CD spectra of the native state in 0MTMAO at pH values of 6.0 (——) and 2.0 (䡠–䡠–䡠–) and in 1MTMAO at
pH values of 6.0 and 2.0 (䡠䡠䡠䡠). Curve 2 depicts the far- (A) and near-UV (D) CD spectra of the denatured state in 0 M
TMAO at pH values of 6.0 (——) and 2.0 (䡠–䡠–䡠) and in 1MTMAO at pH values of 6.0 and 2.0 (䡠䡠䡠䡠).BandE, RNase A.Curves 1 and2have the same meanings as in panels AandD, except that the highest pH is 7.0 instead of 6.0.CandF,␣-LA. Curve 1 represents the far- (C) and near-UV (F) CD spectra of the native state in the absence (——) and presence (䡠䡠䡠䡠) of 1MTMAO at pH 7.0.Curve 2 de-picts the far- (C) and near-UV (F) CD spectra of the denatured state in 0 M
TMAO at pH values of 7.0 (——) and 4.0 (䡠–䡠–䡠–) and in 1.0MTMAO at pH values of 7.0 and 4.0 (䡠䡠䡠䡠).Curves 1and2represent measurements at 25 and 85 °C, respectively.
TABLE II
Change in stability parameters on transferring proteins from 0Mto 1MTMAO at two extreme pH values and 25 °C
Protein
Highest pHa,b Lowest pHa,c
⌬⌬HD° ⌬⌬SD° ⌬⌬GD° ⌬⌬HD° ⌬⌬SD° ⌬⌬GD°
Lysozyme 2620 4.66 1230 ⫺640 1.10 ⫺970
RNase-A 4060 9.56 1210 1410 7.51 ⫺830
␣-LA 4480 12.07 880 ⫺900 ⫺0.37 ⫺800
a⌬⌬H
D° and⌬⌬GD° are in kcal mol
⫺1and,⌬⌬S
D° is in kcal mol
⫺1K⫺1.
b
The highest pH values during the studies are 7.0 for RNase-A and␣-LA and 6.0 for lysozyme. cThe lowest pH values are 2.0 for lysozyme and RNase-A and 4.0 for
␣-LA.
by guest, on March 14, 2012
www.jbc.org
REFERENCES
1. Welch, W. J., and Brown, C. R. (1996)Cell Stress Chaperones1,109 –115 2. Yancey, P. H., Clark, M. E., Hand, S. C., Bowlus, R. D., and Somero, G. N.
(1982)Science217,1214 –1222
3. Burg, M. B. (1995)Am. J. Physiol.268,F983–F996
4. Qu, Y., Bolen, C. L., and Bolen, D. W. (1998)Proc. Natl. Acad. Sci. U. S. A.95,
9268 –9273
5. Somero, G. N. (1986)Am. J. Physiol.251,R197–R213
6. Forster, R. P., and Goldstein, L. (1976)Am. J. Physiol.230,925–931 7. Ratnaparkhi, G. S., and Varadarajan, R. (2001) J. Biol. Chem. 276,
28789 –28798
8. Yancey, P. H., and Somero, G. N. (1979)Biochem. J.183,317–323 9. Mello, C. C., and Barrick, D. (2003)Protein Sci.12,1522–1529 10. Arakawa, T., and Timasheff, S. N. (1985)Biophys. J.47,411– 414 11. Lin, T. Y., and Timasheff. S. N. (1994)Biochemistry33,12695–12701 12. Baskakov, I., and Bolen, D. W. (1998)J. Biol. Chem.273,4831– 4834 13. Baskakov, I., and Bolen, D. W. (1998)Biophys. J.74,2658 –2665
14. Baskakov, I. V., Kumar, R., Srinivasan, G., Ji, Y. S., Bolen, D. W., and Thompson, E. B. (1999)J. Biol. Chem.274,10693–10696
15. Kumar, R., Lee, J. C., Bolen, D. W., and Thompson, E. B. (2001)J. Biol. Chem. 276,18146 –18152
16. Natalia, A. C., Stephen, E. H., and Donald, J. W. (2001)Eur. J. Biochem.268,
506 –513
17. Rivas, G., Fernandez, J. A., and Minton, A. P. (1999) Biochemistry38,
9379 –9388
18. Devlin, G. L., Parfrey, H., Deborah, J. T., David, A. L., and Bottomley, S. P. (2001)Am. J. Respir. Cell Mol. Biol.24,727–732
19. Brown, C. R., Hongbrown, L. Q., Biwersi, J., Verkman, A. S., and Welch, W. J. (1996)Cell Stress Chaperones1,117–125
20. Tatzelt, J., Prusiner, S. B., and Welch, W. J. (1996)EMBO J.15,6363– 6373 21. Waldegger, S., and Lang, F. (1998)J. Membr. Biol.162,95–100
22. Treberg, J. R., and Driedzic, W. R. (2002)J. Exp. Zool.293,39 – 45
23. Yancey, P. H., Fyfe-Johnson, A. L., Kelly, R. H., Walker, V. P., and Aunon, M. T. (2001)J. Exp. Zool.289,172–176
24. Yancey, P. H., and Somero, G. N. (1980)J. Exp. Zool.212,205–213 25. Seibel, B. A., and Walsh, P. J. (2002)J. Exp. Biol.205,297–306 26. Youxing, Q., and Bolen, D. W. (2003)Biochemistry42,5837–5849 27. Wang, A., and Bolen, D. W. (1997)Biochemistry36,9101–9108 28. Bigelow, C. C. (1960)C. R. Trav. Lab. Carlsberg31,305–324 29. Hamaguchi, K., and Kurono, A. (1968)J. Biochem.54,111–122
30. Sugai, S., Yashiko, H., and Nita, K. (1973)Biochim. Biophys. Acta328,35– 41 31. Pace, C. N. (1986)Methods Enzymol.131,266 –280
32. Sinha, A., Yadav, S., Ahmad, R., and Ahmad, F. (2000)Biochem. J.345,
711–717
33. Becktel, W. J., and Schellman, J. A. (1987)Biopolymers26,1859 –1877 34. Privalov, P. L. (1979)Adv. Protein Chem.33,167–241
35. Pfeil, W., and Sadowski, M. L. (1985)Studia Biophys.109,163–170 36. Bolen, D. W., and Baskakov, I. V. (2001)J. Mol. Biol.310,955–963 37. Timasheff, S. N. (2002)Proc. Natl. Acad. Sci. U. S. A.99,9721–9726 38. Wyman, J. (1964)Adv. Protein Chem.19,223–286
39. Gekko, K., and Timasheff, S. N. (1981)Biochemistry20,4667– 4676 40. Santoro, M. M., Liu, Y., Khan, S. M. A., Hou, L. X., and Bolen, D. W. (1992)
Biochemistry31,5278 –5283
41. Xie, G., and Timasheff, S. N. (1997)Protein Sci.6,211–221 42. Kaushik, J. K., and Bhat, R. (2003)J. Biol. Chem.278,26458 –26465 43. Zou, Q., Bennion, B. J., Daggett, V., and Murphy, K. P. (2002)J. Am. Chem.
Soc.124,1192–1202
44. Plaza del Pino, I. M., and Sanchez-Ruiz, J. M. (1995) Biochemistry34,
8621– 8630
45. Murphy, K. P., Bhakuni, V., Xie, D., and Friere, E. (1992)J. Mol. Biol.227,
293–306
46. Chilson, O. P., and Chilson, A. E. (2003)Eur. J. Biochem.270,4823– 4834 47. Kelly, R. H., and Yancey, P. H. (1999)Biol. Bull.196,18 –25
48. Claiborne, J. B., Edwards, S. L., and Morrison-Shetlar, A. I. (2002)J. Exp. Zool.293,302–319
by guest, on March 14, 2012
www.jbc.org