Corresponding author: Kencana Sari
E-mail: [email protected]
Female, live in urban, and the existence of a caregiver increased risk
over-nutrition in elderly: an Indonesian national study 2010
Kencana Sari,
1Muchtaruddin Mansyur
21The Center for Public Health Intervention Technology, The National Institute of Health Research and Development,
Indonesian Ministry of Health
2 Department of Community Medicine, Faculty of Medicine, Universitas Indonesia
Abstrak
Latar belakang: Kelebihan nutrisi dapat mengakibatkan masalah kesehatan pada lansia. Hal ini memerlukan upaya pencegahan dengan mengetahui penyebabnya. Penelitian ini untuk mengidentifi kasi beberapa faktor dominan yang berkaitan dengan kelebihan nutrisi.
Metode: Data merupakan sebagian penelitian potong lintang dari sebagian data Riset Kesehatan Dasar (Riskesdas) 2010.Subjek terdiri dari 16 142 orang berumur 60 tahun atau lebih yang berasal dari 266 510 rumah tangga. Data yang dikumpulkan antara lain data sosio-demografi . Status gizi ditentukan dengan indeks massa tubuh (IMT) dengan kategori normal (18.5-24.9 kg/m2) dan nutrisi berlebih (25kg/m2 atau lebih).
Asupan nutrisi berdasarkan wawancara asupan makanan selama 24 jam terakhir. Untuk mengidentifi kasi faktor risiko kelebihan nutrisi dipergunakan perhitungan risiko relatif.
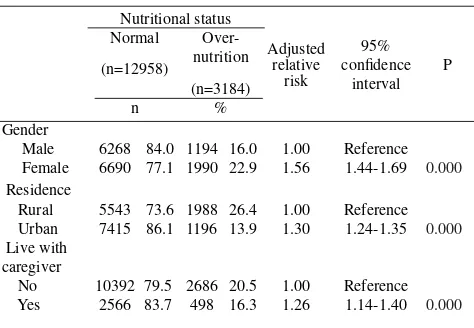
Hasil: Kelebihan nutrisi sebanyak 3184 (19,7%) subjek dan yang normal 12 958 (80,3%). Dibandingkan dengan lelaki, perempuan berisiko 56% lebih banyak menderita kelebihan nutrisi [risiko relatif (RRa) = 1,56;95% interval kepercayaan (CI) = 1.44;1,69]. Subjek yang berdomisili di perkotaan dibanding pedesaan berisiko 30% lebih tinggi menderita nutrisi berlebih (RRa = 1,30; 95% CI = 1,24;1,35). Sedangkan subjek yang mempunyai pendamping/pembantu mempunyai risiko kenaikan 26% menderita Kelebihan nutrisi (RRa = 1,26; 95% CI = 1,16;1,40).
Kesimpulan: Subjek yang mempunyai pendamping/pembantu, perempuan, dan yang bedomisili di perkotaan berisiko lebih menderita kelebihan nutrisi. Oleh karena itu diperlukam pendidikan kesehatan kepada lansia dan pendamping/pembantunya tentang gizi seimbang. (Health Science Indones 2012;1:9-14)
Kata kunci: lansia, nutrisi berlebih, pen damping
Abstract
Background: Over-nutrition could leads health problems in the elderly which requires control efforts. Knowing the risk factors of over-nutrition is necessary to overcome the over-nutrition related health problems. This study aimed to identify the determinant factors of over-nutrition in the elderly.
Methods: The study used a cross-sectional study as a part of Basic Health Research (Riskesdas) 2010. The subjects consisted of 16 142 respondents aged 60 years or older with normal nutritional status and over-nutrition that derived from 26 6510 household members. Riskesdas data on sociodemographic was collected by questionnaire. Nutritional status was measured using body mass index (BMI). BMI was categorized into normal (18.5-24.9) and over-nutrition (25 or over). Nutrition intake was obtained from 24 hour food recall. Over-nutritional risk factors identifi ed by relative risks.
Results: This analysis noted 3 184 (19.7%) subjects were over-nutrition and 12 958 (80.3%) were normal. Female than male 56% more risk to be over-nutrition [adjusted relative risk (RRa) = 1.56; 95% confi dence interval (CI) = 1.44;1.69]. Living in urban than rural area 30% more risk to be over-nutrition(RRa = 1.30; 95% CI = 1.24;1.35). While the presence of caregiver 26% increased to be over-nutrition in elderly (RRa = 1.26; 95% CI = 1.16;1.40).
Conclusion: The presence of a caregiver, woman, and living in urban area increased risk to be over-nutrition in elderly. Health education is needed for the elderly family and caregiver to enhance their knowledge on providing balanced nutrition to control over-nutrition. (Health Science Indones 2012;1:9-14)
Aging population is an issue for the developing and developed countries. In Indonesia, approximately 50.5 million people or 21.7% of population is older age group (> 45 years).1 In the next mid-century (2050)
total population of Indonesia will be 284.6 million, with >24% aging population.2 Several studies have
shown that nutritional problems in elderly is largely due to over-nutrition including overweight and obesity, which lead to various degenerative diseases such as coronary heart disease, hypertension, diabetes mellitus, gallstones, arthritis, kidney disease and cancer.3 In addition, obesity in the elderly also trigger
the musculoskeletal disorder.4 Obesity in the elderly is
a major factor in losing of independency5 and reduced
ability of the limbs to perform physical activity that increases the tendency to become disabled.4 Study of
disability on 77 501 elderly in Indonesia showed 19,1% of elderly with over-nutrition status become disabled.3
Obese on elderly can be a burden to other family members and decline their productivity especially for those who are in employment age. Based on Fontaine et al.6 less BMI
(<17 to 19) resulting in fewer 1-9 years of age and high BMI (> 35) associated with a reduction in the age of 9-13 years. Malnutrition, either under-nutrition or over-nutrition, at the age of 70 years can increase mortality.5
Over-nutritional status is due to unbalance of amount of energy intake (consumption) and energy expenditure (physical activity). Weight gain in elderly also triggered by lesser activity.4 In contrast, losing appetite and sense
of taste can also affect the consumption on the elderly. Changes both physiologically and biologically causes decreased metabolism and physical capacity.
Other factors such as gender and area of residence also affect person’s health status. In many countries, including Indonesia, the prevalence of obese women is higher than male and also related to other socio-economic conditions.7. Branca9 showed that cases of obesity in
some developed countries were higher in female than male group. Other longitudinal study showed that women who are overweight tend to those who are not married, low educated and low income.10 In Indonesia,
based on the socio-demographic characteristics, obesity tend to be higher on those who lived in urban area, were well educated, and had high economic status.7
Controlling over nutrition in the elderly is important to prevent health problems related to obesity by knowing the risk factors. This study aimed to identify determinant of over-nutrition in the elderly.
METHODS
This study used a cross-sectional study as part of Basic Health Research (Riskesdas) data, 2010. Samples derived from 33 provinces and 441 districts/cities in Indonesia. Probability proportional to size was applied to get the census block (CB) target of 2800 CB. Purposive sampling was used in every census block to obtain sample at the household level (25 households) per census block. The data consisted of 2 798 BS, with 69 300 households, and 266 510 household members. The population in this study was all elderly in Indonesia over 60 years old, according to the defi nition of elderly in the Welfare of the Elderly Act No.13 year 1998.11 Available data of socio-demography, and
anthropometry were 21 380 samples, and 21 094 samples respectively. To strengthen the fi ndings, the data analysis limited to the group of normal weight and the group of over-nutrition status (overweight and obesity), yet the underweight respondents were excluded. Therefore, the study consisted of 16 142 samples. The dependent variable in this study is nutritional status (normal weight, and over-nutrition). The independent variable in this study consisted of socio-demographic factors (gender, marital status, occupation, economic status, area of residence village /city, and the presence of a caregiver) and nutrient intake (protein intake, fat intake, carbohydrate intake, energy intake). Measurement of height and weight of the respondents were conducted by trained enumerators.
Body weight was measured on digital scales with 0.1 kg precision and height was measured using a microtoise with precision of 0.1 cm. Nutritional status was calculated based on body mass index (BMI) by calculating the weight in kilograms divided by height in meters squared. Data on socio-demographic were obtained through interviews using a questionnaire. Food consumption data were obtained through 24-hour food recall.
In this study, over-nutrition was defi ned as overweight and obesity with the category according to WHO criteria. Normal nutritional status is respondent within BMI 18.5-24.9 kg/m2, and over-nutritional status
was referred to the respondent who had BMI 25kg/ m2 or more. Categories of food intake was defi ned
Table 1. Several sociodemographic, consumption factors and the risk of over-nutrition on elderly
Nutritional status
Crude relative risk 95% confi dence
interval P
Normal
(n=12958)
Over-nutrition
(n=3184)
n % n %
Marital status 2313 19.8
Married 9374 80.2 871 19.6 1.00 Reference
Not married 3584 80.4 0.99 0.91-1.07 0.759
Employment history 1289 21.4
Unemployed 4726 78.6 122 36.9 1.00 Reference
Private/government employee 209 63.1 550 29.2 1.71 1.43-2.07 0.003
Entrepreneur 1333 70.8 831 12.6 1.36 1.23-1.51 0.033
Farmer/fi sherman/laborer 5756 87.4 392 29.6 0.59 0.54-0.64 0.855
Others 934 70.4 1.38 1.23-1.54 0.000
Level of expenditure 420 11.0
Lowest 3413 89.0 501 14.8 1.00 Reference
Second 2878 85.2 610 19.0 1.33 1.19-1.54 0.000
Middle 2600 81.0 789 25.6 1.75 1.53-1.96 0.000
Fourth 2297 74.4 864 32.8 2.38 2.07-2.62 0.000
Highest 1770 67.2 2.99 2.66-3.36 0.000
Fat consumption 1538 17.9
<15% TE 7074 82.1 816 20.7 1.00 Reference
15-25% TE 3120 79.3 830 23.1 0.89 0.81-0.99 0.000
>25% TE 2764 76.9 0.77 0.71-0.84 0.000
Carbohydrate consumption 2002 19.6
<50% TE 8218 80.4 390 21.2 1.00 Reference
50-60% TE 1449 78.8 792 19.4 1.09 0.97-1.23 0.821
>60% TE 3291 80.6 1.01 0.93-1.10 0.151
Protein consumption 1780 18.2
<80% RDA 7999 81.8 494 20.6 1.00 Reference
80-100% RDA 1903 79.4 910 22.9 0.90 0.80-1.00 0.000
>100% RDA 3056 77.1 0.79 0.73-0.86 0.015
Energy consumption 1902 18.9
<70% RDA 8172 81.1 550 21.6 1.00 Reference
70-100% RDA 2000 78.4 732 20.8 1.03 0.93-1.16 0.025
>100% RDA 2786 79.2 0.91 0.83-0.99 0.006
carbohydrate intake is 50-60% of total energy, protein intake is 80-100% RDA, and energy consumption is 70-100% RDA.
Analyses were performed by using SPSS version 13. Independent variables associated with over-nutrition in the bivariate analysis with p value of < 0.25 were candidate risk factors included to calculate the adjusted relative risks. To obtain the determinant factor of over-nutrition in the elderly and the adjusted relative risks the Cox regression analysis with stepwise forward method was performed at the signifi cance level p <0.05.
RESULTS
Total number of Riskesdas sample with complete data on normal and over-nutrition were 16142 samples, of which 12958 (80.3%) were elderly with normal nutritional status and 3184 (19.7%) elderly with over-nutrition.
Table 2. Relationship between socioeconomic groups and risk of
*Adjusted each other between variables in this table, protein consumption, marital status, employment history, and level of expenditure
Our fi nal model (Table 2) shows that gender, employment history, economic status, area of residence, and the presence of a caregiver associated to nutritional status in the elderly.
Elderly women than men had 56% more than one and half time risk of over-nutrition [adjusted relative risk (RRa) = 1.56, 95% confi dence interval (CI) = 1.44-1.69)]. As well as those who were living in urban areas had 30% greater risk of a tendency to be in over-nutrition than the elderly living in rural area (RR = 1.30, 95% CI = 1.24; 1.35). The presence of a caregiver increased the risk of over-nutrition in the elderly (RRa = 1.26; 95% CI = 1.16-1.40). In addition, the higher the social status was the riskier to be in over-nutrition.
DISCUSSION
This study was a further analysis of 2010 Riskesdas data, so that the analysis conducted in this study was limited to the existing variables in the Riskedas questionnaire. Riskesdas did not perform measurements of physical activity as one of the factors that can infl uence nutritional status. However, Riskesdas was the largest community-based health survey in Indonesia with the most enable data collection instruments. Riskesdas also maintains the validity of the data which making it possible to generate the health status in Indonesia.
This study found that gender, marital status, employment history, economic status, area of residence in the village/town, and the presence of a caregiver affected the over-nutrition of the elderly. The food intake variable had relatively small effect on the elderly.
The analysis of gender and nutritional status suggested that elderly women had higher risk of obesity. In 2007, national prevalence of obesity in adults men was lower, 16.3%, than females (26.9%).7 The results were
consistent with the Huang’s study13 which showed that
the prevalence of obesity in the elderly in Taiwan was higher (36.8%) in women compared with men 29.0% (BMI > 25 kg/m2). This study’s results also consistent with Suzana’s study where obesity in elderly women in Malaysia was two-fold (13.8%) than men (7.4%).14
There were several physiological reasons why women are more obese than men. First, it could be caused by the composition of the female body that has more fat than muscle. Women’s body content fat about 6-11% more than men.15 Women also have a high estrogen
hormone so that the body tends to store and retain fat. Puberty and early pregnancy increases levels of estrogen that can increase fat reserves in preparation for fertilization, fetal development and lactation.15
The women also slow in metabolism. However, this is contrary to a study’s result that compared with men, women spend money for food or snacks less than men.16 In fact, eating out or snacking can increase the
risk of obesity.
Elderly who live in urban had 30% higher risk to be in over nutritional status than those who live in rural. People living in urban areas will be fatter.14,17 This
study’s result was consistent with the study on the elderly in Malaysia that showed those living in urban areas will tend to be in over-nutritional status than those who live in rural areas.14
The results of cross tabulation between urban villages and fat consumption showed that the number of elderly in urban areas that consume more fat than normal recommendations is higher than those who live in rural areas. This can be caused by social factors and the condition of remote areas, limited access of transportation, limited food vendors that sale high-calorie food.16 Purchasing power also differ between
These results indicated that the higher the socioeconomic level per capita, the higher the prevalence of obesity. This was consistent with a study on the elderly in Malaysia that showed over-nutrition was more common in elderly with higher income.14
Other study conducted in developing countries showed the same pattern.18 It was inversely related to trend in
developed countries. In developed countries, lower socioeconomic groups would be more at risk for the occurrence of over nutrition. This is because social factors infl uence the access to food, and in certain populations, nutritional insecurity will have a signifi cant effect on the election of food.9 In addition, education
and knowledge have an infl uence on obesity, those who are least educated have the highest prevalence.14
The analysis of relation between the existence of a caregiver and over-nutrition in the elderly showed that elderly who lived with a family companion, increases the risk of obesity. This was consistent with the theory that food distribution to parents, children and grandfather affecting the diet as a factor to the personal nutritional status.9 Ledikwe’s study showed
that the elderly who live alone, the amount of energy and protein consumption will be lower, especially in elderly women.16 Furthermore, the elderly who live
alone will affect not only the quantity but also quality of food that they consumed.17 The elderly who have
a family companion as a caregiver maybe get more attention on food intake than the elderly who live without a caregiver. Another factor was the concern of caregiver if elderly do not receive suffi cient and tasty food, would worsen their health status. So that the intake may be excessive when in addition to the reduced physical activity and the decreased of metabolism.
In Indonesia, family is the main resource for taking care of the elderly, either economic or cultural reasons. Indonesian society put a high value the tradition that family have role and responsibility in taking care of parents as fi gures that should be respected.20 That fact
makes the elderly live in shadow of over-nutrition. For example, in the Minangkabau family, ideally from the socio cultural perspective, the social security for the elderly is in the form of concentric circles which children as the center as a primary responsibility. If there are no children in the family then the responsibility lies with the family of mother, and next family of the tribe, and so on.21
In conclusion, female, living in urban areas, and the presence of a caregiver may increase the risk of over-nutrition in the elderly. Therefore, it is important to be controlled to prevent health problems related to obesity.
Acknowledgments
The author would like to express gratitude to Tin Afi fah for her suggestion and assistance.
REFERENCE
BPS-Statistics Indonesia. Population data by age, urban/ 1.
rural area, and gender. 2010. Available at http://sp2010. bps.go.id/index.php/site/tabel?tid=263&wid=0. Indonesian.
Indonesian Profi le. Elderly People of Indonesian 2.
Increased 2.9%. 2011. Available at http://www. majalahpotretindonesia.com/index.php?option=com_c ontent&view=article&id=2782:penduduk-usia-tua-indonesia-naik-29-persen&catid=39:kesehatan&Itemid =399 Indonesian.
Sugiharti. Lestary H. Disability in Indonesian elderly 3.
year 2007. Reprod Health J. 2011 Dec, 2: 1, 39-48. Indonesian.
Flegal KM, Carroll MD, Ogden CL, et al. Prevalence 4.
and trends in obesity among US adults, 1999-2008. JAMA. 2010;303:235-41.
Bruce G. Obesity in elderly needs different approaches. 5.
diabetes, obesity, CVD (DOC) News. 2006;3:1-15. Fontaine K, David R, Wang C, et al. Years of life lost 6.
due to obesity. JAMA. 2003; 289:187-93.
National Health Research Centre Basic Health Research 7.
Report 2010. Jakarta. 2011 Indonesian.
National Health Research Centre Basic Health Research 8.
Report 2007. Jakarta. 2008. Indonesian.
WHO. The Challenge of obesity. Branca (Ed.). 2007. 9.
Franco S, Marion D, Michele C, et al. The obesity 10.
epidemic: analysis of past trends and future trends in selected OECD countries. OECD Health Working Papers No.45. France. 2009.
Act No.13 Republic Indonesia Year 1998 concerning 11.
elderly wellness. 1998.
WHO Technical Report Series. Physical status: The 12.
use and interpretation of anthropometry. Geneva. The Institute. 1995.
Huang K, Meei-Shyuan L, Shyh-Dye L, et al. Obesity 13.
Suzana S, Jamaludin AR, Safi za Noor, et al. The third 14.
national health and morbidity survey: prevalence of obesity, and abdominal obesity among the Malaysian elderly population. Asia-Pacifi c J Public Health. 2012;24:318-29.
ScienceDaily. Why do women store fat differently from 15.
men? March 2, 2009.
Jenny L, Helen W, Diane CM, et al. Nutritional 16.
risk assessment and obesity in rural older adults: a sex difference. The American J Clin Nutrition. 2003;77;551-8.
Ismail MN, Chee SS, Nawawi H, et al. Obesity in 17.
Malaysia. Obes Rev. 2002;3: 203-8. Available at http:// www.ncbi.nlm.nih.gov/pubmed/12164473.
Stunkard AJ. Factors in obesity: current views. In: 18.
Pena M, Bacallao J, editors. Obesity and poverty: a new public health challenge, scientifi c publication.
Washington, DC: Pan American Health Organization/ World Health Organization. 2000:23-28.
Davis MA, Murphy SP, Neuhaus JM, et al.. Living 19.
arrangements affect dietary quality for U.S. adults aged 50 years and older: NHANES III 1988–1994. J Nutrition. 2000. 130:2256–64.
Dung DK, Yulfi ta R. Community-based support for 20.
the elderly in Indonesia: The case of PUSAKA. Paper presented at the 2002 IUSSP Regional Population Conference on “Southeast Asia’s population in a changing Asian Context”, Bangkok, Thailand. 10-14 June 2002.
Yevita N. The role of Minangkabau matrilineal family 21.