SOME DATA OF SECOND SEQUENCE NON STANDARD
AUSTENITIC INGOT, A2
Nurdin Effendi
(1), Aziz K. Jahja
(1), Bandriana
(1), and Wisnu Ari Adi
(1)1. Pusat Teknologi Bahan Industri Nuklir – BATAN
Kawasan Puspiptek Serpong, Tangerang Selatan 15314
E-mail:
[email protected]
(Naskah diterima: 22-11-2011, disetujui: 03-01-2012)
ABSTRACT
SOME DATA OF SECOND SEQUENCE NON STANDARD AUSTENITIC INGOT, A2. Synthesis of second sequence austenite stainless steel named A2 using extracted minerals from Indonesian mines has been carried out. The starting materials for austenite alloy consist of granular ferro-scrap, nickel, ferro-chrome, ferro-manganese, and ferro-silicon. The second sequence composition differs from the former first sequence. This A2 sequence contained more nickel, meanwhile titanium element had not been added explicitly to it, and just been found from raw materials contents or impurities, as well as carbon content in the alloy. However before the actual alloying work started, the first important step was to carry out the determination of the fractional amount of each starting material necessary to form an austenite stainless steel alloy as specified. Once the componential fraction of each base alloy-element was determined, the raw materials are weighed on the mini-balance. After the fractional quantities of each constituent have been computed, an appropriate amount of these base materials are weighed separately on the micro scale. The raw materials were then placed in the induction foundry furnace, which was operated by an electromagnetic inductive-thermal system. The foundry furnace system performs the stirring of the molten materials automatically. The homogenized molten metals were poured down into sand casting prepared in advance. Some of the austenite stainless steel were normalized at 600 oC for 6 hours. The average density is 7.8 g cm-1 and the average hardness value of normalized austenite stainless-steels is in the range of 460 on the Vickers scale. The microstructure observation concludes that an extensive portion of the sample’s structure is dendritic and the surface turns out to be homogenous. X-ray diffraction analysis shows that the material belongs to the fcc crystallographic system, which fits in with the austenite class of the alloy. The experimental fractional elemental composition data acquired by OES method turn out to differ slightly from the theoretical assumption.
Keywords: data, second sequence, non standard, austenite.
ABSTRAK
tidak lagi ditambahkan secara explisit, melainkan diperoleh dari kandungan atau impuritas-impuritas bahan mentahnya, sebagaimana kandungan karbon. Pembuatan dimulai dengan menghitung porsi bahan-bahan tersebut dari data-data spesifikasi yang diberikan, agar spesifikasi komposisi ingot yang dibuat sesuai dengan yang dikehendaki. Setelah kuantitas dari setiap bahan mentahnya dihitung, maka dilakukan penimbangan. Pekerjaan dilanjutkan dengan memasukkan bahan-bahan tersebut kedalam dapur induksi pengecoran yang memiliki sistem pemanasan induksi elektromagnet. Pengadukan bahan dilakukan secara otomatis dari sistem dapur induksi. Cairan baja yang telah homogen dituang kedalam cetakan pasir. Pada sebagian
besar sampel austenitik ini dinormalisir pada 600 oC selama sekitar 6 jam untuk menurunkan
kekerasannya. Nilai rapat massa rata-ratanya sekitar 7,8 g cm-1 sedangkan kekerasan rata-rata
yang diukur dengan metoda Vickers adalah sekitar 460 VHN. Pengamatan struktur mikro menunjukkan bahwa struktur berupa dendritik dan permukaan bahan relatif homogen secara luas. Pola difraksinya menunjukkan bahwa bahan memiliki struktur kristal fcc yang sesuai dengan baja jenis austenitik. Pengamatan distribusi unsur dilakukan dengan alat optical emision spectrometry (OES) dan hasilnya sedikit berbeda dengan perhitungan teori yang dikehendaki.
Kata kunci: data, seri kedua, non standar, austenit.
INTRODUCTION
Unlike the A1 non-standard austenitic material fabricated earlier [1,12], non-standard
austenitic materials sequence-2, with a relatively higher nickel content but with lower titan content, has been prepared. These new alloys were designated with the code name of A2. The titanium element is not separately added to the alloy, but is obtained from impurities that may have been present in the raw material; to compensate for the removal or reduction of titanium, nickel element is added to the alloy. While the content of other elements such as chromium, manganese, and silicon is generally maintained at the original A1 composition. The composition of these elements is listed in Table 1. The purpose of synthesizing the non standard austenitic A2 material is to create a new austenitic type sample with a higher nickel content, having a reduced titanium content or no titanium at all, so in this way the mechanical properties of the material′s should
be significantly improved. Also in this case the ductility is expected to increase, whereas at the same time the material′s corrosion
resistance would be at the same level or even better in comparison to A1. The procedural steps followed in the manufacture of the
non-standard second sequence austenitic steel is similar to that of the first sequence of non-standard steel austenitic steel A1, namely by using the foundry technique [1,2]. However, no
homogenization techniques has been employed on A2 steels as is the case with A1 steel [1], only the normalization process with
homogenize the distribution of elements in order to overcome the formation of carbides which may occur, as well as to obtain the grain growth as in the preceding A1 material
[1,3,4].
results are as follows: micrograms show that the alloy’s surface is relatively homogenous to a wide extent and its grain-boundaries appear somewhat diffuse. The x-ray diffraction pattern of the austenite alloy confirms its fcc crystalline structure. Hardness tests produce relatively high values of hardness distribution (in Vickers scale) in this pre-normalized stainless ingot. Elemental distribution observation using the OES instrument shows a slightly different result in quantity compared to the desired specification.
THEORY
It is generally known that some alloying elements such as nickel, chromium, and titanium in austenitic materials are employed because each of these elements has its own unique purpose, usage, and advantage. Consider the element chromium for example; which functions as a founding element as well as a stabilizer of the ferritic phase and also acts as an anti-corrosion element. But if chromium is subjected to a particular heat treatment procedure, especially in the grain boundary area that has a relatively high Gibb's free energy, then this chromium element has the potential to form carbides by bonding with an existing carbon element. To prevent this from materializing, usually a small amount from one of the elements, either neobium or titanium is added to the alloy materials. The reason behind this is that the Gibb's free energy for carbide formation of any of these two elements with the carbon element is lower than with chromium [5,6] so as to avoid the formation of chromium carbides. The formation of chromium carbides, which is called sensitization, is causing the chromium element to be bound to the carbon element, in such a manner that it is unable to join with oxygen from the atmosphere to form the material’s surface oxide layer. Chromium oxide layer thus formed will function as a coat for the material’s surface, so that whenever porosity is present in the surface of the
material, the atmospheric oxygen which causes corrosion are inhibited from penetrating into the material.
Conversely, supposed now that it is chromium carbide which is formed, then chromium will establish a chemical bonding with carbon, and therefore makes it impossible for the protective oxide-layer which shields the material’s surface to develop, and thus enables oxygen from the atmosphere to freely penetrate the material via its porous surface and therefore causes corrosion to occur in the alloy. This should be the reason of why sensitization must be prevented by adding a small amount of titanium or niobium to the alloy, so that the type of carbide grown in the alloy will be either of the type niobium carbide or titanium carbide, and not the chromium carbides. This way the formation of titanium carbides will harden the surface and prevent sensitization. Reducing the quantity of titanium during the manufacture of austenite A2 experiment was carried out because the price of powder titanium is relatively expensive, and that titanium quantity available from the raw materials is expected to substitute for the commercial titanium. Also alternately, nickel is added as a substitute for the titanium, since it is definitely more economical than titanium. Nickel is very instrumental both during the formation of the austenitic phase, as well as in the stabilization of the austenitic phase, besides functioning as an anti-rust element in the alloy and in the enhancement of the shape-forming ability of the austenitic steel
[7,8]. To sum up the results of this research, A2
MATERIALS AND METHODS Raw materials
The primary raw materials employed in the fabrication of the austenite stainless steel alloy were granular ferro scrap, nickel, ferro-chrome, ferro-manganese, ferro-silicon, etc; these minerals have been extracted from domestic mines; this situation has created an economical advantage because there is no need to purchase expensive imports, since much cheaper alternatives are available domestically. The main raw materials specifications are listed in Table 1 below.
Casting materials
Casting and lining materials consist of silica sand and bentonite binder, mixed with a little water. The support materials are used containers (of slightly larger size) and pattern
material made of wood. Production of stainless steels requires a neutral environment, and this calls for an alumina (Al2O3) lining material used with a specific
type of a ramming binder.
Processing materials
The materials used in the alloying process were feldspar and chalk. Feldspar was used in order to separate slack or impurity from the austenite stainless steel ingots (main material). Chalk functions to impede the flow of oxygen from the atmosphere to prevent oxidation to occur. This way the alloying procedure could proceed unhindered. Unless these steps were carried out, the raw components would simply coagulate and the resulting steel would not have a homogenous composition.
Table 1. Specification of the raw materials used to build the austenite stainless steel (w %)
Fe Ni Cr Mn Si C Al S P Ti
Fe scrap (LC)
99.17 - 0.49 0.3 0.03 - - - 0.001
Ni - 99.99 - - - -
FeCr (LC) 28.486 70.46 - 0.94 0.073 - 0.01 0.03 0.004
FeMn(MC) 23.044 - 75.0 0.52 1.3 - 0.006 0.13 -
FeSi (LC) 24.714 - - 75.0 0.118 0.14 0.023 0.005 0.015
Equipment
A thermal-induction furnace made in cooperation with Bandung Institute of Technology is the main alloying furnace used in this work. This furnace melted the raw materials by vibrations generated via electromagnetic wave. A sigmat and
the Shimadzu X-ray diffractometer XD-610. Elemental composition profile was obtained with a 1996 Swiss made optical emission
spectrometry (OES) in Bandung
Manufacture Polytechnique.
Methods
After the fractional quantities of each constituent component from the base materials had been computed, an appropriate amount of these base materials were weighed separately on the micro scale. Meanwhile, a mould made of silica-sand was simultaneously constructed by mixing a bentonite binder with a little bit water. The finished mould must now be lined-up with a certain choice of material depending on the appropriate acid-, base- or neutral environment. A neutral type lining is standard requirement if the desired product is stainless alloy. As a final step, the lining wall is now sintered. Production of stainless steels requires a neutral environment, and this calls for an alumina (Al2O3) lining
material used with a specific type of ramming binder.
For the microstructural investigation a standard procedure was followed [9]. The
characterization is accomplished using an optical microscope and a SEM microscope with EDS. The crystalline space group is verified by collecting reflection intensities using an x-ray diffractometer. Meanwhile density measurement was carried out using a sigmat and microbalance and the
hardness testing was carried out using the Vickers indentation method. Optical Emission Spectrometry (OES) equipment was employed in the elemental composition measurement, and the sample is specially prepared by spark erosion method to have a dimension of 2.5 x 2.5 x 12 cm3.
RESULTS AND DISCUSSION
The density data measurement of non standard austenitic of the second sequence, A2, was carried out; the results are spread of some density data that is shown in Figure 1. It is expectable that the average density value shown by the line in Figure 1 is close to 7.8 g cm-3.
The results of Vickers hardness tests on both the original cast or pre-normalization and post normalization treatment foundry-alloyed samples are shown in Figure 2; in this experiment, the indentation was carried out at ten separate points with an equidistantly spaced (5.0 mm) distribution. The average value of the observed hardness is 585 on the Vickers scale for original casting sample; this means that the material’s hardness is still very high and needs to be lowered to the normal
Fig. 1. Spread of some density data of second sequence non standard austenitic, A2; the line shows the density average value.
Fig. 2. A2 Vickers hardness number; Ho
and H1 symbols show material
hardness before and after normalization treatment espectively the lines show theaverage material hardness value.
The results of Vickers hardness tests on both the original cast or pre-normalization and post normalization treatment foundry-alloyed samples are shown in Figure 2; in this experiment, the indentation was carried out at ten separate points with an equidistantly spaced (5.0 mm) distribution. The average value of the observed hardness is 585 on the Vickers
scale for original casting sample; this means that the material’s hardness is still very high and needs to be lowered to the normal
value by normalization treatment, it is expected that with decreasing hardness, the ductility would also increase. In Figure 4 the average hardness value of normalized austenite stainless-steels is also shown to be in the range of 460 on the Vickers scale.
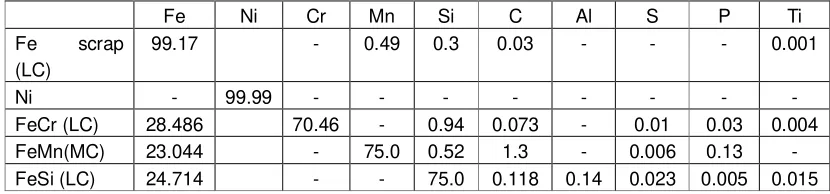
a B
Fig 3. a. Original austenitic optical micrograph. It seems a dendritic pattern has developed in the surfaces microstructure. b. Another austenitic optical micrograph, using a different magnification. As well as usual in dendritic structure, it seems that the grain boundary pattern in the picture is not well defined or not quite sharp.
The microgram in Figure 3a shows the result of micro structural characterization. In the microgram, it is
evident that the alloying process does produce a stainless austenite, after etching using an oxalate reagent, showing a 7
7.2 7.4 7.6 7.8 8
1 2 3 4 5 6
Sample number
D
en
si
ty
(g
cm
-3 )
160 240 320 400 480 560 640
0 10 20 30 40 50
d (mm)
V
H
N
relatively homogenous surface micro stucture of the dendritic type [10,11]. Because
of the relatively even distribution of the alloys homogenity, the grain-boundaries appear to be diffuse. A similar microstructure pattern but with a different magnification is shown in Figure 3b. Also here the grain boundaries appear to be diffuse and generally difficult to detect.
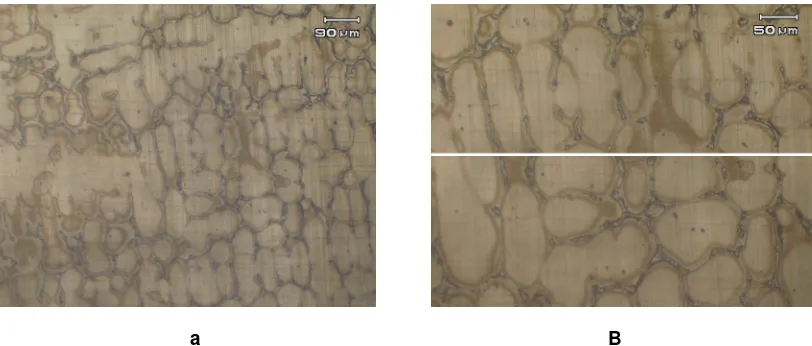
Normally, foundry-made alloys are characterized by a relatively high hardness value; therefore the hardness should be lowered. This is achieved by the so called normalization process by heating it to 600 oC
for 6 hours. Post- normalization optical microgram of the sample's microstructure is shown in Figure 4. In this microgram, the structure pattern of the surface is still dendritic, and grain-boundaries is not well-defined or quite sharp. But from the hardness measurement by Vickers method, the hardness number is decrease and this is allucidated by Figure 4 above.
SEM microgram obtained from microstructure analysis of the normalized sample A2 austenite steels is shown in
Figure 5. It shows a relatively homogenous surface with a few small black spots spread out at the top and bottom part, and no grain boundaries are visible; EDS results shown in Figure 5b is clearly indicating a close relationship between the sample’s condition with respect to the elemental map and the OES (opticalemission spectrometry) results, which generally fits with the elemental compositionof bulk region.
The Rietveld analysis results of the diffraction intensity pattern from step-counting x-ray measurement are shown in Figure 6; the refinement results are almost equal to the manual analysis results [3], and
some crystal parameters calculated by Rietan are listed in Table 2. The good fit of the Rietveld refinement with the experimental diffraction intensity shows that the cubic Fm3m space group chosen for this sample is correct and therefore confirms fcc-crystallographic model of the austenitic phase of this self-prepared sample. Therefore this research group is successful in developing samples of its own design.
a
b
Fig5. a. SEM micrograph of non standard second series austenitic steel surface it is clearly shown that the surface is relatively homogenous b. EDS results from a wide area covering almost whole part of the picture plane; the limiting line shows the covered area where EDS was put/run
-15 35 85 135 185 235 285
40 50 60 70 80 90 100
2 (degree)
In
te
n
s
it
y
(
s
.u
.)
calculated observed diff= |observed-calculated| peak-positions
Fig. 6. X-ray reflection intensity of the sample code-named A2, produced by foundry method. The reflection peaks fit to the fcc crystallographic model confirming the sample’s austenite class.
From the resulting pattern, it could be concluded that by a simple manual analysis there is a proven resemblance between the step counting pattern and the continous counting pattern. The lattice parameters match each other for the first two digits.
The Optical Emission Spectrometry (OES) instrument operating on the basis of the spark erosion method has been utilized
could be explained from the fact, that the raw-material's specification do mention that those impurities are present in the materials. Results presented in Table 3 show that the computed and the experimental OES elemental composition values quantitatively differ from each other. Firstly, this is caused by the basic (raw) material it self. The raw materials (chemicals) used in this work are original minerals acquired from Indonesian mines, and in this case the specific elemental composition information is provided by the supplier. Although this specific information is reliable, some criticism is due, mainly because these minerals are mined directly from the interior of the earth the specific information supplied is mainly statistical in nature. Therefore it is understandable that any specific information so provided, contains some deviations or standard deviations from the actual data. So it is understood, that academically some of the elemental composition values are actually either higher or lower than those values indicated in the spec-sheet. The second factor is attributed to the limitation in the instrumental accuracy. Also, the basic operational characteristic of the OES which is based upon the spark erosion process is a contributing factor. The third factor comes
from the sample itself. The bulk sample does not necessarily have a clean surface, since many additional elements originating from the air outside the sample and considered to be non-ideal external addition, may contaminate the bulky sample during the cooling process. OES based result for example, shows that chrome and silicon, manganese, carbon are present in the far lower quantity the specifically designed composition, whereas, and titanium are present in the quantity exceed than the amounts specified. In particular, the quantity of silicon present could be attributed to statistical deviation from the basic-materials specification; on the other hand this could also arise from the fact that the tested sample's surface is not sufficiently sterile, for example the presence of silicon carbide in the slag material could significantly affect the amount of silicon in the sample. Other impurities are also present, such as vanadium, stannum, phospor and sulphur. The presence of negligible amount of unwanted impurities such as vanadium phosphor and sulphur is of very serious concern. Stannum itself may even help to improve the mechanical properties of the sample, such as forming- and machine ability.
Tabel 2. Some of Rietveld analysis results
Rwp Rp RE RI Lattice Par. (Å) Debye Temp.
Factor Density (gcm-3)
17,67 17,03 13,61 20,89 3,564± 2.66687E-03 3.05 x 10⁻⁵ 7.81
Tabel 3. Comparison of the computed elemental composition and the actual OES measured composition in foundry-cast austenite stainless steel in weight percent (w. %).
Composition Fe Ni Cr Si Mn C Ti V Sn P S
designed 57.5 23.0 16.0 1.5 1.5
0.5 - - - - -
OES results 57.7
CONCLUSION
Based upon the deep and broad analysis of experimental data presented, it is concluded that the new austenitic alloy produced in this work fits in with the stainless steel category of low carbon alloys. This new type of alloy has been shown to be both of the high-temperature type – and corrosion resistant, because of its high nickel and chrome contents, with only a small quantity of silicon, manganese and carbon. Both the steels fcc crystallographic system and its high nickel content indicate that this new steel is an austenite class low carbon steel. The hardness measurement data show that the ingots Vickers-scale hardness before homogenization is relatively high. The average hardness value of
normalized austenite stainless-steels has been measured to be in the range of 460 on the Vickers scale, meanwhile the average density value is close to 7.8 g cm-1. The
experimental fractional elemental composition data acquired by OES method turn out to differ slightly from the theoretical assumption.
ACKNOWLEDGEMENT
The authors would like to express his gratitude to Mr. Iman Kuntoro, head of PTBIN-BATAN, for his continuing valuable support for this research project in the fiscal year of 2008 and the conducive research climate, which facilitates both the continuation and the finishing of this programme at PTBIN-BATAN. The authors also wish to thank Prof. Yuswono from Research Centre for Metallurgy of the Indonesian Institute of Sciences (P2M-LIPI) for his valuable cooperation, in particular in the alloying work using the foundry method.
REFERENCES
[1]. NURDIN EFFENDI. (2010). Urania, Jurnal Ilmiah Daur Bahan Bakar Nuklir, PTBIN-BATAN, 16 (2) 69 – 77.
[2]. HEYNNE. (1964) Principles of Metal Castings, Penton Publishing Co.,Cleveland.
b. Manual Prosedur Standar Operasi Pengecoran. (1982) Puslit Metallurgi LIPI.
[3]. NURDIN EFFENDI, AZIS K. JAHJA,YUSWONO, and SAIFUDIN. (2008). Metalurgi. Majalah Ilmu dan Teknologi, Puslit Metallurgi-LIPI: 23 (2), 107 – 113.
[4]. NURDIN EFFENDI, YUSWONO, SAEFUDIN and A. K. JAHJA. (2007). Metalurgi. Majalah Ilmu dan Teknologi, PuslitMetallurgi-LIPI: 22 (2), 3 – 14. [5]. GASKELL, D. R.. (1981). Introduction to
Metallurgical Thermodynamic, 2nd
edition, Chapters 11 and 12, McGraw- Hill, New York.
[6]. HILLERT, M. (1975). The uses of Gibbs free energy-composition diagrams in: Lectures on the Theory of Phase
Transformations, ed. H.I. Aaronson,
American Institute of Mining, Metallurgical and Petroleum engineers. [7]. ANONYMOUS. (1992). ASM
HANDBOOK vol. 2. Properties and Selection: Nonferroes Alloys, and Special Purpose Materials, tenth edition.
[8]. ROY A. LINBERG. (1982). Process and Materials Manufacture, Prentice Hall of India, Private Limited, New Delhi 110001.
[9]. J. GOODHEW. (1973). Specimen
Preparation In Materials Science, North
[10]. M. PAES, E.G. SANTOS, E.J. ZOQUI. (2006). Obtentin rheocast structure for Al-4.5w% Cu alloy comparison ultra refining and
electromagnetic stirring. JAMME,
Journal of Achievements in Materials and Manufacturing Engineering, 19 (2).
[11]. D. MA., M. MEYER TER VEHN, P.
BUSSE and P.R. SAHM. (1992). Journal De Physique IV, Colloque C7, supplement au Journal de Physique III, Vol. 3, Nov.