The Performance of Transportation Projects Funded By Foreign Loan in Indonesia (2006-2010)
Leksmono S. Putranto1, Yudi Karyana2, Tory Damantoro3
and Madyaswanto Wicaksono4
1
Senior Lecturer, Department of Civil Engineering, Tarumanagara University, Jl. Let.Jen. S. Parman No.1, Jakarta 11440, Indonesia, E-mail: [email protected]
2
Civil Engineering Consultant, Jakarta, Indonesia, E-mail: yudik_soebartomo@ yahoo.co.id
3
Student, University of Southern California, USA, E-mail: [email protected]
4
Civil Engineering Consultant, Jakarta, Indonesia, E-mail: [email protected]
Abstract
Many Indonesian transportation projects was funded by foreign loans, e.g. projects in Ministry of Transport and Ministry of Public Works. The data used were from Indonesian National Development Planning Agency quarterly report (2006-2010). Descriptive statistics analysis was conducted to the progress variant for each directorate generals. Some t-tests were done to obtain whether in the observation period the mean progress variant for each directorate general was indicating serious delay. Serious delay projects characteristics was mapped. The percentage of serious delay worsened between 2006-2009. Overall serious delay rate was 39%. In general, serious delay occurance started when elapsed time reach 30-40%.
Key Words: transportation project performance, foreign loan, Indonesia, progress variant
Introduction
expenditure is devoted to transport infrastructure investment. As in many others developing countries, substantial number of projects in Indonesia was funded by foreign loans. On going foreign loans projects upto September 2010 include 180 projects with total amount almost USD 23,000,000,000. In terms of amount of loan, the highest percentage of loans were provided by JICA (more than 38 percent), followed by World Bank (almost 24 percent).
Transportation projects include mainly projects in Ministry of Transport and some projects in Ministry of Public Works. This is due split of responsibility for handling highways between Directorate General of Land Transport of Ministry of Transport for providing public transport, road signing/ marking and Directorate General of Highways of Ministry of Public Works for building roads. However within observation period (2006-2010) there was no foreign loan for Directorate General of Land Transport. Other directorate generals in Minsitry of Transport includes Directorate General of Railways, Directorate General of Air Transport and Directorate of Sea Transport. It should be noted that in land water ways transport and ferry transport are the responsibility of Directorate General of Land Transport. Other units included in Ministry of Transport is Transport Education and Traning Center and Search and Rescue Agency.
Besides numerical data, there were some qualittive data provided to list the possible cause of non-performing loan, e.g. delay in procurement of goods and services, delay on issuing no objection letter from lenders, delay on national budgetting process, weakness in management in coordination especially related to local government, delay in land acquisition and backlog of disbursement due to administrative defficiencies.
Literature Review
Putranto and Karyana (2011) conducted a study on Evaluation of Performance of Indonesian Foreign Loan Projects by Executing Agency. The study was funded by the National Development Planning Agency of Indonesia. One of the sources of data were filled questionnaires to the representatives from related directorate generals who attend the regular loan progress meeting conducted by the National Development Planning Agency of Indonesia. In the questionnaire following questions were asked, i.e. respondent identity, legal aspects, institutional aspects, procurement and management aspects and project tiypes and lender aspects. Legal aspects include understanding and usage of Government Regulation No. 11/2011 (and its older version No. 2/2006) on Procedures of Foreign Loans and Grants, Ministry of Finance Regulation No. 207/PMK.05/2008 on Procedures of Foreign Loans and Grants Disbursement to be Channeled to State Owned Enterprises and Local Government, National Development Planning Agency Regulation No. PER. 005/M.PPN/06/2006 on Procedures of Planning, Proposing and Evaluating Projects fuded by Foregin Loans and Grants and Government Regulation No. 39/ 2006 on Procedures Control and Evaluation on Development Planning, and other regulation regarding foreign loan valid in each ministries and directorate generals. Institutional aspects include preparedness of projects and coordination between institution. The main results from the questionnaires were as follow:
Executing agencies understood clearly all law and regulations regarding foreign loan projects. However in the execution of the project there were some obstacles especially related to the lender guidlines. According to the respondents, the availability of internal regulation would help to improve the performance of foreign loan projects.
Quality at entry (project preparation) and coordination between executing agencies, Ministry of Finance, National Development Planning Agency and lenders would substancially affect the achievement of disbursement target.
Based on their evaluation of 29 executing agencies (in ministry level) using quarterly reports provided by the National Development Planning Agency of Indonesia from 2006 to 2010 (5 years), Putranto and Karyana (2011) also found that:
of sufficent number of officers capable for managing the foreign loan projects). On the contrary there were several executing agencies with N<100 had positive mean of progress variant.
2. Although there were some variations, in general mean of progress variant in each executing agencies tended to get worse during observation period (2006-2010).
3. The highest percentage of problems faced in foreign loan projects were on quality at entry (project preparation) aspect and project execution aspect both based executing agencies and lenders.
4. Point number 3. would clearly indicated in lenders with large proportion of loaan such as World Bank, ADB and JICA and executing agencies with large number of foreign loan projects such as Ministry of Transportation, Ministry of Public Work and National Electricity Company.
5. In project preparation aspect there were two importan sub aspects, i.e. administration preparedness and coordination both based on lenders and executing agencies.
6. In project execution aspect there were three important sub aspects, i.e. funding, administration and technical
7. The results from the questionnaires analysis were similar with the results from quarterly report analysis. This indicates that the quartely report was a valid instrument to identify problems related to foreign loan projects.
8. Relationship between mean of progress variant with ratio between number of problems and N was not quite strong.
Methodology
In this paper, Quarterly Report on the Performance of Foreign Loan Projects prepared by the National Development Planning Agency of Indonesia from 2006 to 2010 (5 years) is used. The differences between the present paper with Putranto and Karyana (2011) were as follow:
Present paper used directorate general level as basis for analysis whilst Putranto and Karyana (2011) used ministry level as basis for analysis
Present paper includes only tranpsort related directorate generals whilst Putranto and Karyana (2011) used all data available in the quarterly report.
Other data available are total amount of loan, cummulative disbursement in currency and in percentage and the remaining loan. The performances of transportation projects in different directorate generals were varied. The main performance indicator is called progress variant (PV). PV measures the percentage difference between cumulative disbursement (from net loan amount) and the % of elapsed time. If the value is less than -30 percent, the National Development Planning Agency of Indonesia categories the project in serious delay.
Descriptive statistics analysis was conducted, including calculation of mean, standard deviation, minimum value and maximum value of progress variant for each directorate generals/ agencies if aggregated for 5 years observation period (2006-2010). The 5 years aggregation might be debatable since during observation period there were various possibility of project start and project end, i.e.:
Project started and ended within the observation period.
Project started within the observation period but ended outside the observation period
Project strated outside the observation period but ended within the observation period
However, this was just to describe the data in generall and in sumary.
As already understood mean is a central tendency measure and therefore only a single value which need additioinal informationi to discribe the distribution. The information regarding the distribution can be provided by the standard deviation which basically a square of mean deviation between each data points with their mean.
Besides using standard deviation, data distribution can also be described by minimum and maximum values of the data set. Mean, standard deviation, minimum value and maximum value can be affected by number of data (N). In this case N was not the number of projects, because there were projects with moere than one quarter duration. In brief, N was the number of projects multiply number of quarters in which the project conducted. Therefore the information regarding N would also provided.
Besides descriptive statistics, some inferensial statistics were carried out, i.e. t-test to obtain whether in the observation period the mean progress variant for each directorate general was statistically different with -30 percent as the serious delay criteria. A 0.05 significant level was used.
whether project scale in terms of total loan affect the peformance of foreign loan projects.
Analysis
Table 1. summarizes descriptive statistics for six directorate generals and agencies, who were working partners of Directorate of Transportation of the National Development Planning Agency. It can be seen that in terms of Mean PV Directorate General of Air Transport performance was the best compare to the other five directorate generals/ agencies. However, the distribution of the PV in this Directorate General was quite wide spread as indicated by its highest standard deviation.
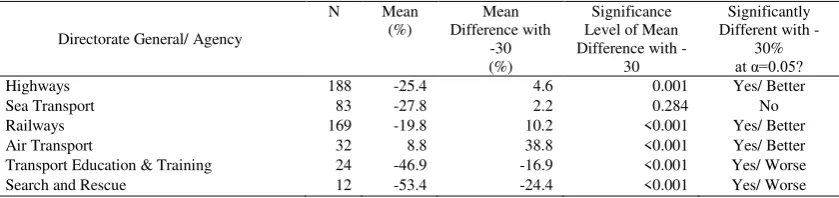
Table 2 shows the results of t-test of mean PV difference with -30% (serious delay). The results imply that Directorate Generals of Highways, Railways dan Air Transport were significantly different and higher than -30%. Therefore these three directorate generals were relatively safe from serious delay. Mean PV of Directorate Genaral of Sea Transport was only marginally higher than -30% and therefore can be considered in the serious delay category along with Transport Education and Training Agency and Search and Rescue Agency.
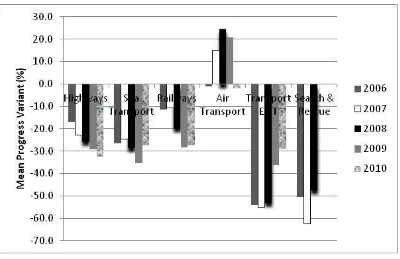
Figure 1 shows the time series chart of Mean PV from 2006 to 2010 for each directorate general/ agency. For Directorate Generals of Highways and Railways the trend was getting worse whilst for Directorate General of Air Transport and Transport Education & Training Agency the trend of mean PV was getting better.
The mean PV’s of Directorate General of Railways and Search & Rescue Agency
were relatively constant.
Table 1. Desciptive Statistics Summary of Mean PV of Six Directorate Generals/ Agencies
Directorate General/ Agency
N Mean of PV (%)
Standard Deviation of PV
(%)
Minimum PV (%)
Maximum PV (%)
Highways 188 -25.4 18.0 -67.3 8.5
Sea Transport 83 -27.8 18.8 -62.7 24.7
Railways 169 -19.8 24.9 -83.6 26.1
Air Transport 32 8.8 25.5 -39.4 43.1
Education & Training 24 -46.9 13.5 -64.6 -26.1
Search and Rescue 12 -53.4 10.2 -67.6 -34.5
Table 2. T-test results of mean pv difference with serious delay (PV=-30%)
Directorate General/ Agency
N Mean (%) Mean Difference with -30 (%) Significance Level of Mean Difference with
-30
Significantly Different with
-30% at α=0.05?
Highways 188 -25.4 4.6 0.001 Yes/ Better
Sea Transport 83 -27.8 2.2 0.284 No
Railways 169 -19.8 10.2 <0.001 Yes/ Better
Air Transport 32 8.8 38.8 <0.001 Yes/ Better
Table 3 shows the summary of number of serious delay occurence between 2010. It can be seen that percentage of seious delay was getting worse between 2006-2009 and slightly getting better in 2010. The overall rate of serious delay between 2006-2010 was 39%.
Figure 1. Mean progress variant from 2006 to 2010
Table 3.Serious delay occurrence
Year N
No. Of Serious Delay
% of Serious Delay
2006 125 40 32
2007 100 34 34
2008 96 42 44
2009 96 45 47
2010 91 39 43
Total 508 200 39
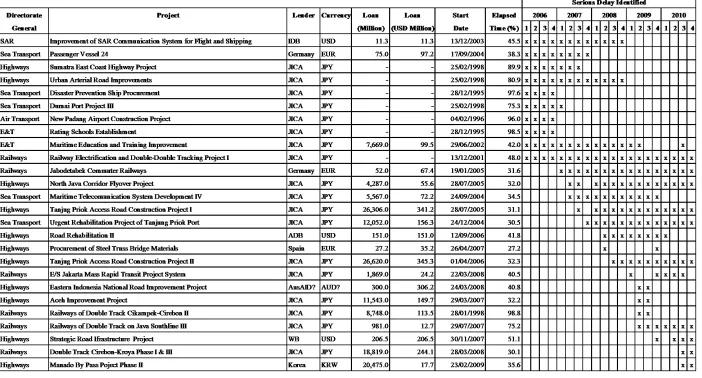
followed by Directorate General of Railways (6 projects), Directorate General of Sea Transport (5 projects), Transport Education and Training Agency (2 projects), Directorate General of Air Transport and Search & Rescue Agency (each 1 project). These statistics were proportional to the N of each Directorate Generals and Agencies, implying that the larger the number of projects in a working unit, the higher the probability of serious delay occurence due to the wider span of control. Most of the projects were infrastructure development (11 projects), followed by infrastructure improvement (8 projects), system development (4 projects) and procurement (3 projects). Most of the projects were funded by JICA (18 projects), followed by Germany (2 projects) and each 1 project funded by IDB, ADB, Spain, World Bank, AusAID and Korea.
Occurance of serious delay tend to start when elapsed time reach 30-40% except for certain cases on railway double tracking of Cikampek-Cirebon II (98.8%), railway double tracking of Java South Line III (75.2%) and Strategic Road Infrastructure Project (51.1%). Occurance of serious delays on projects identified at first quarter of 2006 were not considered as first occurance as it might be happened before observation period of 2006-2010. The total loan for each project ranged between 11.3 million USD and 345.3 million USD. There was no relationship found between total loan of each project and its progress variant.
Conclusion
From the analysis in this paper, several conclusions can be provided as follows:
b. Between 2006-2010, in terms of trend of mean progress variant, Directorate Generals of Highways and Railways was getting worse whilst for Directorate General of Air Transport and Transport Education & Training
Agency the was getting better. The mean PV’s of Directorate General of
Railways and Search & Rescue Agency were relatively constant.
c. The percentage of seious delay was getting worse between 2006-2009 and slightly getting better in 2010. The overall rate of serious delay between 2006-2010 was 39%.
d. The larger the number of projects in a working unit, the higher the probability of serious delay occurence due to the wider span of control. However, there was no relationship found between total loan of each project and its progress variant.
e. In general, occurance of serious delay tend to start when elapsed time reach 30-40%.
References
_____ (2006). Quarterly Report on the Performance of Foreign Loan Projects Budget Year 2006 (Quarters I to IV). Jakarta: The National Development Planning Agency of Indonesia.
_____ (2007). Quarterly Report on the Performance of Foreign Loan Projects Budget Year 2007 (Quarters I to IV). Jakarta: The National Development Planning Agency of Indonesia.
_____ (2008). Quarterly Report on the Performance of Foreign Loan Projects Budget Year 2008 (Quarters I to IV). Jakarta: The National Development Planning Agency of Indonesia.
_____ (2009). Quarterly Report on the Performance of Foreign Loan Projects Budget Year 2009 (Quarters I to IV). Jakarta: The National Development Planning Agency of Indonesia.
_____ (2010). Quarterly Report on the Performance of Foreign Loan Projects Budget Year 2010 (Quarters I to IV). Jakarta: The National Development Planning Agency of Indonesia.
Button, K. (1993). Transport Economics, 2nd ed. Aldershot: Elgar.
Government Regulation No. 2/2006 on Procedures of Foreign Loans and Grants.
Government Regulation No. 39/ 2006 on Procedures Control and Evaluation on Development Planning.
Ministry of Finance Regulation No. 207/PMK.05/2008 on Procedures of Foreign Loans and Grants Disbursement to be Channeled to State Owned Enterprises and Local Government.
National Development Planning Agency Regulation No. PER. 005/M.PPN/06/2006 on Procedures of Planning, Proposing and Evaluating Projects fuded by Foregin Loans and Grants