The Effectiveness of Graphic Organizers to Increase Students’ Vocabulary
Mastery of Grade Seven of SMPN 13 Students Mataram Academic Year
2014/2015
Ni Nyoman Mira Astarini
E1D110076
ABSTRACT
This study aimed at investigating the effectiveness of graphic organizers to increase students’ vocabulary mastery of grade seven of SMPN 13 students Mataram academic year 2014/2015. This research was conducted toward the seventh grader of junior high school students in the first semester. The researcher used random sampling technique. Seventh grader students of SMPN 13 Mataram were 300 students and the researcher took 25% of 300 students, 70 students participated in this study and became two classes (experimental group and control group) and two classes consisting of 35 students. The graphic organizers strategy was applied in experimental group as the treatment while control group was taught the same vocabulary items using traditional instruction, which is all students, were taught all the vocabulary items and their meanings in the first language, and they were encouraged to use dictionaries. The total score of pre-test and post-test from experimental group was 2705 and 2825, and the total score of pre-test and post-test from experimental group was 2685 and 3045. The mean score for control group was 3,43 and the mean score for experimental group was 9,57. The value of t-test after the data calculated ion the formula was 3,09 and higher than the critical of the t-table at the confidence level of .05 (95%) with 2,03 and .01 (99%) equals to 2,72 in degree of freedom 35. Therefore, Ho is rejected, and Ha which states “the use of graphic organizers strategy in increasing students’ vocabulary” is accepted.
The Effectiveness of Graphic Organizers to Increase Students’ Vocabulary
Mastery of Grade Seven of SMPN 13 Students Mataram Academic Year
2014/2015
Ni Nyoman Mira Astarini
E1D110076
ABSTRAK
Penelitian ini bertujuan mengetahui efek dari grafik organizer untuk meningkatkan kemampuan siswa SMPN 13 Mataram kelas tujuh tahun ajaran 2014/2015 dalam menguasai kosakata. Penelitian ini lebih ditujukan pada murid kelas tujuh SMP pada semester pertama. Peneliti menggunakan teknik pengambilan contoh acak. Murid kelas tujuh dari SMPN 13 Mataram keseluruhan berjumlah 300 murid dan peneliti mengambil 25% dari 300 murid, 70 murid berpartisipasi dalam penelitian ini dan 70 murid dibagi menjadi dua kelas (grup eksperimental dan grup control) dan pada dua kelas, masing-masing kelas terdiri dari 35 murid. Strategi grafik organizer diterapkan pada grup eksperimental sebagai perlakuan sementara grup control telah diajarkan kosakata yang sama menggunakan instruksi tradisional, dimana seluruh murid diajarkan seluruh kosakata beserta artinya pada bahasa pertama, dan mereka dianjurkan untuk menggunakan kamus. Nilai total sebelum menguji dan setelah menguji pada grup control adalah 2705 dan 2815, dan nilai total sebelum menguji dans etelah menguji pada grup eksperimental adalah 2687 dan 3045. Nilai rata-rata untuk grup control adalah 3,43 dan nilai rata-rata untuk grup eksperimental adalah 9,57. Nilai dari t-test setelah menghitung data sesuai rumus adalah 3,09 dan lebih tinggi dari kekritisan dari t-table pada tingkat kepercayaan .05 (95%) dengan 2,03 dan .01 (99%) setara dengan 2,72 pada tingkat kebebasan 35. Maka dari itu, Ho ditolak dan Ha yang mengatakan “Penggunaan strategi grafik organizer dalam meningkatkan kosakata murid” diterima.
The Effectiveness of Graphic Organizers to Increase Students’ Vocabulary Mastery of Grade Seven of SMPN 13 Students Mataram Academic Year 2014/2015
Ni Nyoman Mira Astarini
E1D110076
A Journal
One of the major problems most
Indonesian students have when they
read any texts in English language is
the lack of vocabulary knowledge or
unknown words. Therefore, the
students begin to be panic and stop
reading then open their dictionary
and find out what the meaning of
some words they do not understand,
unfamiliar or new words. Many
students admit that sometimes they
do not understand what they are
reading because the words are too
difficult. This does not only happen
in reading but also in other skills
such as speaking, writing, and
listening.
The purpose of this study is to
examine the effect of the graphic organizer strategy on students’
vocabulary mastery. Learning
vocabulary can be rewarding, but I
observe many students feeling
frustrated and anxious about
beginning to study vocabulary. As a
student matures in age and move
through the grades the complexity of
vocabulary learning becomes more
and more prevalent. Students are
required to understand more and
more words that might seem
rudimentary to their teacher but
foreign to them. Another students’
problem of learning vocabulary are
they have heard of it [the word]
before but they do not know what it
means.
What students can do to
improve vocabulary mastery?
According to Novak (1991), graphic
meaningful-mode learning patterns.
Perhaps by using graphic organizers
in classroom where I taught, the students’ vocabulary will
significantly improve because I
assume that graphic organizers is one
way to explain how to categorize
word meanings which make it easier
to visualize the meanings of the
words.
The design of this research is
experimental research. Experimental
research is a research where the investigator
deliberately controls and manipulates the
condition which determines the events in
which he/she is interested
in,(Yusra,2006).Random sampling was used
as the design of this research by rearranges
the existing classes. This design chooses
pre-test and post-test as a group comparison.
In this design the observation took two
research was conducted toward the seventh
grader of junior school students in the first
semester. There were seven classes for
seventh grader from A to H, the total is
about 280 students, the total students that
involve in this research are 70 students and
According to Arikunto (1992: 134) if
the number of population is less than one
hundred, it is better to take all of the number
of population. However, if the number of
population is more than one hundred, it is
suggested to take 10%-15% or 20%-25%. In
this research, the researcher used random
researcher took 25% of 300 students became
two classes and two classes consisting of 35
students.
The techniquein collecting the data
by using vocabulary test: The test was done
before the treatment (pre-test) and after
treatment (post-test). Consider the following
explanation:
a. Pre-test
In this step, students of both classes were
given the pre-test on their vocabulary
knowledge before the study began. The kind
of test given to the students was objective
test (15 multiple choices and 2 essay). The
A section is multiple choice and B section is
essay, the score for A section is 15 and B
section is 10.
b. Treatment
- Experimental group:The
experimental group students
were given the first several
sessions to train them vocabulary
through the use of graphic
organizer strategy following two
steps; presentation and practice.
In the presentation step: Graphic
Organizers was introduced to
students like a normal classroom
lesson plan, with the researcher
showed them the different kind
features, the advantages of
Graphic Organizers and creating
Graphic Organizers. In the
practice step: the researcher
guided the students to apply what
they learned inside and outside
classroom to cover all the
vocabulary items in the whole
study material. The researcher
gave paper with blank column
graphic organizer is more visual,
the students were ask to draw
something and mention words
around and make a sentence base
on what they were draw.
- Control group: All students of
the control group were taught all
the vocabulary items and their
meanings in the first language as
they appear in the different units
and in the wordlist. Students
were also asked to study those
items outside the class. In
addition, they were encouraged
to use English-Indonesian
dictionaries but without any kind
of training. They were allowed to
ask and consult the researcher
treatment. In order to guarantee the students
seriousness the researcher told them that all
the tests would be part of the requirements
of the class work mark.
To answer the first question of the
Organizers has an effect on students’
vocabulary, the researcher can find out the
mean of pre-test and post-test and use a
formula as follows:
a. Formulation the mean scores of
group X:
=
Notes:
=
the mean score of dx=the total sum of the deviation
of individual scores of experimental
group
= the number of samples of experimental
group
b. Formulation the mean scores of
group Y:
=
Notes:
=
the mean score of dy=the total sum of the deviation
of individual scores of control group
= the number of samples of control
group
c. Calculate the degree of difference between the two groups of scores, ttest, and df
t
test=
=
d
x=
d
y=
df = ( Nx + Ny ) -2
ttest= the degree of differences
∑dx = the total sum of the deviation
of individual scores of experimental
group
∑dy = the total sum of the deviation
Nx = the number of samples of
experimental group
Ny = the number of samples of
control group
= the mean score of dx
= the mean score of dy
= Degree of freedom
(Yusra,2009)
This is the formula to test hypothesis
1. If t – test ≥ t- table at the confidence level of .05(95%), Ha:”
The effect of using Graphic
Organizers strategy in increasing student’s vocabulary is
“accepted”.
2. If t_ test ≤ t- table at the
confidence level of .05(99%), Ho: “The effect of using Graphic
Organizers strategy is not effective in increasing student’s vocabulary.
The design of this research is
quasi-experimental where vocabulary items were
taught to the experimental group students
using the graphic organizer strategy while
they were taught to the control group
students using the traditional instruction.
The independent variable is graphic
organizer strategy and the dependent
variable is increase students’ vocabulary
mastery. In order to analyst the data of the
research, the researcher usedthe statistical
package to calculate the mean score of both
groups.
After obtaining the student’s
scoresfor both experimental and control
group,then the researcher computed by using
the following formulas:
y = (Σ dy)/Ny = 120/35 = 3,43
x = (Σ dx)/Nx = 335/35 = 9,5
The result of the above computation
is shown in the following table.
After computing the mean score of
analysis by obtaining whether there is a
significance difference between the mean
score of experimental and the control
group by applying the t-test as shown in
the following.
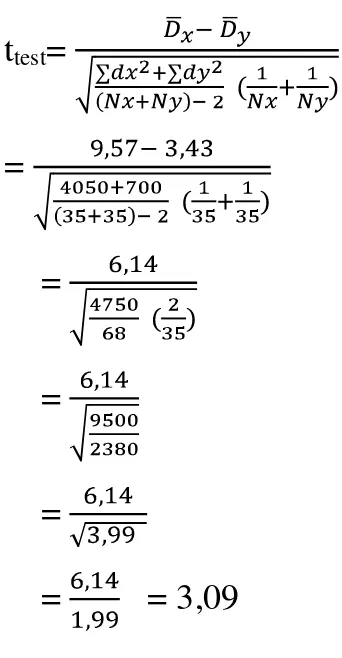
t
test=
=
=
=
=
=
= 3,09
To check the significance in the
t-table it is important to find out the degree of
freedom, by using this formula:
Df = (Nx + Ny) -2
= (35 + 35) –2
= 68
Based on the computation above, it is clear
that the t-test score obtained after diving the
total number of the both groups and the
result of the square deviation is 3,09.
t-test t-table
Df .05 .01 3,09 68 2,03 2,72
Based on the analysis, it can be explained
that the graphic organizer has an effect
towards the 7th grade students at SMPN 13
Mataram in building their vocabularies. It
can be seen from the mean score of
experimental group (9,57) is higher than the
mean score of control group (3,43).It also
shows from the calculation of the t-test of
both groups = 3,09. This was higher than
t-table at the confidence level of .05 (95%)
and .01 (99%).
This higher score could be attributed
to two reasons. First, students learned
vocabulary item they came across; that is
spelling, pronunciation, part of speech,
meaning in the first language, and using it in
a sentence. The second reason might be the
use of the graphic organizer strategy to teach
different vocabulary items. This strategy
might have enabled those students to
visually see all learned features as important
parts of the same vocabulary item that they
were trying to learn. The reason is justified by the notion that today’s students are more
like visual learners who had grown up on
using video games and computers to get new
knowledge while control group were taught
by traditional strategy.
The result data analysis could be
taken by considering statements bellow:
1. If t – test ≥ t- table at the
confidence level of .05(95%), Ha:”
The effect of using Graphic
Organizers strategy in increasing student’s vocabulary is
“accepted”.
2. If t_ test ≤ t- table at the
confidence level of .01(99%), Ho: “The effect of using
Graphic Organizers strategy is not
effective in increasing student’s
vocabulary.
The t-test result (3,09) is higher than
the critical value of t-table at the confidence
level of .05 (95%) with 2,03 and .01 (99%)
equals to 2,72 in degree of freedom (df) 35.
It means that null hypothesis (Ho) is rejected
and alternative hypothesis (Ha) which states “the use of graphic organizers strategy in
increasing student’s vocabulary” is
accepted.
After analyzing the results of this
research, the researcher can conclude that
students show more growth in vocabulary
when using a graphic organizer as a part of
the vocabulary test process. The use of
graphic organizers at the 7thgrade of SMPN
13 Mataram did have a significant influence
Based on the result of statistical
computation in chapter four there is no
significant difference of means score
between experimental group and control group. Even though student’s vocabulary
with graphic organizers, which is
experimental group, gained better
achievement, the other class without
graphic organizers, which is control
group, also gained the score. It is
concluded that the use of graphic
organizer strategy is not really influence the result to increasing students’
vocabulary. This result could be because
the topic when the researcher applied the
graphic organizers in learning process
was easy for students.
The results of the study suggested that the
graphic organizers strategy was more
effective than the traditional instruction in increasing students’ vocabulary. Yet,
the researcher still has some suggestions.
1. For teacher.
Teachers have proven that
graphic organizer can increase students’ vocabulary by
preparing a creative technique,
make complex information and
convert it into a simple and
meaningful graphic organizer.
2. For students
Through graphic organizer, it
is expected that students
participate actively in
classroom activity and able to
write or mention vocabulary
around them to prove that they
learned from graphic
organizer.
3. Future researcher
Another research area of
interest may replicate this
study to increase the sample
size for an extended period of
time, or replicating it with
such as students in elementary
school or junior high school,
and future research should
compare graphic organizers
with different types of graphic
organizers for the same