The Relationship between Job Satisfaction and Organizational Commitment:
Case Study of Employees in PT X
Karina Yoveline
International Business Management Program, Petra Christian University Jl. Siwalankerto 121-131, Surabaya
E-mail: [email protected]
ABSTRACT
Human resource management plays a vital role in a company as it could affect company’s performance. In the last decade, companies are faced with high turnover of Generation Y or Millennial Generation. PT X as a manufacturing company that relies on human capital heavily is in a tight competition with other company. This research is done for the purpose to see whether job satisfaction really has significant correlation with organizational commitment, which may reduce the number of turnover. Data was gathered using simple random sampling by distributing questionnaires to 138 employees in PT X. It was t h e n analyzed by using multiple linear regression. The result shows that the job satisfaction simultaneously has significant correlation with organizational commitment. Meanwhile, as individual dimensions, all but fringe benefit has significant correlation with organizational commitment.
Keywords: human resource management, job satisfaction, organizational commitment.
ABSTRAK
Manajemen sumber daya manusia adalah bagian penting dari perusahaan karena mampu mempengaruhi performa perusahaan. Pada 10 tahun terakhir, banyak perusahaan dihadapkan dengan tingginya angka turnover karyawan Generasi Y or Generasi Millennial. PT X bergerak di bidang manufaktur yang padat karya dan bersaing dengan perusahaan lain dalam mendapatkan kualitas tenaga kerja terbaik. Penelitian ini bertujuan untuk melihat hubungan yang antara kepuasan kerja dan komitmen terhadap organisasi yang mungkin dapat mengurangi angka perputaran karyawan. Pengumpulan data menggunakan simple random sampling dengan mendistribusikan 138 kuesioner kepada karyawan di PT X. Lalu, data akan dianalisis dengan multiple linear regression. Hasil menunjukan bahwa kepuasan kerja memiliki korelasi yang signifikan dengan komitmen terhadap organisasi. Sebagai dimensi individual, semua kepuasan kerja kecuali fringe benefit, memiliki korelasi yang signifikan dengan komitmen terhadap organisasi.
Kata Kunci: sumber daya manusia, kepuasan kerja, komitmen terhadap organisasi.
INTRODUCTION
In organization, stakeholders act as major influencers, whether it is external or internal stakeholders (BBC, n.d.). Attracting and contenting employees, whose loyalty is one of the substantial factors, is equally important as it does to customer (Heskett, Jones, Loveman, Sasser, & Schlesinger, 2008) because profit is what drives company to grow and customer satisfaction primarily helps it to evolve. However, very few realize the effectiveness of it as most companies mainly focus on their customer relationship and satisfaction (Moore, 2012).
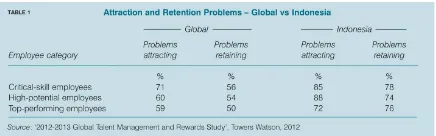
The employee loyalty issue remains as a vexing problem. This statement is made with regards of number representing difficulties in retaining high competency and potential employees with 72 percent out of 1,605 companies from all around the globe (Towers Watson, 2012).
Table 1. Attraction and Retention Problems – Global vs Indonesia
Source: Towers Watson (2013, p. 1)
employees in Indonesia is 78 percent, which is higher by 22 percent than global average (Halim, 2013). This also happens in other employee categories, such as high potential and top performing employees.
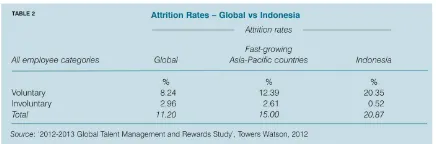
Table 2. Attrition Rates – Global vs Indonesia
Source: Towers Watson (2013, p. 1)
The attrition rates of both voluntary and involuntary turnover in Indonesia are also considered significantly higher than global and fast-growing Asia-Pacific countries rates as displayed in Table 2 (Halim, 2013). Indonesian attrition rates score more than double in voluntary category, meaning the number of employees consciously resign from the company.
Companies are also dealing with the high turnover of Generation Y or Millennials generation, generation born between early 1980s and mid 2000s (The Council of Economic Advisers, 2014). In average 70 percent will only stay in an organization for 2 years and then move to the other organization (Schawbel, 2011). On the other hand, Generation X or Baby Bust generation had significantly lower turnover rate at 22.7 percent in 2010 (Sammer, 2012). Generation X, which is generated as the people born between early 1960s and early 1980s, currently rules most of organization. However, most organizations are now currently focusing in attracting and retaining Generation Y to take over the management in organization (Howe, 2014).
The companies are looking for the best talent to compete in the market. The goal is to get the most benefit from the employees without spending too much on their expenditure. The issue faced is that there are different perspectives on how employer values the total rewards and how employee does (Halim, 2013). This means there is a severe need of improvement to compose efficacious Human Resource Management programs in Indonesia (The Canadian Professional Sales Association, 2006), which aims to reduce the number of problems in both attracting and retaining employees. The reason behind it is because turnovers cost organization fortune for separation cost, replacement cost, training cost, and many more depending on the agreement upon the recruitment (Schawbel, 2011). According to Millenial Branding (2013), the turnover cost of employers due to the high turnover of Generation Y is at the range of $15,000 to $25,000.
According to study conducted by Opkara (2004) and Samad (2007), job satisfaction will positively affect organizational commitment. Employees who are satisfied with their current work environment will be more likely committed with the organization (Nawab & Bhatti, 2011). Al-Hussami (2008) also did a research on the relationship of job satisfaction to organizational commitment, perceived organizational support, transactional leadership, and level of
education. The result suggested that job satisfaction has significant relationship with dependent variable, including loyalty to the company as part of organizational commitment.
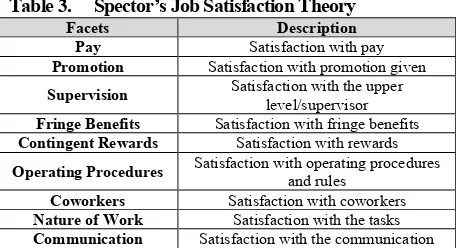
Managing human being is not as easy as managing machines or inventories in a company as every individual has different characteristic, behavior, attitude, and preference. In order to satisfy human beings, there are lots of key factor to be fulfilled and balanced. Bashayreh (2009) stated that individual with job satisfaction shows pleasurable positive attitudes as the result of satisfying job experience. This research will be using Job Satisfaction Survey (JSS) by Spector to measure. JSS divides job satisfaction into 9 categories, which are: pay, promotion, supervision, fringe benefit, contingent rewards, operating procedures, coworkers, nature of work, and communication (Spector, 1997).
PT X as the target and scope for this research is one of the leading Indonesian timber manufacturer and exporter. As it has only been operating for around 3 years, the system of PT X is still not yet well managed. Management succession is the current issue the company faces. Most managerial positions in the company is currently managed by the first generation whose age has almost reached retirement, yet the company still have not prepared with successors who are ready to take over the position. PT X has done several recruitment processes and also trained new employees to have learning process. However, many resigned within 1 to 3 months that might be due to the low job satisfaction.
On the lower level, PT X also faced problem in finding skilled employees (E. Linuar, personal communication, February 22, 2015). Generally, a good company will gradually improve their performance, whether it is in good or service industry. However, this problem created a situation where improvement on production site could not be realized. Many processes in the company are not done effectively and efficiently due to the human error. Factory Manager of PT X believes that high salary and compensation will boost employee performance and in the same time create loyal attitude toward this company or what so called organizational commitment (M. Lim, personal communication, February 15, 2015). However, the year to year production capacity of PT X keep decreasing, meaning there is more than just pay satisfaction that will create loyalty of employees.
Organizational commitment itself can be described as physiological state that serves as the identification and involvement of employee in an organization (Mowday, Steers, & Porter, 1979), which have been said to have effects on triggering employee performance and minimizing employee absenteeism, lateness, and turnover (Meyer, Paunonen, Gellatly, Goffin, & Jackson, 1989; Meyer, Stanley, Herscovitch, & Topolnytsky, 2002).
aims not only to attract people to join the company, yet also to retain them for the long terms.
LITERATURE REVIEW
Link research background with the concepts needed as the backbone of your research. Quote carefully, acknowledge other people's idea appropriately, make sure that the theories are needed to be the backbone of your research. Explain the theoretical framework / relationship between concepts. Describe how the theoretical framework represents your beliefs on how the variables are related to each other. Explain the connectivity between your research with previous research, use the introductory of a journal for the writing style. Those relevant research must be related with your theoretical framework.
In text citation and the following references use APA Citation Style. Please check and carefully cite accordingly.
Job Satisfaction Theories
Job satisfaction as one of the most widely concerned and researched dimensions in business environment (Indermun & SaheedBayat, 2013) is considered as one of the most complex and multifaceted concept in the business world. Job satisfaction is basically a measurement of an individual emotional feeling shaped as response from a job (Weiss, 2002). Locke (1976) defined job satisfaction as a pleasurable emotional state formed by job experiences and become one of the most widely used definitions. Luthans (1998) believed that job satisfaction cannot be seen, but can only be inferred. Looking from these definitions, it could be concluded that job satisfaction is more of internal state associated with personal feeling of achievement.
Having the knowledge to measure the overall level job satisfaction could help organization to have deeper understanding about employee’s information (Roznowski & Hulin, 1992). Leaders, like managers and supervisors, human resource experts, and even employees are in harmony putting efforts to pinpoint how to enhance job satisfaction (Cranny, Smith, & Stone, 1992). George and Jones (2008) define job satisfaction as employees’ feelings and beliefs toward their jobs. The degree of job satisfaction could vary from utmost satisfaction to extreme dissatisfaction.
Table 3. Spector’s Job Satisfaction Theory
Facets Description
Pay Satisfaction with pay
Promotion Satisfaction with promotion given
Supervision Satisfaction with the upper level/supervisor
Fringe Benefits Satisfaction with fringe benefits
Contingent Rewards Satisfaction with rewards
Operating Procedures Satisfaction with operating procedures
and rules
Coworkers Satisfaction with coworkers
Nature of Work Satisfaction with the tasks
Communication Satisfaction with the communication
Pay satisfaction, according to Spector (1997), could be measured using four indicators: fairness, frequency,
appreciation, and chances. Miller (2014) claimed compensation/pay as number one contributor to overall job satisfaction as 60 percent of employees declared that pay is ‘very important’ and the other 36 percent put it as ‘important’ (Miller, 2014). Research shows that there is positive relationship between pay and organizational commitment (Akhtar, 2014). This could clarify that a good compensation can generate significant amount of positive organizational commitment. However, good compensation is relative as Clark and Oswald (1996) stated that employee’s satisfaction is inversely related to their comparison earning level. Even though employee has a considerably high salary within a company, yet one can be dissatisfied when the salary is lower than employee in other company with similar responsibility.
Investopedia (n.d.) defines an employee who gets advancement of rank or position in hierarchical structure will be entitled with new job title, pay increase, and balanced with greater number of responsibilities. The appraisal of promotion satisfaction is developed through these four indicators: fairness, chances, similarity, and contentment (Spector, 1997). Schwarzwald, Koslowsky, and Shalit (1992) held a study to investigate the effect of promotion on behavioral outcome, like commitment to the organization. Their research’s finding emphasized that promotion enhanced performance and consequently affect organizational commitment positively. In their research, it was found that failure to get promotion would result inequity feelings, decrease in commitment, and increase in absenteeism.
According to Spector (1997), to know whether employees are satisfied with the supervision, there are four indicators, which are Competency, Fairness, Affection, and Contentment. Personal trust, respect, and confidence between supervisors and employees could form an effective and sufficient supervision (NYSDOT Training Bureau, 1997). NYSDOT Training Bureau (1997) also argued that good supervision has positive relationship with desire to work. Different situation requires different styles of leadership or approach, which includes vision, communication, and attitude (NYSDOT Training Bureau, 1997). It is also believed that satisfaction with supervision could predict organizational commitment (Lowhorn, 2009). Furthermore, most research indicated that the presence of certain core job dimensions such as positive feedback direct to greater commitment (Hutchinson & Garstka, 1996).
benefit could vary across organization, depending on the organization policy. Spector argued (1997) that there are four indicators to measure, which are contentment, similarity, fairness, and appropriateness. A research suggested that fringe benefit positively influenced organizational commitment (Soon, Lai, Hussin, & Jusoff, 2008). It means the better fringe benefit employee receives, they will most likely more committed to the organization (Khuong & Vu, 2014).
Contingent reward system reinforces positive motivation for a job well done effectively and in timely fashion. Smith (n.d.) also informed that the evaluation and assessment is more frequent than annual performance review and evaluation. Additional information provided by Smith (n.d.) stated that the rewards given must be aligned with employee’s interest in order to attract them. Spector (1997) believed of these four indicators to measure contingent rewards, which are appropriateness, value, contentment, and fairness. Henne and Locke (1985) also confirms that employee wants to be recognized and rewarded for good performance. It increases employee’s job satisfaction. Reward system in private sector is said to have effect on job satisfaction (Getahun, Sims, & Hummer, 2008). The sample items used in Getahun, Sims, and Hummer (2008) research include “recognition depends on a job performed well,” “pay raises depend on performance,” “high performance is recognize and promoted,” and “high performing employees receive non-monetary rewards”.
Operating procedures consists of rules, procedures, regulations, and requirements need to be performed during working time in the working environment (Spector, 1997). Spector (1997) also argued that the appraisal can be done using easiness, limit, amount of work, and amount of paperwork. Interestingly, some research found there is no significant relationship between operating conditions and organizational commitment (Lumley, Coetzeel, Tladinyane, & Ferreira, 2011). It suggests the improvement in operating conditions, such as procedure, rules, etc., does not lift up the organizational commitment at the same time.
Henne and Locke (1985) research findings show that employees like colleagues with similar value and colleagues who facilitate work accomplishment. This argument is also supported by Spector’s (1997) argument believing that coworkers, as part of the working environment, have impact on employee’s level of job satisfaction (Spector, 1997). The indicators of coworkers affecting job satisfaction are: contentment, competency, comfort, and harmony. Research suggests that job satisfaction has relationship with employee’s opportunity to interact with co-workers in their working environment (Mowday & Sutton, 1993), thus the better the relationship is, the greater the level of job satisfaction (Wharton & Baron, 1991). Other research also stated that friendly and supportive coworkers would boost employee’s job satisfaction (Robbins, 2000). The bond between the workers within an organization leads to the enjoyable and effectiveness of job performance. Coworker was proven to have positive relationship with organizational commitment (Suma & Lesha, 2013). Friendship in the workplace is proven to have positive impact in job
satisfaction, job involvement, and most importantly organizational commitment (Luddy, 2005).
Nature of work is simply what the job is. According to Chron (n.d.), nature of work is basically the type of work, basic daily tasks, and non-routine tasks. To measure the satisfaction of this facet, Spector (1997) uses these four indicators: meaning, contentment, pride, and comfort. Several researches have come up to a conclusion that the presence of certain core job dimensions, such as autonomy (Dunham, Grube, & Castaneda, 1994), job challenge (Meyer & Allen, 1997), and variety (Steers, 1977), lead employees to commit more to their respective organizations.
It is obvious that communication is a huge and important issue in the world generally. That is why communication between employees and company is also equally important to maintain harmony within work environment. If company can facilitate a smooth communication with less ambiguity, distortion, and incongruity, employees are more likely satisfied (Robbins S. , 1993). The four appraisal’s indicators according to Spector (1997) are: contentment, comprehensiveness, completeness, and transparency. Communication plays important role in the commitment process as it conveys the important information (Allen, 1992), and positive supervisor–subordinate communication is also often associated with higher level of commitment (Daley, 1988; Lee, 1971).
Organizational Commitment Theories
Indicators used will be obtained from OC Questionnaire composed by Meyer and Allen (1991). The average score of 8 items will be used as the overall dependent variable.
Meyer and Allen (1991) define affective commitment as employee’s affection for their job, meaning the emotional attachment to, identification with, and involvement in an organization. Employees who emotionally dedicated to the organization usually stay because of the common goals and values they possess with the organization. They keep on working in the organization because they personally want to (Meyer & Allen, 1991). Development of affective commitment involves identification with the organization and internalization of organizational principles and standards (Beck & Wilson, 2000).
The Relationship between Job Satisfaction and Organizational Commitment
As seen on the research title, this research aims to analyze whether there is relationship between job satisfaction and organizational commitment. Previous researches have found the significant relationship between these two variables with job satisfaction as the independent variable and organizational commitment as the dependent one. Researches done to various population from municipality employees to information technology employees.
Suma and Lesha (2013) did a descriptive research using survey or questionnaire to Skhodra municipality. There were around 160 survey questionnaires distributed using various methods such as email, in person and post. However, there were only 56 statistically usable questionnaires. The measurements used for job satisfaction and organizational commitment are Job Descriptive Index (JDI) (Smith, Kendall, & Hulin, 1969) and Organizational Commitment Questionnaire (OCQ) (Mowday, Porter, & Steers, 1979) resepectively.
The findings of this research strongly believe that there is a significant positive relationship between job satisfaction and organizational commitment. Suma and Lesha (2013) suggest the amount of job satisfaction among municipality’s employees will positively add the same number to organizational commitment. These findings help human resource department to initiate improvement on job satisfaction in order for the employees to be more committed to the organization.
Promotion shows a strong positive relationship with organizational commitment. This fact, together with current situation that shows low satisfaction on promotion, might be the opportunity to trigger the organizational commitment by widening the promotion opportunity. Nature of work, supervision, and coworkers were also positively correlated to organizational commitment. Organization could achieve a greater level of organizational commitment by improving these three facets, which indicate moderate levels of satisfaction. Interestingly, though employees have lowest satisfaction on pay, pay does not necessarily have positive relationship with organizational commitment. To elaborate, organizational commitment will not gain significant amount of increase with raise in salary.
Salim, Kamarudin, and Kadir (n.d.) used correlation and regression statistics to analyze the data. Data were collected using questionnaires from 132 respondents, who are lecturers of three different MARA Professional Colleges. The measurements used for job satisfaction and organizational commitment are Job Satisfaction Survey (JSS) (Spector, 1997) and Organizational Commitment Questionnaire (OCQ) (Meyer & Allen, 1991).
Salim, Kamarudin, and Kadir (n.d.) found significant positive correlation is formed between job satisfaction towards organizational commitment. Moreover, authors also stated that job satisfaction contributes significantly toward organizational commitment.
Lumley, Coetzeel, Tladinyane, and Ferreira conducted an investigation titled “Exploring The Job Satisfaction and Organizational Commitment of Employees in The Information Technology Environment” in 2011. The analysis methods used in this research are correlational and stepwise regression analyses. A cross-sectional survey was conducted on a convenience sample of 86 employees at 4 information technology companies in South Africa. The measurements used for job satisfaction and organizational commitment are Job Satisfaction Survey (JSS) (Spector, 1997) and Organizational Commitment Questionnaire (OCQ) (Meyer & Allen, 1991).
Overall, Lumley, Coetzeel, Tladinyane, and Ferreira (2011) found a significant positive relationship between job satisfactions with affective commitment dimensions. Satisfied with pay, promotion, supervision, fringe benefit, contingent rewards, co-workers, nature of work, and communication could lead employees to feel more emotionally attached to and involved with their organizations, confirmed Spector’s theory that job satisfaction is most strongly related to affective commitment. Obligations employers must aware are both objective economic exchanges (contingent pay, working overtime, giving notice and high performance-based pay) and subjective social exchanges (employee loyalty, job security and co-worker relationships).
The absence of significant relationships between operating condition organizational commitment is clear. That suggests employees’ satisfaction with organization rules and procedures does not necessarily create a strong commitment to the organizations. The decision to stay within employees’ organization is developed from the feeling of attachment (affective commitment Furthermore, the feeling of attachment is manifested from extrinsic and intrinsic satisfaction rather than the cost of leaving the organization.
Finding of the research also suggested the strongest relationship between pay and nature of work with organizational commitment because both are associated and riggered individual’s career motivations and decisions to stay within a company.
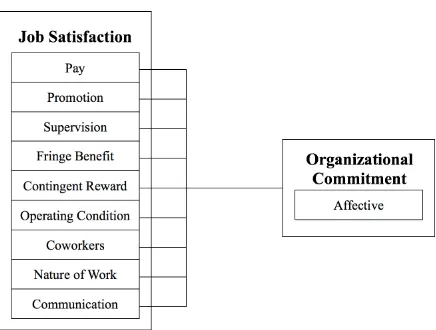
Figure 1. Relationship between Concepts
H1: Job satisfaction factors simultaneously has significant relationship toward organizational commitment of PT X’s employees
H2: Job satisfaction factors individually has significant relationship toward organizational commitment of PT X’s employees
RESEARCH METHOD
This research’s purpose is to study the relationship between job satisfaction as independent variables and organizational commitment as dependent variable of PT X. Based on explanation above, it can be determined that this research belongs to explanatory study as it is designed to explain how and why a phenomenon happened, specifically the relationship between independent and dependent variables, by doing hypothesis testing (Cooper & Schindler, 2014). This research is a cross-sectional research, as it will be done one time in a single timeframe (Cooper & Schindler, 2014). As for the data collection technique, author will use quantitative technique with primary data via questionnaire spread to respondents (Cooper & Schindler, 2014).
Simple random sampling method is used to conduct this research. The population of this research study is all permanent employees of PT X with population of 138. Author attempts to draw samples to describe the overall population in PT X. Simple random sampling may give more variable results as every element in the population has the same chance to be taken as sample. Thus, it can give a less biased and more accurate result. The numbers of collected samples must be equal to or more than 122 samples according to formula retrieved from Tabachnick and Fidell (2012).
Prior to the measurement questions, respondents will be given several classification questions, such as gender, group of age, education, year of working experience, and department. These questions are used to give descriptive statistics of the research. This enables author to categorize respondents to several groups based on each criteria.
The measurement questions use 6-Likert Scale consisting both unfavorable and favorable statements toward object of interest. Author uses even number to eliminate mid-point or prevent ‘neutral’ answer in 5-point
Likert Scale. Garland (1991) agrees that eliminating mid-point in Likert-scales would decrease the social desirability bias. This bias might occur respondents tend to “please the interviewer or appear helpful or not be seen to give what they perceive to be a socially unacceptable answer”. Another argument why author uses this 6-point Likert Scale is because it can provide sufficient options to respondents to take side on either positive or negative position as it is close to the mostly used 5-point Likert Scale. 6-point Likert Scale can remove the existence of “don’t know option” which usually results in inconclusive study (Market Directions, n.d.).
To justify data, reliability and validity tests are done. Prior to further data process, author has to conduct reliability test for the purpose of proving whether data collected is accurate, précised, and consistent, also at the same time free from random errors (Cooper & Schindler, 2014). Data is considered reliable using Cronbach’s Alpha method. When Cronbach’s Alpha value is equal or more than 0.6, data is reliable (Ghozali, 2011). Data then is processed further to ensure its validity by comparing r-value and r-table, which is retreived based on the degree of freedom, d(f)=n-2. Validity means that the scale used is actually measuring the correct thing (Cooper & Schindler, 2014). Validity test, according to Cooper and Schindler (2014), measures what author wished to measure.
Moving on, blue classic assumption test is conducted. There are normality test, autocorrelation test, multicollinearity test, and heteroscedasticity test. Normality test is done to analyze whether the dependent and the independent variables are normally distributed (Ghozali, 2011). To check if data is normally distributed, there are two ways: Graphical, using histogram and P-Plot, and Statistical, using Skewness and Kurtosis theory (Ghozali, 2011). Both Zskewness and Zkurtosis value must not exceed value in z-table.
Zskewness can be calculated using formula of:
��������� = !"#$%#&& ! !
Zkurtosis can be calculated using formula of: ��������� = !"#$%&'&
!" !
Autocorrelation test aims to prove whether there is correlation between residual in t-period with residual in (t-1)-period (Ghozali, 2011). Autocorrelation is the pattern of independence of errors, which is a violation due to collecting data over sequential periods of time. To make sure that there is no autocorrelation occurs in the regression model, Durbin-Watson test is used. When Durbin-Watson value lies between du and 4-du or between -2 to +2, it means that there will be no autocorrelation. The du value is taken from the d-value table by looking at the significance, number of samples or n, and number of independent variable or k.
a regression model. Multicollinearity can be analyzed by comparing tolerance and Variance Inflation Factor (VIF) value. If the tolerance value is higher than 0.10 as the minimum limit and the VIF value is lower than 10 as the maximum limit, it indicates that there is no multicollinearity or no interdependency between independent variables of this model.
The purpose of conducting heteroscedascticity test is to check whether there is a difference between the variance of residual in one observation and another (Ghozali, 2011). To make sure that there is no heteroscedasticity in the regression model, examination of scatterplot diagram and statistical method can be done. If the plot is scattered above and below 0, it indicates that the data is not bias or homoscedasticity. Park test will be used for statistical method in this research (Ghozali, 2011). Park test defines variance (s2) as a function of independent variables and 5% level of significance will be used in this research. Therefore, if the significance t (p-value) is lower than the significance level of 0.05, that means there is heteroscedasticity. On the contrary, if the p- value is greater than 0.05, then there is no heteroscedasticity.
After all tests are done, data could be processed further in multiple linear regression, including F-test and t-test. Multiple Linear Regression is used when a model has more than one independent variable (x) (Cooper & Schindler, 2014). Not only to measure how strong the relation between variables, regression analysis also shows the direction of relationship between independent and dependent variables (Ghozali, 2011). The underlying model is:
Y= β0+ β1X1 + β2X2 + … + βkXk + ε
Y = dependent variable (response variable) Xi = i-th indpendent variables (predictor or
explanatory variable)
β0 = intercept of the equation (value of y when all Xi = 0)
β1,…, βk = slope coefficient for each of the
independent variables
εi = error term, assumed to be 0
F-test uses F-value to test the significance of an overall regression model. F-test is used to determine if all independent variables (x) have simultaneously significant effect toward dependent variable (y) (Ghozali, 2011). In making a decision rule, if the significance level of F is lower than 5 percent, or if F-value is greater than value of F-table, the null hypothesis is rejected. In short, it can be said significant if significant value is less than 0.05. Null hypothesis states that all independent variables do not have significant relationship to the dependent variable while the alternative hypothesis states that at least one independent variable has significant relationship to the dependent variable.
T-test is conducted to determine the significant impact of the relationship between each of the independent variable towards the dependent variable individually, using p-value. According to the t-test theory, single independent variable
significantly affect the dependent variable if the significance-t is lower than the significance level 0.05 with 95% confidence level and if the t-value is greater than the value of the t-table using significance level and df = n-1.
Adjusted R Square or Coefficient of Determination measures how far the multiple regression model can explain the variance of dependent variable (Ghozali, 2011). It is the proportion of variability in Y that is explained by the regression equation. The lowest possible value of r2 is 0, indicating that X explains 0% of the variability in Y. Thus r2 can range from a low of 0 to a high of 1. In developing regression equations, an ideal and desired model will have R2 value close to 1 and the bigger the value of adjusted R2, the better the independent variables in explaining the dependent variable. The value of Adjusted R2, in reality, can be negative, yet the ideal one possesses positive value. The formula used to calculate the adjusted R2 is:
Adjusted R2 = 1 – (1 – R2) 1−(1−�!) (!!!) (!!!!!) n = number of sample
k = number of independent variables
RESULTS AND DISCUSSION
This study aims to find out the relationship between job satisfaction and organizational commitment in the case of employees in PT X. After going through several statistical tests and analysis, the result of the tests need to be discussed further and analyzed in order to confirm the hypotheses developed.
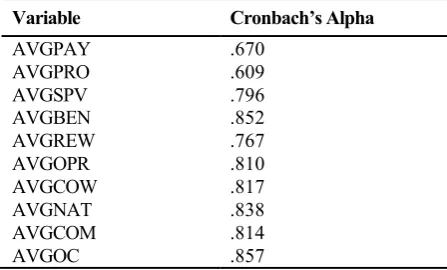
Table 4. Reliability Test
Variable Cronbach’s Alpha
AVGPAY .670
AVGPRO .609
AVGSPV .796
AVGBEN .852
AVGREW .767
AVGOPR .810
AVGCOW .817
AVGNAT .838
AVGCOM .814
AVGOC .857
From the research method, the theory said that data is considered reliable when Cronbach’s Alpha value is equal or more than 0.6 (Ghozali, 2011). From the table described above, all Cronbach’s Alpha has value more than 0.6. That means all data is reliable and can be processed further. The validity of data can also be justified as all Corrected Item-Total Correlation value is higher than the value in r-table.
��������� = ! !.!"# ! !"# =−1.
5935 (4.1)
��������� = !.!"# !" !"# =
0.4418 (4.2)
This model has passed Autocorrelation Test since the it has value within the accepted range. The accepted range lies between 1.84589 < d < 2.15411. Table 4.22. shows that the Durbin-Watson value of the model, is 2.006. Thus, this model has passed Autocorrelation Test since the it has value within the accepted range, which is 2.006.
As the tolerance value of this model is higher than 0.10 and the VIF value is lower than 10, it indicates a multicollinearity-free model, meaning there is no interdependency between independent variables. Looking at Table 4.23 all tolerance value are higher than its minimum limit, 0.1, and no VIF value is higher than 10 as its maximum limit. Thus, it can be concluded that all variables has passed multicollinearity test.
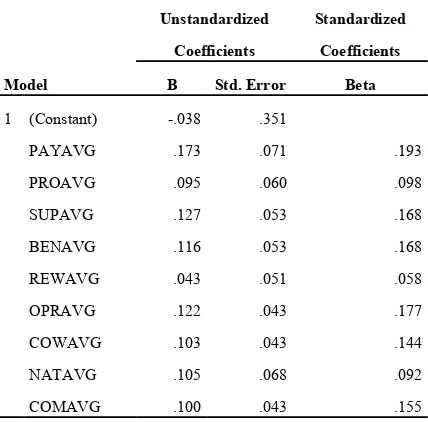
Last blue classic assumption test is heteroscedasticity test and this model is free from heteroscedasticity both graphically using scatterplot and statistically using Park test. For the Park test, p-value has to be greater than 0.05 in order for the model to be homoscedastic.
Table 4. Coefficients Statistic for heteroscedasticity test
Model
Unstandardized
Coefficients
Standardized
Coefficients
B Std. Error Beta
1 (Constant) -.038 .351
PAYAVG .173 .071 .193
PROAVG .095 .060 .098
SUPAVG .127 .053 .168
BENAVG .116 .053 .168
REWAVG .043 .051 .058
OPRAVG .122 .043 .177
COWAVG .103 .043 .144
NATAVG .105 .068 .092
COMAVG .100 .043 .155
�=��+0.173�
!+0.167�!+0.127�!+
0.116�
!+0.104�!+0.122�!+0.103�!+
0.105�!+0.100�! + ε
X1 = Pay X2 = Promotion
X3 = Supervision X4 = Fringe Benefit
X5 = Contingent Reward X6 = Operating Procedure
X7 = Coworkers X8 = Nature of Work
X9 = Communication
Table 5. ANOVA Test of Regression Model
Model
Sum of
Squares df
Mean
Square F Sig.
1 Regression 22.331 9 2.481 31.115 .000b
Residual 9.011 113 .080
Total 31.343 122
The F significance level of this model is below 0.05 and the F-value is higher than value of F-table, which is 2.0206. Author could get this number from df nominator of 8 and df denominator of 114 with 0.05 significance level. Therefore, Job Satisfaction simultaneously has impact to the Organizational Commitment of employees in PT X. These results strengthen previous researches done by Salim, Kamarudin, and Kadir (n.d.), Lumley, Coetzeel, Tladinyane, and Ferreira (2011), and Suma and Lesha (2013), whose results show significant and positive relationship between job satisfaction and organizational commitment.
Table 6. Coefficients Statistic fot t-Test
Model t Sig.
1 (Constant) -.109 .913
PAYAVG 2.425 .017
PROAVG 2.583 .016
SUPAVG 2.386 .019
BENAVG 2.185 .031
REWAVG 2.841 .022
OPRAVG 2.825 .006
COWAVG 2.414 .017
NATAVG 2.535 .028
COMAVG 2.342 .021
The significance-t value of all job satisfaction facets are below the 0.05 significance level and the t-value is higher than 1.9796 (value in t-table). Hence, all job satisfaction facets has significant relationship with organizational commitment.
slightly satisfying for employees as it lies between 4 as ‘slightly agree’ and 5 ‘moderately agree’.
Promotion Satisfaction’s significance value is 0.017, which is below 0.05, therefore it can be concluded that Promotion Satisfaction significantly impacts Organizational Commitment of employees in PT X. Researches mentioned in Chapter 2 prove that promotion satisfaction offer significant, positive, and moreover the strongest impact toward organizational commitment. The coefficient is a positive value, which means there is a positive relationship between Promotion Satisfaction and Organizational Commitment or the higher the promotion satisfaction, the higher organizational commitment of the employees. Every one unit increase in Promotion Satisfaction will result an increase of 0.095 in Organizational Commitment. Total average of Promotion Satisfaction scored 4.4777 out of 6, which means the current level of Promotion Satisfaction in PT X is slightly satisfying for employees as it lies between 4 as ‘slightly agree’ and 5 ‘moderately agree’.
Supervision Satisfaction’s significance value is 0.019, which is below 0.05, therefore it can be concluded that Pay Satisfaction significantly impacts Organizational Commitment of employees in PT X. Researches mentioned in Chapter 2 prove that supervision satisfaction offer significant and positive impact toward organizational commitment. The coefficient is a positive value, which means there is a positive relationship between Supervision Satisfaction and Organizational Commitment or the higher the supervision satisfaction, the higher organizational commitment of the employees. Every one unit increase in Supervision Satisfaction will result an increase of 0.127 in Organizational Commitment. Total average of Supervision Satisfaction scored 4.7906 out of 6, which means the current level of Supervision Satisfaction in PT X is slightly satisfying for employees as it lies between 4 as ‘slightly agree’ and 5 ‘moderately agree’.
Fringe Benefit Satisfaction’s significance value is 0.031, which is below 0.05, therefore it can be concluded that Fringe Benefit Satisfaction significantly impacts Organizational Commitment of employees in PT X. Researches mentioned in Chapter 2 prove that fringe benefit satisfaction offer significant and positive impact toward organizational commitment. The coefficient is a positive value, which means there is a positive relationship between Fringe Benefit Satisfaction and Organizational Commitment or the higher the Fringe Benefit satisfaction, the higher organizational commitment of the employees. Every one unit increase in Supervision Satisfaction will result an increase of 0.116 in Organizational Commitment. Total average of Fringe Benefit Satisfaction scored 4.3008 out of 6, which means the current level of Fringe Benefit Satisfaction in PT X is slightly satisfying for employees as it lies between 4 as ‘slightly agree’ and 5 ‘moderately agree’.
Contingent Reward Satisfaction’s significance value is 0.022, which is below 0.05, therefore it can be concluded that Contingent Reward Satisfaction significantly impacts Organizational Commitment of employees in PT X. Researches mentioned in Chapter 2 prove that contingent reward satisfaction offer significant and positive impact
toward organizational commitment. The coefficient is a positive value, which means there is a positive relationship between Contingent Reward Satisfaction and Organizational Commitment or the higher the supervision satisfaction, the higher organizational commitment of the employees. Every one unit increase in Contingent Reward Satisfaction will result an increase of 0.043 in Organizational Commitment. Total average of Contingent Reward Satisfaction scored 4.3943 out of 6, which means the current level of Contingent Reward Satisfaction in PT X is slightly satisfying for employees as it lies between 4 as ‘slightly agree’ and 5 ‘moderately agree’.
Operating Procedure Satisfaction’s significance value is 0.006, which is below 0.05, therefore it can be concluded that Operating Procedure Satisfaction significantly impacts Organizational Commitment of employees in PT X. Researches mentioned in Chapter 2 have two different opinion on how operating procedure gives effects to organizational commitment. One agrees that operating procedure does not necessarily increase employee’s organizational commitment. This research, however, is in line with the other research, which prove that operating procedures satisfaction offer significant and positive impact toward organizational commitment. The coefficient is a positive value, which means there is a positive relationship between Operating Procedure Satisfaction and Organizational Commitment or the higher the operating procedure satisfaction, the higher organizational commitment of the employees. Every one unit increase in Operating Procedure Satisfaction will result an increase of 0.122 in Organizational Commitment. Total average of Operating Procedure Satisfaction scored 4.3455 out of 6, which means the current level of Operating Procedure Satisfaction in PT X is slightly satisfying for employees as it lies between 4 as ‘slightly agree’ and 5 ‘moderately agree’.
Coworkers Satisfaction’s significance value is 0.017, which is below 0.05, therefore it can be concluded that Coworkers Satisfaction significantly impacts Organizational Commitment of employees in PT X. Researches mentioned in Chapter 2 prove that coworkers satisfaction offer significant and positive impact toward organizational commitment. The coefficient is a positive value, which means there is a positive relationship between Coworkers Satisfaction and Organizational Commitment or the higher the coworkers satisfaction, the higher organizational commitment of the employees. Every one unit increase in Coworkers Satisfaction will result an increase of 0.103 in Organizational Commitment. Total average of Coworkers Satisfaction scored 4.8964 out of 6, which means the current level of Coworkers Satisfaction in PT X is slightly satisfying for employees as it lies between 4 as ‘slightly agree’ and 5 ‘moderately agree’.
positive value, which means there is a positive relationship between Nature of Work Satisfaction and Organizational Commitment or the higher the nature of work satisfaction, the higher organizational commitment of the employees. Every one unit increase in Nature of Work Satisfaction will result an increase of 0.105 in Organizational Commitment. Total average of Nature of Work Satisfaction scored 4.9777 out of 6, which means the current level of Nature of Work Satisfaction in PT X is slightly satisfying for employees as it lies between 4 as ‘slightly agree’ and 5 ‘moderately agree’
Communication Satisfaction’s significance value is 0.021, which is below 0.05, therefore it can be concluded that Communication Satisfaction significantly impacts Organizational Commitment of employees in PT X. Researches mentioned in Chapter 2 prove that communication satisfaction offer significant and positive impact toward organizational commitment. The coefficient is a positive value, which means there is a positive relationship between Communication Satisfaction and Organizational Commitment or the higher the communication satisfaction, the higher organizational commitment of the employees. Every one unit increase in Communication Satisfaction will result an increase of 0.100 in Organizational Commitment. Total average of Communication Satisfaction scored 4.2012 out of 6, which means the current level of Communication Satisfaction in PT X is slightly satisfying for employees as it lies between 4 as ‘slightly agree’ and 5 ‘moderately agree’.
CONCLUSION
The topic discussed in this research highlight the relationship between job satisfaction and organizational commitment of employees in PT X. This study aims to give explanation of how job satisfaction (including pay, promotion, supervision, fringe benefit, contingency reward, operating procedure, coworkers, nature of work, and communication) will both simultaneously and individually affect organizational commitment of employees in PT X. In the beginning of this research, author has come up with two questions to see whether there is relationship between job satisfaction and organizational commitment. Author then also composed two questions to see the current level of both job satisfaction and organizational commitment in PT X. From the first two questions, author finally came up with two hypotheses to be tested in this research.
Author then spread 138 questionnaires to permanent employees in PT X and received 123 valid responses back. Before processing these responses further, author analyzed the descriptive statistics and checked the reliability and validity of the data as the preliminary test. Descriptive analysis indicates that respondents mostly age between 31-40 with almost equally distributed gender. Employees of PT X are mostly bachelor graduate and have worked for the company around 2-3 years in their respective department. The result of questionnaires also signifies that employees of PT X possess slightly high organizational commitment with average of 4.4563 as it lies between 4 as ‘slightly agree’ and 5 ‘moderately agree’.
After that, all reliable and valid data was tested using blue classic assumption, including normality,
autocorrelation, multicollinearity, and heteroscedasticity tests. Data must be normally distributed, free from autocorrelation, multicollinearity, and heteroscedasticity to be taken for the next action, which is multiple linear regression.
To answer the questions and to test the hypothesis, multiple linear regression is used. The first question and hypothesis want to emphasize the significant relationship between job satisfaction and organizational commitment. F-Test was conducted in this research to answer this question and it turned out that job satisfaction and organizational commitment has significant relationship. In other word, employees demonstrated higher organizational commitment when they had higher job satisfaction. t-Test was then used to see which dimensions have significant relationship. The result of the test shows significant relationship of all dimensions with organizational commitment. From the coefficient, author can conclude that pay satisfaction and organizational commitment has the strongest relationship among the other 7 independent variables with 0.173. The second place is obtained by pay satisfaction. The adjusted r square of this research is 0.690, which means 69 percent of organizational commitment could be explained using job satisfaction. Thus, there are 31 percent of other variables outside the regression model that influence organizational commitment of employees in PT X.
After successfully answer all questions stated in chapter 1, author believes that all research benefits also have been achieved at the same time. As the research successfully prove the strong relationship between job satisfaction and organizational commitment, it can be the guideline for PT X’s Human Resource Management evaluation. PT X can improve variables, including pay, promotion, supervision, contingent reward, operating procedures, coworkers, nature of work, and communication, as part of job satisfaction. That is because job satisfaction in the end has strong relationship with organizational commitment to trigger, attract, and sustain young employees for their management succession. The level of job satisfaction and organizational commitment mostly lies between 4 as ‘slightly agree’ and 5 ‘moderately agree’, which is quite satisfying. Company, however, should not be satisfied with this result, as this might as well be a temporary result if company does not keep up with employee’s expectation. Company could trigger employees to be more committed to the organization by improving system to increase their job satisfaction.
As explained in Chapter 4, this research has proved the positive relationship between job satisfaction and organizational commitment of employees in PT X. Eight out of nine job satisfaction dimensions are proved to have significant relationship with nature of work and pay satisfaction as the top two highest influencers. Therefore, author suggests that PT X should focus on improving these dimensions to trigger high organizational commitment. The practical implications for company to enhance organizational commitment are suggested below.
First, company should review their system that might influence the operating procedure, communication, and nature of work. Evaluation of rules and procedures also must be re-evaluate to create a better system that is beneficial for both parties. However, these policies should not make the work even more difficult, but instead facilitate the work. Communication also plays important role and that is why company need to refine their communication system that allows employees to understand the goal of organization. Goal of organization can act as a guideline for employee to take actions and decisions in their work life. Next, it is also important for company to enhance nature of work satisfaction. Company needs to establish effective work assignment decisions and improvement in job design that give employees greater variety to their obligation for a more challenging and interesting career (Lumley, Coetzeel, Tladinyane, & Ferreira, 2011). Company also needs to give employees more space to allow them to express their ideas and supports questioning and feedback (Salim, Kamarudin, & Kadir, n.d.).
Second, the results suggest that company should create a nice working environment to encourage employees joining and staying in their company. One of the most effective ways is to let people inside the company participate in creating a harmonious environment. Supervision satisfaction could be improved by assisting managers or supervisors to improve their roles as supervisor to become developing coaches and learning facilitators (McLean, 2006). One of the ways to achieve that is company can provide relevant training programs and support developmental relationships such as coaching and mentoring. Company can employ the role of professionals to arrange the program and become the mediator. Through these sessions, it can motivate employees and help them to find their potentials in doing tasks. If all employees are motivated in their work and able to do such great job, then there will be a harmonious working environment. If all goes well, it will also improve coworkers satisfaction at the same time, which ultimately influence organizational commitment.
Things can only be considered the greatest if there is no better competitor. Thus, company should not only focus on their own greatness, yet also look around and reflect whether they have given their best to satisfy employee for a higher loyalty and commitment.
There is no finish line in a research as the world keep changing overtime and limitations serve as learning triggers. Even though this research used research methodology that has been used and perfected over centuries, there is no such perfect research and this research is no exceptional. The
limitations faced by author when doing this research are as follows.
Independent variables used in this research are in total 9 dimensions, which explain employee’s overall job satisfaction. The result only covers 80 percent of the total dependent variable’s influencers and hence 20 percent others can only be represented using variables that have not been explained in this research.
As this research’s targets are limited only to employees in PT X, hence this research may not be able to represent other companies. Condition in other company may not be the same as this research.
Limitation must not be the obstacle, yet becoming a trigger for human being for improvement. To improve result of the research, author suggests several ideas that might be applicable for future researchers who are interested in doing similar research.
When conducting similar research in the future, researcher could add more samples for more accurate results. For a more reliable result, researchers could also extend the scope of the population. Spreading the questionnaire or taking samples from several companies in the same industry will create a more accurate result in a way the result will be a better representative. The appropriate number should be able to represent employees from timber industry and author suggests 30% of the total employees in timber industry.
The result of research shows that job satisfaction cover 69 percent of the change in organizational commitment, to cover other 31 percent variables that might influence organizational commitment, researchers could add up more variables. Adding more variables might be able to generate more accurate result with greater variance change in organizational commitment as dependent variable. Suggested variables are job involvement as previous research found a relatively high relationship between job involvement and organizational commitment (Uygur & Kilic, 2009).
REFERENCES
Akhtar, J. (2014). Impact of Work Environment, Salary Package and Employees’ Perception on Organizational Commitment: A study of Small & Medium Enterprises (SMEs) of Pakistan.
International Journal of Academic Research in Business and Social Sciences, 4 (8), 147-165. Al-Hussami, M. (2008). A Study of Nurses' Job
Satisfaction: The Relationship to Organizational Commitment, Perceived Organizational Support, Transactional Leadership, Transformational Leadership, and Level of Education. European Journal of Scientific Research, 22 (2), 286-295.
Support as a Mediating Factor. In
Communication Quarterly (pp. 357-367). Bashayreh, A. M. (2009). Organizational Culture and
Job Satisfaction: A Case of Academic Staffs at Universiti Utara Malaysia (UUM). Universiti Utara Malaysia, Fakulti Pembangunan Sosial dan Manusia. Kedah Darul Aman: Universiti Utara Malaysia.
BBC. (n.d.). Business: Environment. Retrieved 06 22, 2015, from GCSE Bitesize:
http://www.bbc.co.uk/schools/gcsebitesize/bus iness/environment/stakeholders1.shtml
Beck, N., & Wilson, J. 2. (2000). Development of affective organizational commitment: A cross- sequental examination of change with tenure .
Journal of Vocational Behaviour , 56, 114-136.
Chron. (n.d.). Small Business: Nature of Work vs. Level of Work. (Hearst Newspapers, LLC) Retrieved March 16, 2015, from Chron: http://smallbusiness.chron.com/nature-work-vs-level-work-33710.html
Clark, A. E., & Oswald, A. J. (1996). Satisfaction and comparison income. Journal of Public Economics, 61 (3), 359-381.
Cooper, D. R., & Schindler, P. S. (2014). Business Research Methods (Twelfth Edition ed.). New York: McGraw-Hill/Irwin.
Coyle-Shapiro, J. A.-M., Morrow, P. C., & Kessler, I. (2006). Serving two organizations: Exploring the employment relationship of contracted employees. Human Resource Management, 45
(4), 561-583.
Cranny, C. J., Smith, P. C., & Stone, E. F. (1992). Job Satisfaction: How People Feel about Their Jobs and how it Affects Their Performance.
New York: Lexington Book.
Daley, D. (1988). Profile of the Uninvolved Worker: An Examination of Employee Attitudes Toward Management Practices. International Journal of Public Administration, 11 (1), 65-90.
Dunham, R., Grube, J., & Castaneda, M. (1994). Organizational commitment: The utility of an integrative definition. Journal of Applied Psychology, 79, 370-380.
Gbadamosi, G. (2003). HRM and the commitment rhetoric: Challenges for Africa . Management Decision , 41 (3), 274-280.
George, J., & Jones, G. (2008). Understanding and Managing Organizational behavior (Fifth Edition ed.). New Yersey: Pearson/Prentice Hall.
Getahun, S., Sims, B., & Hummer, D. (2008). Job Satisfaction and Organizational Commitment Among Probation and Parole Officers: A Case Study. Professional Issues in Criminal Justice , 3 (1), 39-56.
Ghozali, I. (2013). Aplikasi Analisis Multivariate Dengan Program IBM SPSS 21 (7th Edition ed.). Semarang: Badan Penerbit Universitas Diponegoro.
Halim, L. (2013). Benefits & Compensation International: Total Remuneration and Pension Investment. Towers Watson. London: Pension Publications Limited.
Hayes, S., & Gaskell, S. (2007). Fringe benefits: Obvious and hidden. The Bottom Line, 51, 33-35.
Henne, D., & Locke, E. (1985). Job Dissatisfaction: What Are Consequences? International Journal of Psychology, 20, 221-240.
Heskett, J. L., Jones, T. O., Loveman, G. W., Sasser, W. E., & Schlesinger, L. A. (2008). Putting the Service-Profit Chain to Work. Harvard Business Review.
Howe, N. (2014, September 04). Arts & Letters: The Millennial Generation, "Keep Calm and Carry On". Retrieved February 23, 2015, from Forbes:
http://www.forbes.com/sites/neilhowe/2014/09 /04/the-millennial-generation-keep-calm-and-carry-on-part-6-of-7/
Hutchinson, S., & Garstka, M. (1996). Sources of perceived organizational support:Goal setting and feedback. Journal of Applied Social Psychology, 26, 1351-1366.
Indermun, V., & SaheedBayat, M. (2013). The Job Satisfaction -Employee Performance Relationship: A Theoretical Perspective.
International journal of Innovative Research in Management, 11 (2), 1-9.
Investopedia. (n.d.). Dictionary: Promotion. Retrieved March 14, 2015, from Investopedia: http://www.investopedia.com/terms/p/promoti on.asp
IRS. (2014). Publication: Fringe Benefits. Retrieved
March 14, 2015, from IRS:
http://www.irs.gov/publications/p15b/ar02.htm l
Khuong, M. N., & Vu, P. L. (2014). Measuring the Effects of Drivers Organizational Commitment through the Mediation of Job Satisfaction: A Study in Ho Chi Minh City, Vietnam.
International Journal of Current Research and Academic Review, 2 (2), 1-16.
Lee, A. (1971). An Empirical Analysis of Organizational Identification. Academy of Management Journal, 14, 482-519.
Organizational Commitment and Job Satisfaction in Faculty.
Luddy, N. (2005). Job satisfaction amongst employees at a Public health institution in national sample of workers. Social Science Journal, 38 (2), 233-251.
Lumley, E., Coetzeel, M., Tladinyane, R., & Ferreira, N. (2011). Exploring the job satisfaction and organisational commitment of employees in the information technology environment.
Southern African Business Review , 15 (1), 100-118.
Luthans, F. (1998). Organisational Behaviour (8th Edition ed.). Boston: Irwin McGraw-Hill. Mathieu, J., & Zajac, D. (1990). A review and
meta-analysis of the antecedents, correlates and consequences of organizational commitment.
Psychological Bulletin, 108 (2), 171-194. McLean, G. N. (2006). Organization development:
Principles, process, performance (Vol. 45). San Francisco: Berrett-Koehler Publishers. Meyer, J. P., & Allen, N. J. (1991). A three
component conceptualization of organization commitment. Human Resource Management Review, 1 (1), 61-89.
Meyer, J. P., & Allen, N. J. (1997). Commitment in the workplace: Theory research, and application. Thousand Oaks, CA: Sage Publishing.
Meyer, J. P., Stanley, D. J., Herscovitch, L., & Topolnytsky, L. (2002). Affective, Continuance, and Normative Commitment to the Organization: A Meta-analysis of Antecedents, Correlates, and Consequences.
Journal of Vocational Behavior (61), 20-52. Meyer, J. P., Paunonen, S. V., Gellatly, I. R., Goffin,
R. D., & Jackson, D. N. (1989). Organizational commitment and job performance: It's the nature of the commitment that counts. Journal of Applied Psychology (74), 152-156.
Miller, S. (2014, May 12). HR Topics & Strategy: Compensation. Retrieved March 14, 2015, from Society For Human Resource Management:
http://www.shrm.org/hrdisciplines/compensati on/articles/pages/pay-drives-satisfaction.aspx Moore, K. (2012, May 14). Employees First,
Customers Second: Why It Really Works in the Market. Retrieved Feb 20, 2015, from Fobes:
http://www.forbes.com/sites/karlmoore/2012/0 5/14/employees-first-customers-second-why-it-really-works-in-the-market/
Mowday, R. T., Porter, L. W., & Steers, R. M. (1982).
Employee–organization linkages: The psychology of commitment, absenteeism, and turnover. New York: Academic Press.
Mowday, R. T., Steers, R. M., & Porter, L. W. (1979). The Measurement of Organizational
Commitment. Journal of Vocational Behavior
(14), 224-247.
Mowday, R. T., & Sutton, R. I. (1993). Organizational Behavior: Linking Individuals and Groups to Organizational Contexts.
Annual Review of Psychology, 44, 195-229. Nawab, S., & Bhatti, K. K. (2011). Influence of
Employee Compensation on Organizational Commitment and Job Satisfaction: A Case Study of Educational Sector of Pakistan.
International Journal of Business and Social Science, 2 (8), 25-32.
NYSDOT Training Bureau. (1997). Training: Supervision. Retrieved March 13, 2015, from NYS Association of Transportation Engineers: http://www.nysate.org/training/supervision.pdf Robbins, S. P. (2000). Essentials of Organizational Behavior (Sixth Edition ed.). New Jersey: Prentice Hall.
Robbins, S. (1993). Organizational Behaviour: Concepts, Controversies, and Applications
(6th Edition ed.). New Jersey: Prentice Hall. Roznowski, M., & Hulin, C. (1992). The scientific
merit of valid measures of general constructs with special reference to job satisfaction and job withdrawal.
Salim, M., Kamarudin, H., & Kadir, M. B. (n.d.).
Factors Affecting Organizational Commitment among Lecturers in Higher Educational Institution in Malaysia. Kolej Profesional MARA Bandar Melaka. Bandar Melaka: Kolej Profesional MARA Bandar Melaka.
Sammer, J. (2012, January 24). HR: What about Generation X? Retrieved February 25, 2015,
from Business Finance:
http://businessfinancemag.com/hr/what-about-generation-x
Schawbel, D. (2011, November 22). Entrepreneurs: Who's at Fault for High Gen-Y Turnover?
Retrieved February 23, 2015, from Forbes: http://www.forbes.com/sites/danschawbel/201 1/11/22/whos-at-fault-for-high-gen-y-turnover/ Schwarzwald, J., Koslowsky, M., & Shalit, B. (1992). A field study of employees' attitudes and behaviors after promotion decisions. Journal of Applied Psychology, 77 (4), 511-514. Smith, P., Kendall, L., & Hulin, C. (1969). The
Measurement of Satisfaction in Work and Retirement. Chicago: Rand McNally.
Soon, Y. J., Lai, K. K., Hussin, Z., & Jusoff, K. (2008). The Influence of Employee Benefits Towards Organizational Commitment. Asian Social Science, 4 (8), 147-150.
Steers, R. (1977). Antecedents and outcomes of organizational commitment. In Administrative Science Quarterly (Vol. 22, pp. 46-56). Suma, S., & Lesha, J. (2013). Job Satisfaction and
Organizational Commitment: The Case of Shkodra Municipality. European Scientific Journal, 9 (17), 41-51.
Tabachnick, B. G., & Fidell, L. S. (2012). Using Multivariate Statistics (6th Edition ed.). New York: Pearson.
The Canadian Professional Sales Association. (2006).
Knowledge Centre: 7 Mistakes that Cause High Turnover. Retrieved June 22, 2015, from Canadian Professional Sales Association: http://www.cpsa.com/knowledgecentre/srcArti cleRead.aspx?articleID=779
The Council of Economic Advisers. (2014, October).
15 Economic Facts About Millennials.
Retrieved June 22, 2015, from
https://www.whitehouse.gov/sites/default/files/ docs/millennials_report.pdf
Towers Watson. (2012, September 19). Towers Watson. Retrieved February 22, 2015, from Press: Companies Worldwide Struggle to Attract and Retain Critical-Skill and High-Potential Employees, Towers Watson Survey Finds:
http://www.towerswatson.com/en/Press/2012/0 9/companies-worldwide-struggle-to-attract- and-retain-critical-skill-and-high-potential-employees-tower
Uygur, A., & Kilic, G. (2009). A Study into Organizational Commitment and Job Involvement: An Application Towards the Personnel in the Central Organization for Ministry of Health in Turkey . Ozean Journal of Applied Sciences, 2 (1), 113-125.
Weiss, H. M. (2002). Deconstructing job satisfaction Separating evaluations, beliefs, and affective experiences. Human Resource Management Review , 12, 173-194. Allen, M. (1992). Communication and Organizational Commitment: Perceived Organizational Support as a Mediating Factor. In