Full Terms & Conditions of access and use can be found at
http://www.tandfonline.com/action/journalInformation?journalCode=vjeb20
Download by: [Universitas Maritim Raja Ali Haji] Date: 11 January 2016, At: 23:22
Journal of Education for Business
ISSN: 0883-2323 (Print) 1940-3356 (Online) Journal homepage: http://www.tandfonline.com/loi/vjeb20
Academic Dishonesty: Are Business Students
Different From Other College Students?
Rajesh Iyer & Jacqueline K. Eastman
To cite this article: Rajesh Iyer & Jacqueline K. Eastman (2006) Academic Dishonesty: Are Business Students Different From Other College Students?, Journal of Education for Business, 82:2, 101-110, DOI: 10.3200/JOEB.82.2.101-110
To link to this article: http://dx.doi.org/10.3200/JOEB.82.2.101-110
Published online: 07 Aug 2010.
Submit your article to this journal
Article views: 151
View related articles
ABSTRACT.In this article, the authors
investigated academic dishonesty and how
business students stand on the issue as
compared with other college students. They
found in their study that nonbusiness
stu-dents are more likely to cheat than are
busi-ness students. In general, students who are
members of Greek social organizations,
undergraduates, male, and have low
self-esteem typically engage in higher levels of
academic dishonesty. Only employment and
innovativeness had an overall significant
influence on academic dishonesty.
Key words: academic dishonesty, business
students, cheating
Copyright © 2006 Heldref Publications
Academic Dishonesty:
Are Business Students Different From
Other College Students?
RAJESH IYER
JACQUELINE K. EASTMAN VALDOSTA STATE UNIVERSITY VALDOSTA, GEORGIA
any people in the educational system are concerned with the problem of academic dishonesty and the rate at which it is increasing (McCabe & Trevino, 1997; Park, 2003; Pullen, Ortloff, Casey, & Payne, 2000; Williams & Hosek, 2003). The estimate of how many students cheat varies dra-matically. McCabe and Trevino (1997) offer a range from 13% to 95%, and Park states that at least 50% of students cheat. In business literature, Kidwell, Wozniak, and Laurel (2003), and Chap-man, Davis, Toy, and Wright (2004) found that 75% of students reported cheating. Their findings are similar to the 63% found by Nonis and Swift (1998). Finally, there is concern that academic dishonesty is increasing because technology makes it easier for students to cheat (Born, 2003; Park; Scanlon, 2004).
Academic dishonesty occurs in dif-ferent countries, with both undergradu-ate and graduundergradu-ate students, and in public and private schools of all sizes (Park, 2003). Even for schools with honor sys-tems, the number of code violations for cheating has increased since the mid-90s (Auer & Krupar, 2001). There also are multiple reasons why students cheat, and students rationalize and downplay the cheating done by themselves and their peers (Park).
This issue of academic dishonesty is critical for business schools because it
seems to mirror the growing concerns of ethical problems in the business community (Chapman et al., 2004; Kidwell et al., 2003). Those who cheat in college are more likely to cheat on the job (Swift & Nonis, 1998). Thus, there is an increased need for business schools to address academic dishonesty because what students learn as accept-able behavior in the classroom impacts their expectations of what is acceptable professionally. Furthermore, the costs for not addressing this issue are enor-mous (Kidwell et al.; Rawwas, Al-Khatib, & Vitell, 2004; Williams & Hosek, 2003).
A concern of business faculty is what factors influence cheating (per-sonal, contextual, or situational). In this study, we tested a series of hypotheses with the aim of describing the academically dishonest student, and whether business students differ from nonbusiness students in terms of academic dishonesty.
Literature Review
McLafferty and Foust (2004) say that “every profession has a holy grail that involves an element of trust necessary for that profession to survive and thrive” (p. 186). According to Pullen et al. (2000), “cheating is the bane of higher education and strikes at the heart of established values in American culture” (p. 616).
M
Plagiarism and Academic Dishonesty
Plagiarism is typically seen as a form of fraud, intellectual theft, and “a transgression against our common intellectual values” (Isserman, 2003, p. B12). Park (2003) defines plagiarism
as “literary theft, stealing (by copying) the words or ideas of someone else and passing them off as one’s own without crediting the source”(p. 472). The issue is not whether people’s ideas are origi-nal, but that they do not properly attribute the credit for those ideas to whom it belongs (Isserman; Taylor, 2003). According to Park, plagiarism would include stealing, buying, copy-ing, or using material from another source and passing it off as one’s own work as well as paraphrasing material without appropriate documentation. In addition, plagiarism may not be inten-tional, such as improper citation (Bur-nett, 2002; Park).
Plagiarism needs to be seen within a broader context of cheating that includes other unethical practices such as cheating on tests or assignments, fal-sifying data, misusing resources, taking credit for others’ work, and manipulat-ing academic staff (Park, 2003). Lam-bert, Ellen, and Taylor (2003) define academic dishonesty as behavior that breaches “the submission of work for assessment that has been produced legitimately by the student who will be awarded the grade, and that demon-strates the student’s knowledge and understanding of the context or processes being assessed” (p. 98).
The most common forms of academic dishonesty are copying a few sentences without proper citation, working on indi-vidual assignments with others, having someone check over a paper before turn-ing it in, and gettturn-ing questions or answers on a test from someone who had already taken it (Brown, 1996; Kidwell et al., 2003). Swift and Nonis (1998) found a significant relationship among students who cheated on exams with students who cheated on projects, which suggests that students who cheat engage in more than one cheating practice.
Contextual Process to Cheating
McCabe and Trevino (1997) found that cheating was influenced by a number
of individual factors (e.g., age, gender, and grade point average [GPA]) and con-textual factors (e.g., peers, Greek social organization membership, and perceived penalties for academic dishonesty). McCabe and Trevino (1997) found that,
the most powerful influential factors were peer-related contextual factors . . . among the contextual variables, fraternity/sorori-ty membership, peer behavior, and peer disapproval had the strongest influence. Academic dishonesty was lower when respondents perceived that their peers dis-approved of such misconduct, was higher among fraternity/sorority members, and was higher when students perceived high-er levels of cheating among their pehigh-ers. (p. 391)
Finally, McCabe and Trevino’s total model explained only approximately 30% of the total variance in academic dishonesty.
Brown (1996) found few differences by major for academic dishonesty whereas others found that business stu-dents ranked highest for self-reported levels of cheating, followed by engi-neering and humanities students (Meade, 1992; Park, 2003). In a study of discarded cheat sheets, Pullen et al., (2000) found significantly more cheat sheets used by business students com-pared with other disciplines.
In terms of age and class, the past studies suggest that younger, immature students cheat more than do older, mature students; juniors and seniors cheat less than do freshmen or sopho-mores (McCabe & Trevino, 1997; Park, 2003; Straw, 2002). Lambert et al. (2003) found that older students were more likely than were younger students to view scenarios of academic dishon-esty as serious offenses, whereas Kuther (2004) found that juniors and seniors saw a bigger ethical problem with pro-fessors ignoring cheating than did fresh-men students. Brown (1995) found the ethics of graduate business students sim-ilar to those of undergraduates, despite graduate students perceiving themselves as more ethical than undergraduates.
In terms of gender, McCabe and Trevino (1997) found that men reported a higher level of academic dishonesty than did women. Buckley, Wiese, and Harvey (1998) found that men had a higher probability of engaging in
uneth-ical behavior than did women. Leming (1980) found that, under a low-risk con-dition, women cheated more than did men, but a higher risk of punishment reduced the risk of cheating only for women. Finally, Lambert et al., (2003) found that women were more likely to view scenarios of academic dishonesty as serious cheating.
The effect of GPA on academic dis-honesty has shown that students with a lower GPA are more likely to cheat because they have more to gain and less to lose than do students with a higher GPA (Straw, 2002).
In terms of extracurricular activities, students involved in activities such as athletics and Greek social organizations are more likely to cheat than are other students (McCabe & Trevino, 1997; Park, 2003; Straw, 2002). Specifically, fraternities are environments in which norms, values, and skills associated with cheating can be easily shared as they provide access to people and resources (e.g., old test files) that facilitate cheat-ing (McCabe & Trevino, 1997).
In terms of self-esteem, Buckley et al. (1998) found that perceptions of self-esteem did not predict unethical behavior.
Predictions of Cheating
In looking at why students cheat, Williams and Hosek (2003) stress that students, even dishonest ones, are ratio-nal and that the decision to cheat is not because of an impulsive action, but rather a conscious decision that the benefits of cheating outweigh the risks. Buckley et al., (1998) found that the most effective predictors of student cheating were (a) the probability of being caught and penalized, (b) possessing high hostility or aggression characteristics, and (c) being a man. According to Pullen et al., (2000), “causal factors run the gamut from large classes, impersonal relation-ships with professors, competition for jobs, gaining higher GPAs in order to enter graduate school, to a culture that appears to accept cheating readily as a normal part of life” (p. 616).
Finally, researchers offer the follow-ing additional reasons for why students cheat: (a) genuine lack of understanding of what is plagiarism (Park, 2003), (b) efficiency gain (Park; Payne & Nantz, 1994), (c) time management problems
(Lambert et al., 2003; Park, Payne, & Nantz), (d) personal values (Park; Payne & Nantz), (e) defiance or lack of respect for authority (Park), (f) negative atti-tudes toward teachers or classes (Park; Payne & Nantz), (g) temptation or opportunity (Park), (h) a lack of deter-rence (Park; Payne & Nantz), (i) a per-sonal crisis (Lambert et al.), (j) peer pressure (Payne & Nantz), and (k) a view of cheating as having a minimal effect on others (Payne & Nantz).
Effects of Academic Dishonesty
Students and universities tend to view academic dishonesty in very different ways. For students, it is evaluated pri-marily in terms of its effect on their peers, with a strong consensus that the least acceptable forms of behavior are those that hurt other students (Ashworth & Bannister, 1997). Payne and Nantz (1994) note that students saw a real dif-ference between cheating on exams (seen as blatant cheating) and other forms of cheating, such as plagiarism (seen as not really cheating). Cheating may be more likely when students feel anonymous or excluded from the acade-mic community, and are getting a low quality educational experience (Ash-worth & Bannister). In addition, “the variables that seem to facilitate cheating include increased class size, decreased surveillance, test importance and diffi-culty, close seating arrangements, and grading on a curve”(Chapman et al., 2004, p. 238).
McCabe and Trevino (1993) discuss the impact on academic dishonesty if students perceive that others will report cases of their academic misconduct. Decisions about academic dishonesty are influenced by societal and school norms and, most importantly, by the attitudes of students’ friends. However, if students see their peers successfully get away with cheating, they are more likely to cheat too (McCabe, 1999; McCabe & Trevino, 1993, 1997). In addition, business education research discusses the impact of self-interest ver-sus social-interest cheating. For exam-ple, Chapman et al. (2004) found that “students were much more likely to cheat with a friend versus an acquain-tance. Seventy-five percent of all stu-dents say they would cheat if a friend
was involved, but only 45 percent of the students would cheat with acquain-tances” (p. 243). According to Chapman et al., there is a robust false consensus effect in which students significantly overestimate the degree to which others cheat so students perceive cheating as a normative behavior and believe their own behavior is more honest than that of their peers.
A major factor affecting whether stu-dents are actually punished for cheating is faculty support for and understanding of academic integrity policies. The strength of an honor code perceived by the students varies because faculty may not even be aware of these policies and may be lax in enforcing them (McCabe & Trevino, 1997). Faculty may be lax because of the heavy time requirements of reporting, going through a university judicial process (Auer & Krupar, 2001), and concerns with court challenges of institutional disciplinary procedures (Williams & Hosek, 2003). As a result, there may be inconsistent penalties and sporadic enforcement of academic poli-cies that could impact their effectiveness (Williams & Hosek). Thus, Williams and Hosek stress the need for a deter-rence model that emphasizes prevention to reduce academic dishonesty instead of relying on punishment.
Although the Internet is a resource for both students and faculty, some teachers are concerned that students have become so used to downloading music online without paying for it, that they may not see the need to reference online material (Park, 2003); this gener-ation of students may have a different idea of what is considered fair use (Scanlon, 2004). Auer and Krupar (2001) suggest that the libertarian, free-wheeling, and antiestablishment culture of the Internet may have contributed to the increase in plagiarism because it makes illicit cutting and pasting very easy. A quarter of college students sur-veyed have plagiarized from the Inter-net, but students perceive that signifi-cantly more students than that are doing so (Scanlon). In addition, although term paper mills have existed for years, the ease of getting papers has increased with various Web sites (e.g., buypa-pers.com; Born, 2003; Park). According to Scanlon, people may be
overestimat-ing the impact of the Internet on acade-mic dishonesty, and the concern is that if students perceive that Internet cheat-ing is commonplace, they will be more likely to engage in it.
Although researchers have not con-sidered the variable of innovativeness in terms of cheating, Goldsmith (2001) found that those who scored higher on innovativeness were associated posi-tively with more hours of Internet use, greater Internet purchasing, and higher likelihood of future Internet purchase. Innovative consumers are more likely to try new technology and technological products and are more likely to engage in e-commerce (Goldsmith, 2002) com-pared with less innovative consumers. These new products may include new online term paper sites.
Although technology makes it easier for students to cheat, it also makes it eas-ier for faculty to determine if their stu-dents have plagiarized (Park, 2003). This may explain the increase in cases of plagiarism (Burnett, 2002). According to McLafferty and Foust (2004), three tools can be used to investigate Internet copy-ing: (a) search engines, (b) plagiarism Web sites (Acadmic Libraries, 2003), and (c) software that checks for identical wording between specific sources. In addition, some signs that indicate whether a student has used the Internet to plagiarize or obtain a paper include advanced jargon, hard-to-obtain materi-als listed in the bibliography, major dif-ferences in quality compared with the student’s previous writing or inconsis-tent quality of writing within the paper, unusual formatting, a paper that does not fit the topic well, unverified quotations, and invalid hyperlinks (Academic Libraries; McLafferty & Foust, 2004).
Hypotheses
The study considered a number of individual and contextual factors such as area of study, level of study, gender, GPA, and extracurricular activities that have been discussed in the literature as well as some that have not, such as employment, innovativeness and self-esteem. The research contributes to the literature by specifically comparing these factors for business versus non-business majors. Thus, we tested the following hypotheses (H):
H1: Nonbusiness students will engage in lower levels of academic dishonesty than will business students.
H2A: Graduate students will report a lower level of academic dishonesty than will undergraduate students.
H2B: The difference in academic dishon-esty between graduate business students and undergraduate business students will be significantly lower than that between nonbusiness graduate students and non-business undergraduate students.
H3A: Juniors and seniors in college will report a lower level of academic dishon-esty than will freshman and sophomore students.
H3B: The difference in academic dishon-esty between business juniors and seniors and business freshman and sophomore students will be significantly lower than that between nonbusiness juniors and seniors and nonbusiness freshman and sophomore students.
H4A: Men will have a significantly higher level of academic dishonesty than will women.
H4B: The difference in academic dishon-esty between male business students and female business students will be signifi-cantly lower than that between nonbusi-ness male students and nonbusinonbusi-ness female students.
H5A: Students with a lower GPA will report a higher level of academic dishon-esty than will students with a higher GPA.
H5B: The difference in academic dishon-esty between business students with lower GPAs and business students with higher GPAs will be lower than that between nonbusiness students with lower GPAs and nonbusiness students with higher GPAs.
H6A: Those students who are members of a Greek social organization will report a higher level of academic dishonesty than will those who are not members of a Greek social organization.
H6B: The difference in academic dishon-esty between business students who are members of a Greek social organization will be significantly lower than that for nonbusiness students who are members of a Greek social organization.
H7A: Participants devoting greater hours to employment (outside of school) will report higher levels of academic dishonesty.
H7B: The difference in academic dishon-esty between business students who have a large number of hours devoted to employment will be significantly lower than that for nonbusiness students who have a large number of hours devoted to employment.
H8A: Those students who are more tech-nologically innovative will have a higher level of academic dishonesty than will students who are less technologically innovative.
H8B: The difference in academic dishon-esty between business students who are more technologically innovative will be significantly higher than will nonbusiness students who are more technologically innovative.
H9A: Students with low levels of self-esteem will report a higher level of acad-emic dishonesty than will students with higher levels of self-esteem.
H9B: The difference in academic dishon-esty of business students with low levels of self-esteem will be significantly lower than that of nonbusiness students with low levels of self-esteem.
METHOD
Sample and Procedure
Similar to McCabe and Trevino (1997), we looked at students at multiple universities. We focused on two state universities in the southern region of the United States using convenience samples of different classes for different majors. We sent a letter requesting faculty coop-eration before the start of the semester in which the collection of data was planned so that faculty had sufficient time to plan their syllabi accordingly. This gave us an opportunity to try to attain adequate stu-dent representation from the different majors offered on the two state universi-ty campuses. We gave an instruction sheet to each faculty member who agreed to participate in the study. All instructors read the same introductory script to their students. It included: (a) the purpose of the study, (b) the amount of time it would take for the students to complete the survey instrument, and (c) reassurance as to the confidentiality and anonymity of responses.
A total of 353 students completed the survey. All students present in the classes
when the survey was handed out com-pleted the survey. The only students who did not complete the survey were those who were absent that day. If anyone had completed the survey already, they were instructed to not do so again. Thus, the researchers did not perceive an issue with nonresponse bias. In addition, there was a good balance of business (124 stu-dents) versus nonbusiness majors (177 students) surveyed. The nonbusiness majors included a variety of fields (e.g., English, math, computer science, pre-med, chemistry, anthropology). Thus the sample was a good representation of majors at the universities surveyed.
Survey Instrument
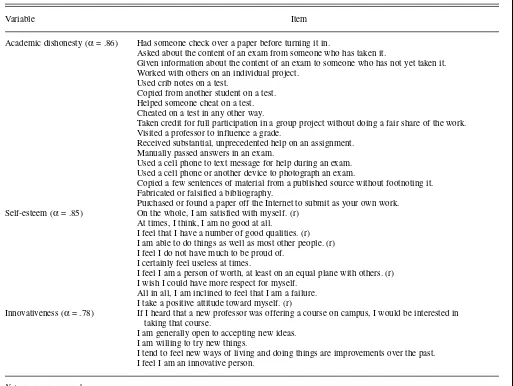
We conducted a pretest of the ques-tionnaire with 45 students, in which they provided explicit feedback as to the ease of understanding the questions, what they thought the purpose of the study was, and how long they took to complete the survey (Table 1).
We measured academic dishonesty using McCabe and Trevino’s (1993) aca-demic dishonesty scale, along with addi-tional items to address the changes in technology since that scale was initially created. Fifteen items were similar to those used by Brown (1996; 2000) and Kidwell et al. (2003). Three items addressed changes in technology: (a) using a cell phone to text message for help during an exam, (b) using a cell phone or another device to photograph an exam, and (c) purchasing or finding a paper on the Internet to submit as one’s own work. These items were included as part of the measure of academic dishon-esty that had 18 total items scaled on a 5-point scale (0 = never; 5 = many times). Although Brown (1995; 1996) did not use never because he felt infrequently
would make respondents more willing to respond, he noted that never has been used by others. McCabe and Trevino (1997) found their scale reliable (Cron-bach’s α = .83), but did not report any
exploratory or confirmatory factor analy-sis to address the dimensionality of the scale. Neither Brown (1996; 2000) nor Kidwell et al. (2003) reported any relia-bility or factor structure on the items.
Chapman et al. (2004) noted the importance of asking questions about
specific instances of academic dishon-esty as opposed to general. Swift and Nonis (1998, p. 33) found that when stu-dents were asked about cheating in gen-eral terms, 60% of the students admitted to having cheated at least once, but when the summated score for all specific forms of cheating behavior are totaled, this indicates that 87% of the students admitted to having cheated at least once. Thus, identifying specific cheating behaviors may uncover cheating better than a general question (Nonis & Swift, 1998). However, some feel that direct, self-report, measures of cheating may underestimate its frequency (Allen, Fuller, & Luckett, 1998).
Domain specific innovativeness (DSI) reflects the tendency to learn about and adopt innovations within a specific domain of interest (Goldsmith &
Hofacker, 1991). We used six studies in the development and validation of the DSI. The studies supported the internal consistency, dimensionality, and predic-tive validity of the scale. Also, the scale exhibited low correlations with a mea-sure of social desirability bias. Multitrait-multimethod (MTMM) analysis support-ed the convergent and discriminant validity of the DSI. Finally, self-esteem was measured by using a 10-item scale developed and used by Bearden and Rose (1990), Richins (1991), and Richins and Dawson (1992).
Of the 353 completed questionnaires, 301 were usable because 52 of the stu-dents in the study had an undeclared major. We deleted these respondents from the final dataset. It was not possible to obtain a sample of nonrespondents because the questionnaire was
adminis-tered by various professors and not all kept student attendance records. Fifty-six percent of respondents were women, 25% belonged to some fraternity or sorority, and 52% worked more than 20 hrs per week. Seventy-two percent were juniors or seniors in college and 11.5% were graduate students. The mean GPA of respondents was 3.0, with a standard deviation of 0.4620.
RESULTS
To test the hypotheses, we split the sample on the basis of the hypothesized variables that had an effect on academic dishonesty. We split the variables on the basis of their characteristics mentioned in the hypotheses. In cases where the characteristics of the hypothesized vari-ables were not easily defined or
parti-TABLE 1. Variables Used in the Study and Associated Reliability Coefficients
Variable Item
Academic dishonesty (α= .86) Had someone check over a paper before turning it in.
Asked about the content of an exam from someone who has taken it.
Given information about the content of an exam to someone who has not yet taken it. Worked with others on an individual project.
Used crib notes on a test.
Copied from another student on a test. Helped someone cheat on a test. Cheated on a test in any other way.
Taken credit for full participation in a group project without doing a fair share of the work. Visited a professor to influence a grade.
Received substantial, unprecedented help on an assignment. Manually passed answers in an exam.
Used a cell phone to text message for help during an exam. Used a cell phone or another device to photograph an exam.
Copied a few sentences of material from a published source without footnoting it. Fabricated or falsified a bibliography.
Purchased or found a paper off the Internet to submit as your own work. Self-esteem (α= .85) On the whole, I am satisfied with myself. (r)
At times, I think, I am no good at all.
I feel that I have a number of good qualities. (r) I am able to do things as well as most other people. (r) I feel I do not have much to be proud of.
I certainly feel useless at times.
I feel I am a person of worth, at least on an equal plane with others. (r) I wish I could have more respect for myself.
All in all, I am inclined to feel that I am a failure. I take a positive attitude toward myself. (r)
Innovativeness (α= .78) If I heard that a new professor was offering a course on campus, I would be interested in
taking that course.
I am generally open to accepting new ideas. I am willing to try new things.
I tend to feel new ways of living and doing things are improvements over the past. I feel I am an innovative person.
Note. r = reverse scored.
tioned, we tested the effects of individ-ual differences among respondents by subgroup analysis (cf. Arnold, 1982). Here, we sorted the sample in ascending order of a hypothesized variable (e.g., innovativeness, self-esteem, GPA, employment). Next, consistent with standard econometric conventions (Goldfeld & Quandt, 1965), we selected the top and bottom 35% of the cases to obtain two subgroups reflecting low and high scores of the variable (Kohli, 1989). We omitted the middle 30% of the cases to improve the contrast between the subgroups and hence the power of the subsequent statistical tests. For a detailed discussion of this proce-dure, see Johnston (1972).
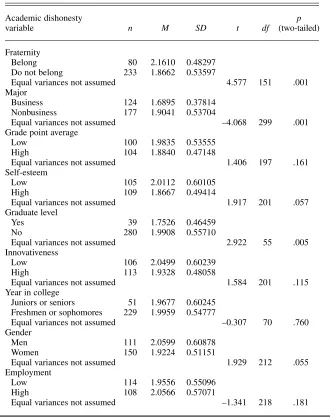
We tested all first-order hypotheses by using independent sample ttest. We tested H1on the variable major in terms of academic dishonesty. The results of the t test were significant (t = −4.068,p
< .001, Table 2). This suggests that the nonbusiness students will engage in higher levels of academic dishonesty than will business students. H1was not supported, although it was significant.
For the next hypotheses comparing levels of academic dishonesty by factors other than business versus nonbusiness, the following four hypotheses were sup-ported:H2A,H4A,H6A, and H9A. We test-ed H2A on the variable graduate level in terms of academic dishonesty. The results of the ttest were significant (t = 2.922,p< .005, Table 2). The conclusion was that the graduate students will report lower levels of academic dishonesty than will undergraduate students.
We tested H4Aon the variable gender in terms of academic dishonesty. The results of the ttest were somewhat sig-nificant (t = 1.929,p< .055, Table 2). This indicates that men will have a sig-nificantly higher level of academic dis-honesty than will women.
We tested H6Aon the variable fraterni-ty in terms of academic dishonesfraterni-ty. The results of the ttest were significant (t= 4.577,p< .001, Table 2). This suggests that students who belong to a Greek social organization will have a signifi-cantly higher level of academic dishon-esty than will students who do not belong to a Greek social organization.
Finally, we tested H9Aon the variable self-esteem in terms of academic
dis-honesty. The results of the t test were somewhat significant (t = 1.917, p < .057, Table 2). This suggests that stu-dents with low self-esteem will engage in higher levels of academic dishonesty than students with high self-esteem.
For the hypotheses comparing levels of academic dishonesty by factors other than business versus nonbusiness, the following four hypotheses were not sup-ported:H3A,H5A,H7A, and H8A. We test-ed H3Aon the variable year in college in terms of academic dishonesty. The results of the ttest were not significant (t
= −0.307,p< .760, Table 2). No strong
empirical evidence indicated significant differences between juniors and seniors, and freshmen and sophomores in terms of levels of academic dishonesty.
We tested H5Aon the variable GPA in terms of academic dishonesty. The results of the ttest were not significant (t= 1.406,p< .161, Table 2). No strong empirical evidence indicated significant differences between students with lower and higher GPAs in terms of levels of academic dishonesty.
We tested H7A on the variable employment in terms of academic dis-honesty. The results of the t test were not significant (t = −1.341, p < .181,
Table 2). The results show no strong empirical evidence of significant differ-ences between students who worked a larger number of hours outside of school and students who did not work a larger number of hours, based on levels of academic dishonesty.
TABLE 2. Results From the Independent Samples ttest Comparing
Aca-demic Dishonesty Variables
Academic dishonesty p
variable n M SD t df (two-tailed)
Fraternity
Belong 80 2.1610 0.48297
Do not belong 233 1.8662 0.53597
Equal variances not assumed 4.577 151 .001
Major
Business 124 1.6895 0.37814
Nonbusiness 177 1.9041 0.53704
Equal variances not assumed –4.068 299 .001
Grade point average
Low 100 1.9835 0.53555
High 104 1.8840 0.47148
Equal variances not assumed 1.406 197 .161
Self-esteem
Low 105 2.0112 0.60105
High 109 1.8667 0.49414
Equal variances not assumed 1.917 201 .057
Graduate level
Yes 39 1.7526 0.46459
No 280 1.9908 0.55710
Equal variances not assumed 2.922 55 .005
Innovativeness
Low 106 2.0499 0.60239
High 113 1.9328 0.48058
Equal variances not assumed 1.584 201 .115
Year in college
Juniors or seniors 51 1.9677 0.60245 Freshmen or sophomores 229 1.9959 0.54777
Equal variances not assumed –0.307 70 .760
Gender
Men 111 2.0599 0.60878
Women 150 1.9224 0.51151
Equal variances not assumed 1.929 212 .055
Employment
Low 114 1.9556 0.55096
High 108 2.0566 0.57071
Equal variances not assumed –1.341 218 .181
Finally, we tested H8Aon the variable innovativeness in terms of academic dishonesty. The results of the ttest were not significant (t = 1.584, p < .115, Table 2). No strong empirical evidence indicated significant differences between students who were less innova-tive regarding technology and students who were more innovative regarding technology in terms of their levels of academic dishonesty.
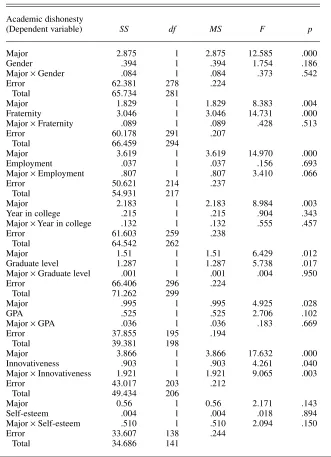
Given the results of H1that business students were not more academically dishonest than were nonbusiness stu-dents, we compared the variables noted in the literature as affecting business stu-dents versus nonbusiness stustu-dents in terms of academic dishonesty. We used a two-way analysis of variance (ANOVA) to test for the equivalence among the variables in H2Bthrough H9Bof business and nonbusiness students. The depen-dent variable was academic dishonesty. The treatment variables were graduate level (H2B), year in college (H3B), gender (H4B), GPA (H5B), fraternity or sorority (H6B), employment (H7B), innovative-ness (H8B), and self-esteem (H9B).
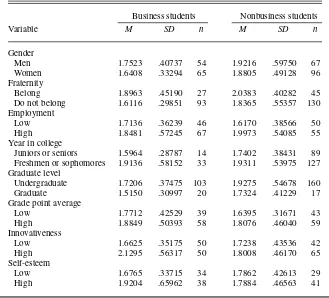
The results of the ANOVA on the main effects and the two-way interac-tions are presented in Table 3. The means and standard deviations of the various treatment variables for both the business and nonbusiness majors are presented in Table 4.
The results of the two-way ANOVA, indicated that only the variables employment (H7B) and innovativeness (H8B) had a significant effect on acade-mic dishonesty for business and non-business majors. For the variable employment, the interaction effect was somewhat significant (0.807,p< .066), which supports hypothesis (H7B) that nonbusiness students who spend more hours working will engage in higher levels of academic dishonesty than business students. This indicates that, as nonbusiness students devote more time to employment, they have less time available for academic work. Hence, they may try to seek the easy way out by engaging in academic dis-honesty.
The interaction effect for innovative-ness was significant (1.921,p< 0.003), which supports the hypothesis (H8B) that business students who are more
innovative will engage in higher levels of academic dishonesty than will non-business students. These are the busi-ness students who would be willing to try new professors or courses that are offered for the first time. Business stu-dents know that there is some room for flexibility and accommodations that will be made by the professor in the course.
For the remainder of the variables, none of the interaction effects were sig-nificant. Thus, hypotheses H2B(graduate level), H3B (juniors and seniors), H4B
(gender), H5B (GPA), H6B (fraternity), and H9B(self-esteem) were not
support-ed. We compared the main effects of these mean variables. For all the variables except self-esteem, the main effect of major was significant. For the variables, graduate level (H2B), juniors and seniors (H3B), gender (H4B), fraternity or sorority (H6B), and self-esteem (H9B), the non-business majors had higher means than did the business majors, which indicated that they engage in higher levels of acad-emic dishonesty than do business majors. This suggests that these individual and contextual factors may have a bigger impact on nonbusiness students’ levels of academic dishonesty as compared with business students. Future research is
TABLE 3. Results From the Univariate Analysis Using Two-Way Analysis of Variance (ANOVA)
Academic dishonesty
(Dependent variable) SS df MS F p
Major 2.875 1 2.875 12.585 .000
Gender .394 1 .394 1.754 .186
Major ×Gender .084 1 .084 .373 .542
Error 62.381 278 .224
Total 65.734 281
Major 1.829 1 1.829 8.383 .004
Fraternity 3.046 1 3.046 14.731 .000
Major ×Fraternity .089 1 .089 .428 .513
Error 60.178 291 .207
Total 66.459 294
Major 3.619 1 3.619 14.970 .000
Employment .037 1 .037 .156 .693
Major ×Employment .807 1 .807 3.410 .066
Error 50.621 214 .237
Total 54.931 217
Major 2.183 1 2.183 8.984 .003
Year in college .215 1 .215 .904 .343
Major ×Year in college .132 1 .132 .555 .457
Error 61.603 259 .238
Total 64.542 262
Major 1.51 1 1.51 6.429 .012
Graduate level 1.287 1 1.287 5.738 .017
Major ×Graduate level .001 1 .001 .004 .950
Error 66.406 296 .224
Total 71.262 299
Major .995 1 .995 4.925 .028
GPA .525 1 .525 2.706 .102
Major ×GPA .036 1 .036 .183 .669
Error 37.855 195 .194
Total 39.381 198
Major 3.866 1 3.866 17.632 .000
Innovativeness .903 1 .903 4.261 .040
Major ×Innovativeness 1.921 1 1.921 9.065 .003
Error 43.017 203 .212
Total 49.434 206
Major 0.56 1 0.56 2.171 .143
Self-esteem .004 1 .004 .018 .894
Major ×Self-esteem .510 1 .510 2.094 .150
Error 33.607 138 .244
Total 34.686 141
needed to determine if there are signifi-cant differences between business and nonbusiness students on these variables. The mean for business students was higher than that of nonbusiness students only for GPA (H5B) which suggests business majors engage in higher levels of academic dishonesty than do non-business majors when it is a matter of their GPA. This could be because most of the business schools require students to maintain a specific GPA or they are put on probation, or dismissed from the business school.
DISCUSSION
In several areas, the results of the study are consistent with the findings from previous studies such as McCabe and Trevino (1997), Park (2003), and Straw (2002). Support exists in general that undergraduates (H2A) who are members of fraternities (H6A) are sig-nificantly more likely to commit acad-emic dishonesty. Some support also exists that males (H4A) are more likely to cheat (Buckley et al., 1998; Lambert et al., 2003; McCabe & Trevino, 1997).
The result of H2A (that graduate stu-dents engage in lower levels of acade-mic dishonesty than do undergraduate students) is fairly intuitive because most of the students who plan to attend graduate school are the ones who sin-cerely have an interest in pursuing higher education. These students may pursue graduate studies to enhance their knowledge and seek better oppor-tunities for themselves in life as com-pared to the undergraduate students who are there to get an education only because it is the norm or what was expected of them. Likewise, the result of H6A(that students who are members of a Greek organization will engage in higher levels of academic dishonesty than will students who are not) is also intuitive.
In comparing the levels of academic dishonesty of business versus nonbusi-ness students,H1was significant, but in the opposite direction (nonbusiness stu-dents had higher levels of academic dis-honesty). While this finding is different from that of Meade (1992), Park (2003), and Pullen et al. (2000), it is similar to Brown (1996) in that business students
did not cheat more than did nonbusiness students. There are several possible rea-sons. One could be that the professors involved in the study are extremely aware of cheating problems and are more vigilant. In addition, the Associa-tion to Advance Collegiate Schools of Business (AACSB) mandates that teaching ethics is a fundamental requirement for an accredited business school (Chapman et al., 2004). Finally, the business community’s ethical prob-lems have been well documented in the news (Chapman et al.). These reasons may all have heightened the business students’ awareness of ethical issues.
In general, we found that students with low self-esteem (H9A) are more likely than are others to cheat. This could be because of the pressure to per-form well and keep up with peers in the group. The sense of acceptance or belonging to a group plays an important role for students to engage in dishonest behaviors (McCabe & Trevino, 1997).
Finally, the hypotheses that addressed year in college (H3A), GPA (H5A), employment (H7A), and innovativeness (H8A) were not supported in this study. For year in college, although researchers claim juniors and seniors cheat less than do freshmen and sophomore (McCabe & Trevino, 1997; Park, 2003; Straw, 2002), the nonsignificant result in the present study may be because the sample con-tained a majority of juniors and seniors. For GPA, although Straw suggests that students with lower GPAs cheat more, in this sample, there may not have been a big range in the average GPA of the stu-dents. Although researchers have not dis-cussed employment, the nonsignificant result may be because the majority of the sample worked over 20 hrs per week. Additional research with different institu-tions may be needed to determine if there is support for these hypotheses. Finally, for innovativeness, the researchers have not considered innovativeness in terms of negative behaviors (i.e., cheating), thus more research is also needed in this area.
In terms of the differences between business and nonbusiness students, this research makes a significant contribu-tion to the literature by examining how some of the individual and contextual variables noted by McCabe and Trevino (1997), along with some additional
indi-TABLE 4. Means and Standard Deviations of Academic Dishonesty Vari-ables for Business and Nonbusiness Students
Business students Nonbusiness students
Variable M SD n M SD n
Gender
Men 1.7523 .40737 54 1.9216 .59750 67
Women 1.6408 .33294 65 1.8805 .49128 96
Fraternity
Belong 1.8963 .45190 27 2.0383 .40282 45
Do not belong 1.6116 .29851 93 1.8365 .55357 130
Employment
Low 1.7136 .36239 46 1.6170 .38566 50
High 1.8481 .57245 67 1.9973 .54085 55
Year in college
Juniors or seniors 1.5964 .28787 14 1.7402 .38431 89 Freshmen or sophomores 1.9136 .58152 33 1.9311 .53975 127 Graduate level
Undergraduate 1.7206 .37475 103 1.9275 .54678 160
Graduate 1.5150 .30997 20 1.7324 .41229 17
Grade point average
Low 1.7712 .42529 39 1.6395 .31671 43
High 1.8849 .50393 58 1.8076 .46040 59
Innovativeness
Low 1.6625 .35175 50 1.7238 .43536 42
High 2.1295 .56317 50 1.8008 .46170 65
Self-esteem
Low 1.6765 .33715 34 1.7862 .42613 29
High 1.9204 .65962 38 1.7884 .46563 41
vidual variables not really addressed in the academic dishonesty literature, (innovation and self-esteem) impact business students versus other nonbusi-ness students.
In terms of employment, generally the number of hours worked did not make an impact on levels of academic dishonesty. The results of the study revealed that nonbusiness students who devoted a large number of hours to employment will engage in higher lev-els of academic dishonesty than busi-ness students who devoted a large num-ber of hours to employment. However, it did so for nonbusiness students (H7B
was somewhat supported). This might be because nonbusiness students worked a greater range of number of hours than did business students. How-ever, additional research is needed in this area.
In general, while innovativeness did not make an impact on levels of acade-mic dishonesty, there was a significant difference between business and non-business students (H8Bwas supported). Innovative business students will engage in higher levels of academic dis-honesty than will noninnovative busi-ness students. In busibusi-ness courses, stu-dents are required to have strong technological skills, and those business students who like to be innovative by trying new tasks may be applying this to both positive, as well as negative inno-vations. This would suggest that profes-sors may want to keep an eye out for those students who are innovative and willing to try new tasks. These may be the students who use their technological skills to try to cheat, but additional research is needed to confirm this link.
For the other variables, although the results were not statistically significant, they do suggest that the individual and contextual variables of graduate level, year in college, gender, being a member of a Greek organization, and self-esteem had a bigger impact on the levels of aca-demic dishonesty for nonbusiness stu-dents than it did for business stustu-dents. The variable of GPA had a bigger impact on business students as compared with nonbusiness students, which suggests that the GPA requirements existing for business schools (such as the ones included in the sample) may influence
students’ level of academic dishonesty. More research, with larger samples of students from a variety of universities, to see if these relationships hold and if they are significant is needed.
With this research, we aim to help business professors by giving them a better understanding of which business students may be more likely to engage in academic dishonesty. In general, stu-dents who are members of Greek social organizations, nonbusiness majors, undergraduates, male, and have low self-esteem typically engage in higher levels of academic dishonesty than do other students. In looking at business students more specifically, these pat-terns may not hold. The level of innov-ativeness plays a bigger role. In addi-tion, GPA (and GPA requirements) may also play a role in business stu-dents’ level of academic dishonesty. Thus, business professors need to take care to not assume that certain types of students are more likely to cheat. The findings may encourage and help fac-ulty be more vigilant about academic dishonesty.
NOTE
Correspondence concerning this article should be addressed to Jacqueline K. Eastman, Professor of Marketing, Department of Marketing and Eco-nomics, Harley Langdale Jr. College of Business Administration, Valdosta State University, Valdos-ta, GA 31698.
E–mail: [email protected]
REFERENCES
Academic Libraries. (2003). Academic librarians launch a strategic campaign. Academic Libraries, 34,44–45.
Allen, J., Fuller, D., & Luckett, M. (1998). Acad-emic integrity: Behaviors, rates, and attitudes of business students toward cheating. Journal of Marketing Education, 20,41–52.
Arnold, H. J. (1982). Moderator variables: A clar-ification of conceptual, analytic, and psycho-metric issues. Organizational Behavior and Human Performance, 29,143–174.
Ashworth, P., & Bannister, P. (1997). Guilty in whose eyes? University students’ perceptions of cheating and plagiarism in academic work and assessment. Studies in Higher Education, 22, 187.
Auer, N. J., & Krupar, E. M. (2001). Mouse click plagiarism: The role of technology in plagia-rism and the librarian’s role in combating it. Library Trends, 49,415–432.
Bearden, W. O., & Rose, R. L. (1990). Attention to social comparison information: An individual difference factor affecting consumer conformity. Journal of Consumer Research, 16,461–71.
Born, A. D. (2003). How to reduce plagiarism. Journal of Information Systems Education, 14, 223.
Brown, B. S. (1995). The academic ethics of grad-uate business students: A Survey. Journal of Education for Business, 70,151–157. Brown, B. S. (1996). A comparison of the
acade-mic ethics of graduate business, education, and engineering students. College Student Journal, 30,294–301.
Brown, B. S. (2000). The academic ethics of grad-uate business students: 1993 to 1998. The Jour-nal of Applied Business Research, 16,105–112. Buckley, M. R., Wiese, D. S., & Harvey, M. G. (1998). An investigation into the dimensions of unethical behavior. Journal of Education for Business, 73,284–290.
Burnett, S. (2002), Dishonor & distrust. Commu-nity College Week, 14,6.
Chapman, K. J., Davis, R., Toy, D., & Wright, L. (2004), Academic integrity in the business school environment: I’ll get by with a little help from my friends. Journal of Marketing Educa-tion, 26,236–249.
Goldfeld, S. M., & Quandt, R. E. (1965). Some tests for homoscedasticity. Journal of American Statistical Association, 60,539–547.
Goldsmith, R. E. (2001). Using the domain specific innovativeness scale to identify innovative Inter-net consumers. Internet Research, 11,149–158. Goldsmith, R. E. (2002). Explaining and
predict-ing consumer intention to purchase over the Internet: An exploratory study. Journal of Mar-keting Theory and Practice, 10,22–28. Goldsmith, R. E., & Hofacker, C. (1991).
Measur-ing consumer innovativeness. Journal of the Academy of Marketing Science, 19,209–221. Isserman, M. (2003). Plagiarism: A lie of the
mind. Chronicle of Higher Education, 49,B12. Johnston, J. (1972). Econometric methods. New
York: McGraw-Hill.
Kidwell, L. A., Wozniak, K., & Laurel, J. P. (2003). Student reports and faculty perceptions of academic dishonesty. Teaching Business Ethics, 7,205–214.
Kohli, A. K. (1989). Effects of supervisory behav-ior: The role of individual differences among salespeople. Journal of Marketing, 53,40–50. Kuther, T. L. (2004). A profile of the ethical
pro-fessor. College Teaching, 51,153–160. Lambert, K. D., Ellen, N., & Taylor, L. (2003).
Cheating – What is it and why do it: A study in New Zealand tertiary institutions of the percep-tions and justificapercep-tions for academic dishonesty. Journal of American Academy of Business, 3,98. Leming, J. S. (1980). Cheating behavior, subject variables, and components of the internal exter-nal scale under high and low risk conditions. Journal of Educational Research, 74,83–87. McCabe, D. L. (1999). Academic dishonesty
among high school students. Adolescence, 34, 681–687.
McCabe, D. L., & Trevino, L. K. (1993). Acade-mic dishonesty: Honor codes and other contex-tual influences. Journal of Higher Education, 64,520–538.
McCabe, D. L., & Trevino, L. K. (1997). Individ-ual and contextIndivid-ual influences on academic dis-honesty. Research in Higher Education, 38, 379–396.
McLafferty, C. L., & Foust, K. M. (2004). Elec-tronic plagiarism as a college instructor’s
mare – Prevention and detection. Journal of Education for Business, 79,186–189. Meade, J. (1992). Cheating is academic
dishon-esty par for the course. Prism, 1,30–32. Nonis, S. A., & Swift, C. O. (1998). Deterring
cheating behavior in the marketing classroom: An analysis of the effects of demographics, atti-tudes, and in-class deterrent strategies. Journal of Marketing Education, 20,188–199. Park, C. (2003). In other (people’s) words:
Plagia-rism by university students—literature and lessons. Assessment & Evaluation in Higher Education, 28,471–488.
Payne, S. L., & Nantz, K. S. (1994). Social accounts and metaphors about cheating. Col-lege Teaching, 42,90.
Pullen, R., Ortloff, V., Casey, S., & Payne, J. B. (2000). Analysis of academic misconduct using unobtrusive research: A study of discarded cheat sheets. College Student Journal, 34,616. Rawwas, M. Y. A., Al–Khatib, J. A., & Vitell, S. J. (2004). Academic dishonesty: A cross-cultural comparison of U.S. and Chinese marketing stu-dents. Journal of Marketing Education, 26, 89–100.
Richins, M. L. (1991). Social comparison and the idealized images of advertising. Journal of Consumer Research, 18,71–83.
Richins, M. L., & Dawson, S. (1992). A consumer values orientation for materialism and measure-ment: Scale development and validation. Jour-nal of Consumer Research, 19,303–316.
Scanlon, P. M. (2004). Student online plagiarism: How do we respond. College Teaching, 51,161–165. Straw, D. (2002). The plagiarism of generation
“why not?”Community College Week, 14,4–7. Swift, C. O., & Nonis, S. (1998). When no one is watching: Cheating behaviors on projects and assignments. Marketing Education Review, 8, 27–36.
Taylor, K. R. (2003, November). Bracing for cheating and plagiarism. Retrieved November 6, 2006, from http://pqasb.pqarchiver.com/ eddigest/results.html?st=basic&QryTxt= Bracing+for+ cheating+and+plagiarism Williams, M. S., & Hosek, W. R. (2003).
Strate-gies for reducing academic dishonesty. Journal of Legal Studies Education, 21,87.