T H E J O U R N A L O F H U M A N R E S O U R C E S • 47 • 2
Induced Innovation and Social
Inequality
Evidence from Infant Medical Care
David M. Cutler
Ellen Meara
Seth Richards-Shubik
A B S T R A C T
We develop a model of induced innovation that applies to medical re-search. Our model yields three empirical predictions. First, initial death rates and subsequent research effort should be positively correlated. Sec-ond, research effort should be associated with more rapid mortality de-clines. Third, as a byproduct of targeting the most common conditions in the population as a whole, induced innovation leads to growth in mortality disparities between minority and majority groups. Using information on in-fant deaths in the United States between 1983 and 1998, we find support for all three empirical predictions.
I. Introduction
Technological change is a source of substantial aggregate welfare improvements. Several studies suggest that technological change accounts for up to a third of aggregate economic growth (Jorgenson 2000). Yet overall welfare gains do not imply equal benefit for all individuals. If technological change is biased
David M. Cutler is the Otto Eckstein Professor of Applied Economics at Harvard University and a re-search associate at the National Bureau of Economic Rere-search. Ellen Meara is an associate professor at the Dartmouth Institute for Health Policy and Clinical Practice and a faculty research fellow at the National Bureau of Economic Research. Seth Richards-Shubik is an assistant professor of Economics and Public Policy at Carnegie Mellon University. This work was supported by funding from the Russell Sage Foundation and the National Institute on Aging. The authors gratefully acknowledge detailed ments from Ciaran Phibbs regarding an earlier draft of this paper. They received many helpful com-ments seminar participants and discussants at Harvard, the Mailman School of Public Health, and at meetings of the American Economic Association and the American Society of Health Economists. The data used in this article can be obtained at http://www.nber.org/data. They can also be obtained begin-ning October 2012 through September 2015 from Seth Richards-Shubik, H. John Heinz III College, Car-negie Mellon University, 5000 Forbes Ave, Pittsburgh, PA, 15213-3890; sethrs@andrew.cmu.edu. [Submitted February 2011; accepted June 2011]
toward some industries or groups, some parts of the population will benefit more than others.
In this paper, we investigate biased technological change using a particular ex-ample—medical technology for treating at-risk infants. Infant mortality provides a useful setting to learn about induced innovation because the outcome is easy to measure (deaths) and disparities in outcomes are so widely noted. Further, there has been enormous technological progress. In the early 1960s, about 25 of every 1,000 infants died before their first birthday, most before leaving the hospital. Much of this death was in premature infants—infants born before normal gestation, and typ-ically low birth weight, or under 2,500 grams.
The situation of newborns dying so young created a moral imperative to reduce those deaths. In 1963, the highly publicized death of John F. Kennedy’s infant son, Patrick, two days after his premature birth at 34 weeks attracted further attention to the magnitude of deaths to infants. Clinicians treating infants began to innovate, starting what would spur the development of neonatal intensive care units (NICUs) (Baker 1996; Anspach 1997). Grant money followed, and physicians and scientists became energized. Treatment progress was impressive. In the five decades since 1960, mortality for low-birth-weight babies declined 70 percent, almost entirely as a result of improved medical care (Cutler and Meara 2000).
458 The Journal of Human Resources
The paper is structured as follows. The next section presents a conceptual frame-work of induced innovation in medicine that shows why research would be allocated to more common diseases and how induced innovation could increase disparities in health outcomes. The third section describes infant mortality trends in recent decades and presents a case study of a particular cause of death, RDS. Section IV presents the data, and Section V empirically tests for induced innovation. Section VI then translates these estimates into the social consequences of induced innovation. The last section concludes.
II. Induced Innovation and Medical Technology
In this section, we use a simple framework to explore how the ob-vious and painful suffering of people near death could lead to technological change, and how technological change might affect different population groups. Ultimately, the implications of the model will mirror those in standard models of induced in-novation, but the medical care sector differs from other markets in important ways. Most hospitals are not-for-profit, and much innovation is done by independent, uni-versity-based researchers supported by public funds. Second, the end consumers of medical innovation, patients, are insured against the marginal cost of these innova-tions at the point of service, making a standard willingness to pay framework in-appropriate. This is particularly true in the case of acute care for critically ill infants, compared with, for example, pharmaceuticals for adults with chronic conditions. For these reasons we consider a conceptual framework that is salient to our application, in which humanitarian need rather than profit drives innovation.
A significant body of recent research has considered models of endogenous in-novation. In most of these models, innovation is posited to respond to profits—either greater demand for some industries (Schmookler 1966; Romer 1990; Grossman and Helpman 1991; Aghion and Howitt 1992; Kremer 2002; and Acemoglu and Linn 2004) or differential factor costs (as in Newell, Jaffee, and Stavins 1999; Popp 2002). We posit an alternative framework in which humanitarian desire to improve health drives innovation. Lichtenberg (2001) and Bhattacharya and Packalen (2008) simi-larly model the allocation of public spending and innovation in the nonprofit sector. For simplicity, we consider the setting we employ in our empirical analysis: sur-vival of low-birth-weight infants. We consider a set of diseases that might result in death, abstracting from quality of life. Let the mortality rate for a particular diagnosis
i at a point in timet be denoted t. We consider two periods, a base period
di t= 0
and a later period t= 1, where individuals from time 0 are no longer at risk. The aggregate death rate (which is for the entire at-risk population at periodt) is given
by , wherenis the number of distinct diseases. n
t t
D =
∑
di i= 1Medical research on a particular condition will improve survival according to a (probabilistically) known innovation possibility function. We model this as a function , that converts research between Periods 0 and 1 into a survival probability at
fi(ri)
death rate for condition i at time 1 is then d1=d0 0 , and the aggregate
Note that this formulation assumes no spillovers across diseases—that is, research conducted on one disease affects mortality only for that condition. We argue later that this assumption is conservative in our setting.
We consider a social planner wishing to maximize social welfare. This might be the NIH, which funds a large share of basic biomedical research, or university re-searchers on their own, thinking about valuable projects to explore. The social plan-ner wishes to minimize mortality in period 1, with a total research budget fixed at
R. Thus the planner would allocate research across diseases to solve the following problem:
Equation 2 states that the expected marginal benefit of research should be the same across all diseases.1Provided thef functions are not too different across
con-i
ditions, this means that more common diseases deserve research that is less produc-tive on the margin, and thus get more research funding.2 The assumption that the
research productivity functions are similar across conditions is conservative when it comes to our empirical analysis, which tests the relationship between initial death rates and subsequent research funding. To the extent that more common diseases have seen greater research prior to the initial time period and therefore have lower expected research productivity, the correlation betweend0andr*would be reduced.
i i
Disparities in health outcomes will be related to research innovation. Because more medical research is done for more common diseases, the socially optimal allocation of research dollars will tilt toward diseases that are relatively more com-mon in larger population groups.
To see this, consider the case where there are two groups, a majority group, a, and a minority group,b(in our empirical example, whites and blacks). Let the initial death rates per condition for two groups be d0 andd0 and their respective sums
a,i b,i
across conditions be D0 andD0. At time 1, the death rates are given by
a b
1 0 1 0
da,i=da,i•(1−fi(ri)) and db,i=db,i•(1−fi(ri)),
and the mortality ratio at each time is given by Dt/Dt. This ratio increases over b a
time ifD1/D0>D1/D0, which in our model expands to
b b a a
1. The social planner does not distinguish among population groups, but simply counts the total number of deaths or the aggregate death rate. Thus research is allocated according to the initial prevalence and deadliness of the disease throughout the entire population.
460 The Journal of Human Resources
Thus the mortality ratio rises when increases in survival probabilities(fi(ri)) are correlated with higher initial shares of deaths per condition among the majority group
.3
Such a correlation can be present for several reasons. The difference in the initial shares of deaths attributed to a given condition across groups may arise because a particular disease is more prevalent in the majority population than in the minority population, or more fatal for the majority group. For example, among infants born prematurely, black infants tend to have less severe illness than do white infants along a number of dimensions, holding gestation constant (Hulsey et al. 1993; Richardson and Torday 1994). In particular, at any given gestation, black infants are less likely to have RDS, and, on illness severity measures, black infants score better than whites even given the presence of a condition like RDS (Hulsey et al. 1993; Richardson and Torday 1994). Thus, death rates from RDS historically were greater among whites than among blacks, even within narrow birth weight categories. As a result, research on RDS will disproportionately benefit whites over blacks. Thus, if research favors common causes of death, we can expect (fi(ri)) to be positively correlated with higher death rates in a majority group.
In this model, the increasing disparity occurs as a consequence of the differences in population sizes, not because deaths are valued differently by the social planner. To see this more formally, consider two diseases, one with a greater prevalence among whites and the second with a greater prevalence among blacks. Lete0be the
1
prevalence of Disease 1 among whites in the base period, andθe0be the prevalence
1
among blacks, whereθ< 1. Conversely, lete0be the prevalence of Disease 2 among
2
blacks andθe0be the prevalence among whites. To simplify notation, suppose that
2
each case of the disease is fatal, so that death rates are equal to prevalence rates.
The overall mortality rate from Disease 1 is , where and
0 0
e N1 a+θe N1 b
0
d1= Na
Na+Nb
are the number of white and black births respectively. Similarly, the mortality
Nb
rate for Disease 2 is . Combining these mortality rates with
Equa-0 0
θe N2 a+e N2 b
0 d2=
Na+Nb
tion 2 gives a formula for the marginal product of research on each disease in equilibrium:
0
f1′(r1) e2 θNa+Nb
= •
(5)
( ) (
1)
f2′(r2) e0 Na+θNb
If θ< 1 andNa>Nb, the second expression on the righthand side of Equation 5 is less than 1, and hence the overall expression on the righthand side is less than the ratio of disease incidence in the two groups. As a result, Disease 1 should receive relatively greater funding than if the populations were the same, with the disparity rising as the population disparity rises.
The induced innovation hypothesis yields several predictions, which we test in the empirical section of the paper. First, our model implies that initial death rates and subsequent research effort should be positively correlated. Second, innovation should be associated with more rapid mortality declines. Third, as a result, induced innovation leads to growth in mortality disparities between minority and majority groups when there are differences between them in the shares of deaths due to leading causes. We illustrate these hypotheses and their implications as they relate to infant mortality and neonatal medicine.
III. Background on Infant Mortality and Neonatal
Medicine
Infant mortality, or death during the first year of life, used to be much more common than it is today. In 1915, for example, infant mortality was 150 babies per 1,000 born alive. With improved nutrition and advances in public health, that rate fell to 26 per 1,000 in mid-century.
The latter half of the 20th century witnessed continued declines in infant mortality. Figure 1 demonstrates that white infant mortality rates fell from 26 deaths per 1,000 live births in 1950 to 5.6 in 2007. Black infants experienced higher rates of mortality at every point in time, but infant mortality fell dramatically for blacks as well, from 43.9 deaths per 1,000 live births in 1950 to 13.2 deaths per 1,000 births in 2007. The economic value of this improvement is immense. Using the common estimate of $7 million per life, the value of reduced mortality is roughly $215,000 per black birth and $143,000 per white birth. With about 3 million black and white births per year in the United States, this translates to roughly $550 billion per year.
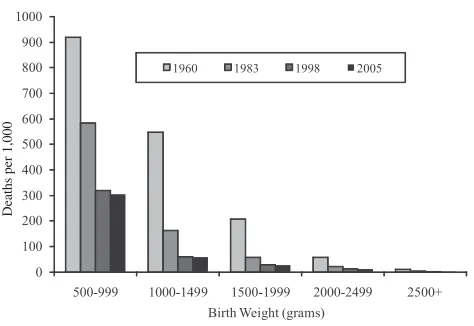
A good share of the reduction in infant mortality in the past half century has come from reduced mortality of low-birth-weight infants, consistent with the con-centration of deaths among babies born with low birth weight. In 2005, nearly 70 percent of infant deaths occurred among the 8 percent of babies born weighing less than 2,500 grams. Figure 2 depicts the gain in survival by birth weight. Mortality for the lightest infants (500–999 grams) fell from nearly 90 percent in 1960 to 30 percent in 2005. Mortality among infants weighing 1,000 to 1,499 grams fell from 50 percent to below 10 percent. More than half of improved survival for all infants between 1960 and 2005 was a result of lower mortality in low-birth-weight infants.4
462 The Journal of Human Resources
Deaths per 1,000 Mortalit
y
Ratio
50 2.70
Figure 1
Infant Mortality by Race, 1950–2007
Source: Vital Statistics of the United States, accessed April 28, 2011 at http://www.cdc.gov/nchs/nvss/ mortality_tables.htm.
Deaths per 1,000
Figure 2
Infant Mortality by Birth Weight, 1960, 1983, 1998, and 2005
Source: Data are from the National Vital Statistics System, Linked Birth and Infant Death Data,various years, accessed April 29, 2011 at http://www.cdc.gov/nchs/linked.htm.
Unlike early in the century, when improved nutrition and public health were the keys to improved survival, advances in medical care were much more important in the last few decades. Low-birth-weight infants die of many causes, but respiratory-related conditions and congenital anomalies are particularly important. Among the very lightest, or very low-birth-weight births ( < 1,500 g), respiratory-related con-ditions were the most common cause of death in 1980. An infant’s lungs do not develop the capacity to transfer oxygen into the blood until about 23 to 25 weeks of gestation, and even after that time, breathing difficulties are common. In the 1970s and 1980s, RDS and the related bronchopulmonary dysplasia, which often resulted as a consequence of treatment with ventilators, were the primary causes of mortality among very weight infants, and an important condition for low-birth-weight infants. At that time, RDS caused about 10,000 deaths per year. A major part of medical care for premature infants is helping them breathe. Other major causes of infant death include SIDS, congenital anomalies (especially heart defects), infections, and pneumonia.
Starting in the 1960s and continuing today, neonatal intensive care emerged as a field of medicine to treat those conditions. Neonatal intensive care embodies hun-dreds of small innovations often adopted from care for adults, but adapted to very light infants. The innovations range from improving the technology for ventilation, improving the ability to monitor newborn blood and respiratory function, to the development of synthetic surfactant that can be administered to infants with RDS. These innovations do not guarantee survival, but they increase its chances. Cutler and Meara (2000) show that improved care during the neonatal period for critically ill infants collectively accounted for essentially all of the reduction in neonatal mor-tality in the three decades after 1960.
Even as overall infant mortality fell from 1950 on, the ratio of black to white infant death rates rose. In 1950, the ratio of black to white infant mortality was about 1.6. In the early 1980s, it was just above 2.0. By the late 1990s, the ratio was about 2.5. The increase in this ratio has been widely noticed. The U.S. government’s Healthy People 2010 initiative has called for the elimination of racial disparities in health outcomes. Yet the most prominent indicator of racial inequality is moving adversely to these goals. As a result, there has been a good deal of focus on how to improve black infant outcomes (Agency for Healthcare Research and Quality (AHRQ) 2001; AHRQ 2008; Howell 2008).
464 The Journal of Human Resources
biased technological progress. In the conceptual and empirical framework that fol-lows, we focus on birth weight-specific survival for two reasons. First, controlling for birth weight holds constant the large set of nonmedical factors that influence a baby’s health at birth, such as the mother’s environment, underlying health endow-ment, health investments, and propensity to seek prenatal care prior to the birth. Second, neonatologists, from whom major advances sprung during our period of study, tend to see only a very specific set of infants, those born prematurely. It is possible to end up in a NICU when born at a normal birth weight, but it is rare. Thus, neonatologists form their views regarding the diseases of import based on the overall population they see on a daily basis, which in practice is similar along the dimension of birth weight.
A. An Example: Respiratory Distress Syndrome
To understand the effects we analyze, consider the specific example of RDS.5
Some-where between 24 and 28 weeks of gestation, a healthy, developing fetus begins to produce surfactant. The role of surfactant is to help keep the lung sacs, or alveoli, open. Without ample surfactant, the alveoli collapse during breathing, causing dam-aged cells to collect in airways, and impeding breathing ability. Death is a frequent result. By 35 weeks gestation, most babies have developed enough surfactant to maintain appropriate surface tension in lung airways. Between 24 weeks and 35 weeks (approximately), infants are at decreasing risk of death from RDS.
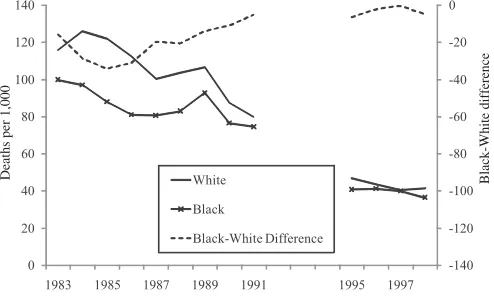
The first observations about the biological process of RDS were made as early as 1903. However, it was not until after 1950 that surfactant was discovered in lung extracts and eventually connected to what is now known as RDS. Between the late 1950s and the early 1990s, a wave of government, industry, and academically spon-sored research helped to uncover the treatments for RDS. The first scientists exper-imented in uncontrolled settings and reported the use of animal surfactant from rabbits and cows. This early research, reported by 1980, spurred other researchers to launch controlled clinical trials using animal surfactant. Synthetic surfactant was developed later on, with continuing trials to determine the appropriate timing of treatment and optimal delivery of the drug. The effort was immense; an estimated 30,000 infants across North America, Europe, and Japan were enrolled in clinical trials of surfactants by 1990. The results of a subset of these, over 35 randomized controlled trials of 6,000 infants, have been reported. The FDA approved the first synthetic surfactant, Exosurf, in August of 1990, greatly expanding the access of eligible infants (premature infants), to surfactant.6Figure 3 shows the resulting trend
in RDS mortality. To hold constant need, we present RDS mortality for two specific weight ranges: 500–999 grams, and 1,000–1,499 grams. These ranges correspond to the greatest respiratory impairment.
5. A review by Clements and Avery (1998) characterized the progress leading to modern day treatment for RDS in detail.
Deaths per 1,000
Deaths per 1,000
Black-White difference
Black-White difference
Figure 3
The RDS Example—Infant Mortality by Race and Birth Weight
466 The Journal of Human Resources
Although most infants would not have access to surfactant before its approval in 1990, because surfactant was so promising, a significant share of very low-birth-weight babies were enrolled in clinical trials of the drug before its approval in 1990. Thus, the decline in RDS mortality in the late 1980s is likely due to surfactant, although the approval of surfactant in 1990 coincided with a further immediate decline in death rates and a continuing decline over the next few years.7Between
1983 and 1998, RDS-related mortality for black and white babies combined fell 63 percent among those weighing 500 to 999 grams, and by 87 percent among those weighing 1,000 to 1,499 grams. Because RDS was more important for white babies than black babies, however, the reduction in RDS mortality led to significantly greater survival improvements for whites than for blacks. Thus, even with equal declines in mortality across racial groups, there was an increase in the racial gap in outcomes.
IV. Data
To understand the sources of innovation in infant medical care, and the consequences of those innovations, we use data on mortality by race and cause, and on medical innovation. We describe the sources in turn. The mortality data we employ come from cohort linked birth / infant death (LBID) files produced by the National Center for Health Statistics (NCHS, various years). These files contain a nearly universal sample of births and infant deaths in the United States, formed by compiling data from birth and death certificates.8Deaths that occur within one year
of birth are matched back with their birth certificates to create the linked records. The files are organized by annual, calendar year birth cohorts, so deaths may be from the same year or the following year as long as they occur within 365 days of birth.
The earliest LBID data is from 1960. However, only published tabulations of those data exist, and the published tabulations do not have the detail we need. The next year of linked data are from 1983, and are available in micro data. We thus use data from 1983–85 as our early time period.9Although we selected this initial
period out of necessity, in practice, innovation that improved neonatal outcomes of premature infants progressed relatively slowly between the 1960s and 1983, as the major innovations during this time period were restricted to improvements in me-chanical ventilation to minimize damage to the fragile lungs of premature infants. Fortunately, changes in infant mortality were ongoing in this time period, and the profile of deaths by cause in 1983–85 is similar to that for 1960. As Figure 2 shows, mortality among low-birth-weight infants roughly halved between 1983 and 1998. Changes in the coding of cause of death from the ICD-9 to the ICD-10 after 1998
7. An additional innovation that contributed to rapid reductions in mortality for the lightest infants was antenatal corticosteroid therapy, used to help speed maturation for fetuses likely to be very premature. In 1994, the NIH issued a consensus statement compiling the evidence supporting its use to prevent infant mortality, RDS, and related neonatal outcomes (NIH 1994).
8. In 1983 and 1984, some states created records for only half of births, randomly selected, but all deaths were entered. Birth records have weights to adjust for the sampling.
led to substantial differences in cause-specific death rates among low-birth-weight births, so our later time period uses data from 1996–98. For example, the recorded RDS death rate among births 500–999g dropped by 22 percent from 1998 to 1999, and the recorded SIDS death rate among births 2000–2499g dropped by 23 percent, yet there are no apparent clinical explanations for such large drops. This change in available data precluded analysis of trends after 1998.
From the LBID records, we use information on birth weight, the mother’s race and Hispanic ethnicity, singleton or plurality of birth, and the underlying cause of death. We include births only to black or white mothers, excluding births to Hispanic mothers to limit the effect of increasing immigration over time. We further exclude plural births to limit the effect of secular changes in multiple births due to fertility treatment and a contemporaneous rise in maternal age, which increases the risk of multiple births (Blondel and Kaminski 2002).
Summary statistics for the mortality data are shown in Table 1. In 1983–85, the infant mortality rate for whites was 8.2 per 1,000 births versus 17.1 per 1,000 births among blacks, yielding a black-white ratio of 2.09. Because 84 percent of births are to white mothers, excluding Hispanics and other races, there are many more white deaths than black deaths. More than 70 percent of infant deaths are among white infants.
The next column of the table shows the substantial reduction in infant mortality over time. The infant mortality rate for whites fell by 37 percent between 1983–85 and 1996–98; the comparable reduction for blacks was 23 percent. As a result, the black-white infant mortality ratio rose to 2.4, a 30 percentage point increase.
Our model does not address changes in the birth-weight distribution over time. We thus purge from the increase in the black-white mortality ratio the contribution of unequal changes in birth weight by race. The fourth column of Table 1 shows a simulation of infant mortality rates in 1996–98 if the race-specific distributions of births by 500 gram intervals had not changed over the time period.10In both cases,
infant mortality rates would be lower, reflecting a trend toward more low-birth-weight infants over time. But the changes are not large. Relative to the 30 percentage point increase in the unadjusted black-white infant mortality ratio, the adjusted in-crease is 21 percentage points.
In the final column, we modify the simulation further to give both races the same percent reduction in deaths for each cause within 500 gram weight groups, using the reductions experienced by whites. This eliminates changes in mortality ratios that would arise due to differential reductions in mortality for a given cause, for example because take-up of technology or access to care differs. The only reason mortality changes differ in Column 5 is because the causes of death differ for black and white babies, and relatively more progress is made on some causes of death. This simulation implies a 12 percentage point increase in the black-white ratio of infant mortality. It is this aspect of rising mortality ratios, the part that arises from induced innovation, that we will explore with the model and empirical analysis that
10. We hold the weight distribution constant for each race as follows. Lets0 be the share of births for
rw
racerof weightwin the initial period, and t be the death rate within that weight group at timet. The drw
adjusted death rates are∑ s d0 1, or∑ s d0 1 for cause-specific death rates.
rw rw rw riw
468
The
Journal
of
Human
Resources
Table 1
Actual and Simulated Change in Racial Disparity
1983–85 1996–98
Share of Births (percent)
Infant Mortality Rate
Actual Infant Mortality Rate
Holding birth weight constant
Holding birth weight constant and
equal change in cause-specific mortality rates
Race (1) (2) (3) (4) (5)
White 84 8.2 5.2 5.0 5.0
Black 16 17.1 12.4 11.4 11.0
Black/white ratio 2.09 2.40 2.30 2.21
Change in ratio 0.30 0.21 0.12
follow. The remainder between the 21 percentage point growth in black-white mor-tality ratios and this 12 percentage point increase, or nine percentage points, repre-sents changes that occurred because of differential reductions in cause-specific mor-tality. That is, for some causes of death, the rate at which infant deaths fell was faster for whites than for blacks. For example, SIDS deaths declined rapidly after the 1994 “back to sleep” campaign encouraged parents to put infants to sleep on their backs. Differential adoption of this practice led to a two-fold difference in rates of “back sleeping” between black and white mothers (Broussard, Sappenfield, and Goodman 2011).
The greater reductions in cause-specific mortality for whites may relate to several underlying factors. If a disease manifests itself differently among white versus black infants, then efficacy of treatment may vary across races because induced innovation focuses more on the majority group, whites. In our model, we have assumed that this is not the case, and that research improves survival in identical ways across races. If differential efficacy of treatments occurs, then we have underestimated the role of induced innovation by ignoring this portion of the rising mortality ratio, because we have no way to disentangle this from two other potential sources of differential survival gains: access and quality of care. Differences in survival gains might also reflect differential access to care, or differential quality of care conditional on access. These latter two explanations do not relate to induced innovation.
A. Causes of Death
For each infant who dies, the LBID data report an underlying cause of death. We use this to calculate death rates for specific conditions, separately by race. The causes of death are grouped into categories based on an NCHS categorization of the Inter-national Classification of Diseases—9th Revision(ICD-9) codes (the 61 Cause Re-code); the Appendix has details, including a full list of the condition categories. After making adjustments to the causes, we identified 69 independent conditions, and one residual category.
Death rates by leading cause of death are shown in Table 2a. To highlight the role of differing causes within birth weights, we show mortality rates as if blacks and whites had the same distribution of births in each weight category. The 14 conditions listed in the table account for half of all infant deaths in 1983–85. The top three causes, SIDS, RDS, and congenital heart anomalies, stand out in magni-tude, accounting for nearly 30 percent of deaths. SIDS occurs outside of the hospital setting and affects all birth weights. The other causes are predominant in low-birth-weight babies.
470
The
Journal
of
Human
Resources
Table 2a
Leading Causes of Death among Infants, All Births to Blacks and Whites (1983–85)
Black and White Births Whites Blacks
Cause of death Deaths Rank Share Deaths Rank Share Deaths Rank Share
Sudden infant death syndrome 1.42 1 15% 1.29 1 13% 1.95 1 18%
Respiratory distress syndrome 0.78 2 8% 0.89 2 9% 0.60 3 6%
Congenital anomalies of heart 0.68 3 7% 0.71 3 7% 0.61 2 6%
Congenital anomalies of respiratory system 0.26 4 3% 0.30 4 3% 0.17 9 2%
Birth asphyxia 0.23 5 2% 0.22 9 2% 0.29 4 3%
Infections in the perinatal period 0.23 6 2% 0.24 6 2% 0.23 7 2%
Newborn affected by complications of placenta, cord, and membrane
0.22 7 2% 0.26 5 3% 0.19 8 2%
Other congenital anomalies of circulatory system 0.21 8 2% 0.20 11 2% 0.27 6 3%
Other chromosomal anomalies 0.19 9 2% 0.23 7 2% 0.11 12 1%
Congenital anomalies of musculoskeletal system 0.18 10 2% 0.21 10 2% 0.11 11 1%
Pneumonia 0.18 11 2% 0.15 14 2% 0.28 5 3%
Anencephalus and similar anomalies 0.17 12 2% 0.23 8 2% 0.06 14 1%
Newborn affected by maternal complications of pregnancy
0.16 13 2% 0.21 12 2% 0.12 10 1%
Congenital anomalies of genitorurinary system 0.14 14 1% 0.17 13 2% 0.07 13 1%
All other causes 4.72 — 48% 4.50 — 46% 5.74 — 53%
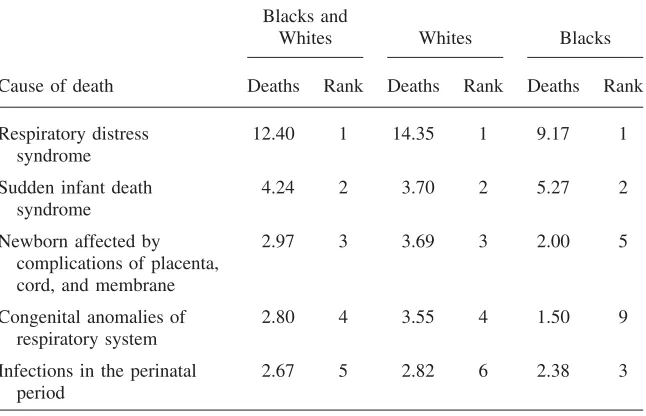
Table 2b
Leading Five Causes of Death among Infants Born under 2,500 Grams (1983–85)
Blacks and
Whites Whites Blacks
Cause of death Deaths Rank Deaths Rank Deaths Rank
Respiratory distress syndrome
12.40 1 14.35 1 9.17 1
Sudden infant death syndrome
4.24 2 3.70 2 5.27 2
Newborn affected by complications of placenta, cord, and membrane
2.97 3 3.69 3 2.00 5
Congenital anomalies of respiratory system
2.80 4 3.55 4 1.50 9
Infections in the perinatal period
2.67 5 2.82 6 2.38 3
Note: Sample restricted to singleton births that are non-Hispanic. Deaths are per 1,000 births and are adjusted to a common birth weight distribution.
were for black infants (9 per 1000), as Table 2b shows. Thus, any advance in RDS led to more rapid reductions in infant mortality among whites.
B. Measures of Innovation
We construct two measures of innovation related to infant conditions: the number of NIH grants associated with each condition, and the number of peer-reviewed journal publications associated with each condition. Each of these has been used as a measure of innovation in past studies. The grants data come from the Computer Retrieval of Information on Scientific Projects (CRISP) database of biomedical re-search grants, maintained by the NIH.11 Each entry includes a thesaurus of key
words, allowing us to search for relevant grants. A complete list of our search terms is available from the authors upon request. In cases when the use of multiple search terms returned duplicate grants, we removed duplicates from the final counts. How-ever, to capture the size of a grant, we counted each year of funding (grant cycle) separately. We created counts of these grant-years for two periods, 1975–82 and
472 The Journal of Human Resources
1983–98, to capture new innovative effort during our study period as well as earlier research that may have produced clinically useful results between 1983 and 1998.12
The publications data come from the MEDLINE database of medical journal ar-ticles, maintained by the National Library of Medicine. This database has an index of hierarchical subject headings, so identifying articles that are relevant to a partic-ular cause of death can be accomplished by searching on the appropriate headings, when available. First, we identified subject headings denoted as “major” topics, and searched on these major topics that closely matched terms from the NCHS catego-rization of causes of death. In some cases, there were no “major” topic subject headings matching the cause of death (or category) sufficiently, so we searched for terms in the titles and abstracts of articles. A complete list of our search commands is available upon request. For all causes, we counted articles that were published during the study period (1983 to 1998).
For many of the conditions we study, peer-reviewed publications reflect innovation that has already occurred, because they tend to summarize evidence from completed clinical trials. In some cases, as in the case of treatments for premature infants, multisite trials may actually affect a large share of the relevant population. Thus this measure of innovation likely captures innovation that occurs just before and during our period of study.
In some cases, categories are too broad to identify a relevant subject category for grants or publications (for example, “viral diseases,” or “remainder of diseases of respiratory system”). In the absence of a thesaurus term or subject heading that captured a given condition, we did not include grant or article counts on that con-dition. Out of 69 possible categories (not counting the residual category), we suc-cessfully constructed grants counts for 49 conditions and article counts for 41 con-ditions. The conditions with both measures account for over 85 percent of deaths not in the residual category, or 66 percent of all deaths, in the initial period.
Over the 1983–98 time period, the mean number of grants per condition was 136, with an interquartile range of 34 to 156. Journal articles are more numerous. The average condition had 1,315 articles devoted to it over this time period, with an interquartile range of 336 to 1,810.
V. Testing for Induced Innovation
In this section, we test the predictions of the induced innovation model. We start with the prediction that initial death rates and subsequent research should be related. We estimate equations of the form:
0 r =α +αd +ε
(6) i 0 1 i i
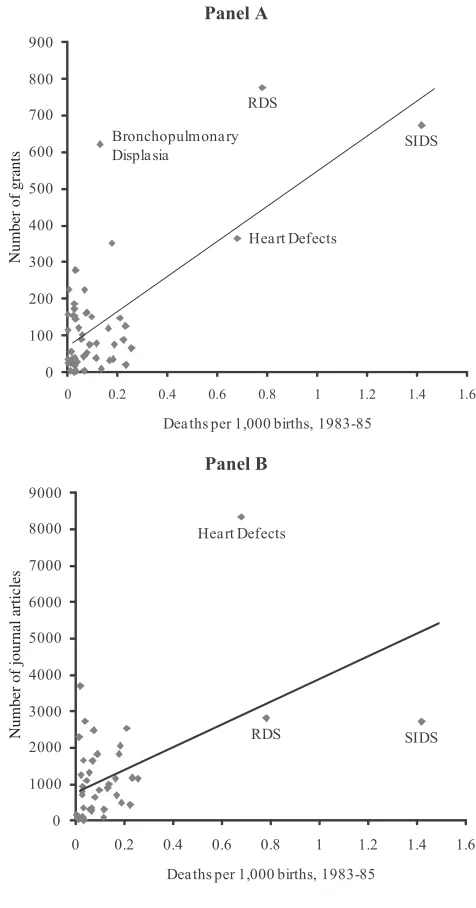
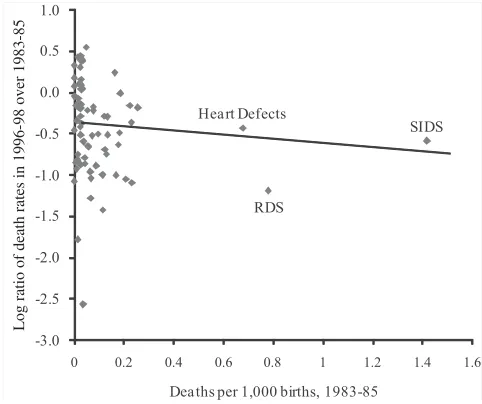
Figure 4 shows the relation between initial mortality rates and research graphi-cally. The upper panel shows that conditions with higher mortality rates in 1983–85 have more grants devoted to them in the subsequent 15 years. The lower figure shows that the same is true about the number of journal articles. In both cases, a good part of the line is defined by conditions with very high mortality rates. That is not necessarily problematic—in fact, it would be predicted by our model given the highly skewed distribution of mortality—but we examine the sensitivity to this in our results below.
The magnitude of these relations, and other potential correlates, are shown in Table 3. The first column shows the relation graphed in Figure 4(a). Each death per 1,000 births due to a particular cause in 1983–85 is associated with nearly 500 NIH grants on that disease from 1983 to 1998.13The second column explores the
sen-sitivity of this result to SIDS, RDS, and heart defects. Without those three conditions, the coefficient estimate is still positive, but smaller and not statistically significant.14
At least some of our results are related to the fact that very big causes of death get more research effort. However there is no obvious reason to exclude these major causes of death from our analysis, so our subsequent findings include those data.
The third column shows that each death per 1,000 births is associated with over 2,700 articles in the 1983–98 time period.15As with the grants data, the coefficient
falls and is no longer statistically significant when SIDS, RDS, and heart defects are excluded. As the fifth, sixth, and seventh columns show, the initial death rate is proxying for grant activity—generally with a lag. Every additional grant in the 1975– 82 time period is associated with eight additional articles in the 1983–98 time period. More recent grants have a smaller impact on articles, although this may be a function of the specific timing of grants in this interval.
The second part of the analysis looks at the impact of initial mortality and research on subsequent mortality changes. The theory predicts that declines in mortality should be negatively correlated with higher initial mortality rates, and that this re-lationship should arise because of increased research activity. To look at the relation between initial mortality and subsequent mortality changes, we estimate equations of the form:
1 0 0
ln(d/d ) =β +βd +ε
(7) i i 0 1 i i
Because of the heteroskedasticity induced by very low mortality rates, we express the dependent variable in logarithms, and we weight the regressions by the theo-retical standard error.16To control for changes in birth weight over time, we measure
13. We find qualitatively similar results taking logs of both variables, and the same with articles. 14. Removing only RDS from our analyses yields very similar results in sign and magnitude (results available upon request).
15. We thank a reviewer for pointing out that this estimate could be biased downward due to the overlap-ping years of mortality and research data, if articles published during 1983–85 also reduced mortality in those years. We expect this bias would be small, however, and this issue would not apply to research grants which take longer to impact clinical practice.
474 The Journal of Human Resources
Number of journal articles
Number of grants
Figure 4
Cutler
,
Meara,
and
Richards-Shubik
475
Grants (1983–98) Journal Articles (1983–98)
Race (1) (2) (3) (4) (5) (6) (7)
Initial mortality per 1,000 births 488 135 2,748 984 2,456 −77 251
(73) (222) (797) (1,923) (1,142) (1,222) (1,220)
Grants (1983–98) — — — — 0.59 −2.68
(1.63) (1.76)
Grants (1975–82) — — — — — 8.24 11.17
(2.85) (3.40)
Sample All w/o “big 3” All w/o “big 3” All All All
N 49 46 41 38 41 41 41
R2 0.484 0.008 0.234 0.007 0.236 0.371 0.409
476 The Journal of Human Resources
Log ratio of death rates in 1996-98 over 1983-85
Figure 5
Relationship between Initial Mortality Rate and Declines in Death Rates
both initial and final mortality using a constant birth weight distribution for each race, equal to their distributions in 1983–85. We also estimated alternative forms of Equation 7 that test the log change in death rates from time 0 to time 1 as a function of deaths in some earlier period. To do this, we estimated models of the log change in deaths in years 1986–88 to 1996–98, as a function of the initial death rate in years 1983–85. The results were qualitatively and quantitatively similar to those shown here.17
Taken literally, our theoretical model implies β0= 0; a condition with no deaths should have no research, and hence no change in the death rate. In reality, the constant term captures a variety of departures from the model, such as a reduction in overall mortality risk over time that results independently of research (due to improved nutrition, for example), innovations that affect all conditions, and spill-overs in research across conditions. Also, to the extent that research allocation is nonoptimal (for example, due to political pressure) or the fi are not equal across conditions (due to earlier research on more common causes of death),β1would be diminished and β0would differ from zero.
Figure 5 shows the relation between initial mortality and the decline in subsequent mortality. There is a negative relationship between the two, again with a large com-ponent played by SIDS, RDS, and heart defects. The first column of Table 4 shows
Cutler
,
Meara,
and
Richards-Shubik
477
All causes Causes with article data Causes with grant data
Independent Variable (1) (2) (3) (4) (5) (6) (7) (8)
Initial mortality per 1,000 births −0.222 −0.715 −0.146 −0.149 0.555 −0.168 0.374 −0.014
(0.096) (0.726) (0.116) (0.127) (0.967) (0.107) (0.205) (0.876)
Grants (1975–98) (100s) — — — — — — −0.070 −0.026
(0.023) (0.048)
Articles (1983–98) (1000s) — — — 0.002 −0.132 — — —
(0.028) (0.102)
Constant −0.374 −0.285 −0.457 −0.460 −0.390 −0.432 −0.373 −0.389
(0.067) (0.112) (0.088) (0.098) (0.193) (0.080) (0.076) (0.168)
Sample All w/o“big 3” All All w/o“big 3” All All w/o“big 3”
N 69 66 41 41 38 49 49 46
R2 0.074 0.015 0.039 0.039 0.051 0.050 0.207 0.007
478 The Journal of Human Resources
the corresponding regression coefficient. Across all 69 conditions, initial mortality is negatively and statistically significantly related to mortality changes. The relatively large constant term indicates that induced innovation is not the only effect in the data. As the second column shows, the coefficient on initial mortality is actually larger excluding SIDS, RDS, and heart defects, but the standard errors are larger as well. The big causes of death are a large part of our story.
The theory suggests that the relation between initial mortality and subsequent mortality declines will be mediated by the amount of research devoted to the disease. We test this in the next columns. The third column shows the same regression as in Column 1, but limited to the 41 conditions for which we have journal article data. The coefficient on initial mortality is negative, although smaller than the correspond-ing coefficient in Column 1. The fourth column shows very little relationship be-tween articles and changes in mortality. The coefficient on journal articles is near zero and statistically insignificant, and the coefficient on initial mortality remains negative. The fifth column, excluding SIDS, RDS, and heart defects, shows a neg-ative relationship between articles and changes in mortality, but has little statistical power.
The next three columns show the analogous results using research grants from 1975 to 1998 as the measure of innovation. The relationship between initial mortality rates and changes in mortality is mediated by the number of research grants.18
Con-trolling for the number of grants, the initial mortality rate is positively related to subsequent mortality changes, although not statistically significantly so. The last column suggests that the mediating role of grants is present even without SIDS, RDS, and heart defects, but again there is little statistical power.
The results in Table 4 permit two estimates of the magnitude of the effect of induced innovation on infant mortality over this time period. One estimate comes from the constant term. The difference between the average rate of mortality reduc-tion and that implied by the constant term in Equareduc-tion 7 indicates the average mor-tality reduction due to induced innovation. The second measure is the change in predicted final death rates attributable to the relation between initial mortality and subsequent mortality. Because of the nonlinear model, the first estimate understates the inducement effect, while the second overstates it.19
The constant term in the first column of Table 4 implies a decline of 31 percent in mortality( −0.374 compared with the total reduction in the death rate
−0.31 =e −1)
of 37 percent. This suggests that about a 6 percent reduction, or one-sixth of the actual improvement in mortality, is due to induced innovation. Using the estimate ofβ1to calculate predicted mortality, in contrast, generates a 7.5 percent decline in mortality(0.075 =E
[
exp(βd0)]
, about one-fifth of the actual change.20InCol-−1)
1 i
18. Again we thank a reviewer for pointing out that the coefficient on grants may be biased downward, if grants near the end of the period do not impact mortality.
19. In a linear model these would be the same, but our model is not linear. The regression equation implies , so the relative change equals . Thus the two
1 0 0 1 0 0
E[di]=diexp(β0) exp(β1di) di/di−1 exp(β0) exp(β1di)−1
measures of the total impact of induced innovation areD /D1 0 , calculated from the constant term, −exp(β0)
andE[exp(βd0)] , from the slope coefficient (where the individual conditions are weighted by their −1
1 i
initial mortality rates,d0).
i
umn 7, using the coefficient on research grants to calculate predicted mortality, the magnitude of the effect of induced innovation rises to half of the actual change.21
Conservatively choosing estimates that are closer to our lower bound, we estimate that about one fifth of the reduction in infant mortality over this period is a result of induced innovation.
A. The Role of Competing Risks
One potential concern about our estimates is the possibility of competing risks. If vulnerable infants saved from one disease are still likely to die of another, decreased mortality for one cause of death will not result in as great a reduction in total mortality. Alternatively, if research in one disease leads to progress in another, we will understate the impact of research on improved outcomes. However, infants differ from adults in the sense that, unlike older adults who are at risk of multiple con-ditions (hypertension, high cholesterol, and diabetes are all related to obesity, for example), infants saved from one condition are much less likely to develop other conditions. In contrast to older adults, infants face lower risks of disease incidence as they age, mitigating the competing risk problem.
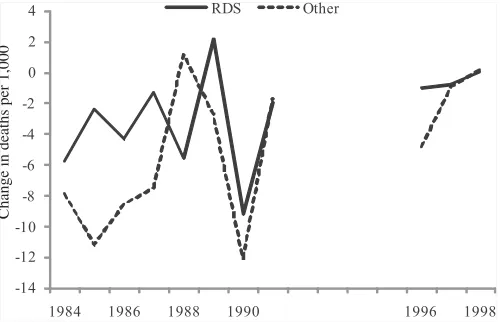
To test for competing risks though, we return to the RDS example. RDS is im-portant both because of its contribution to our overall results and because respiratory distress is so central to infant mortality. We take advantage of the time series vari-ation to look for competing risks. If a substantial portion of infants in low-birth-weight groups who died from RDS were at risk from other diseases as well, we would expect years with large drops in the RDS death rate to have smaller reductions in deaths from other causes.
Figure 6 shows annual mortality change for RDS and all other causes among births 1000–1499g. The results are, if anything, the opposite of the competing risk explanation. In years where RDS mortality fell most—especially 1990, the year of widespread diffusion of surfactant—non-RDS mortality fell as well; the correlation between mortality changes for RDS and all other causes is 0.50. These results sug-gest no issue of competing risks. If anything, it appears that as a major cause of death like RDS falls, the innovations that contribute to this fall may reduce deaths from other causes as well.
One example of this would be bronchopulmonary dysplasia, a condition related to extended periods of mechanical ventilation in premature infants. With the advent of surfactant, time on ventilation fell, thus reducing the incidence of bronchopul-monary dysplasia (Soll 2000). Both mechanical ventilation and longer hospital stays are risk factors for hospital acquired infections, so shortening both of these could increase survival indirectly for infants with RDS. Other NICU technologies devel-oped in the treatment of infants with RDS could also benefit infants with unrelated conditions. For example, improved ventilation techniques developed in response to the wave of RDS infants, might also benefit other infants on ventilators. To the extent that such spillovers exist, our estimates of induced innovation yield a lower bound, because they only capture the differential mortality reductions that occur
480 The Journal of Human Resources
Change in deaths per 1,000
Figure 6
Annual Change in RDS and Other Mortality
across causes of death receiving more research effort, and not any potential spillover from induced research effort.
VI. Innovation and Inequality
A. Is Innovation Race Neutral?
In our model, medical innovation is race-neutral: Doctors and research funders seek to reduce the major causes of death, whether they affect blacks or whites. This may not be right, however. For example, research might be tilted toward conditions that whites suffer from, ignoring conditions that are common among blacks.
One way to test this is to differentiate black and white deaths in the equation for subsequent mortality changes. Consider Equation 8, an expanded version of Equation 7:
1 0 ˜0 ˜0
ln(d/d ) =β +βd +βd +ε
(8) i i 0 1 a,i 2 b,i i
whered˜aandd˜brefer to race-specific deaths as a share of all births. Thus, d˜a and are not standard death rates because the race-specific number of deaths are divided
˜db
by the sum of black and white births. One can thus view ˜da as capturing the death rate from the bundle of causes that kill white infants and ˜db as capturing the death rate from the bundle of causes that kill blacks. A theory of racially biased innovation suggests that black deaths should count less than white deaths, that is, β2<
.
β1
Cutler
,
Meara,
and
Richards-Shubik
481
Change in Death Rates Journal Articles (1983–98) NIH Grants (1983–98)
Independent Variable (1) (2) (3) (4) (5) (6) (7) (8) (9)
Black deaths per −0.837 — −2.515 8,089 — −28,672 1,856 — 2,999
1,000 births (both races) (0.335) (1.650) (3,018) (9,660) (251) (953)
White deaths per — −0.298 0.682 — 3,989 14,484 — 648 −449
1,000 births (both races) (0.134) (0.657) (1071) (3668) (103) (361)
F-test for equal — — 1.94 — — 10.64 — — 6.98
coefficients [0.169] [0.002] [0.011]
N 69 69 69 41 41 41 49 49 49
R2 0.085 0.068 0.100 0.156 0.262 0.401 0.537 0.455 0.552
482 The Journal of Human Resources
(Column 1 versus Column 2), although the standard errors on each are large. The regression has difficulty determining the relative weight to put on the two when included in the regression jointly (Column 3), but the coefficient on black deaths is negative while the coefficient on white deaths is positive. However these coefficients are not statistically different from each other.
Columns 4 through 9 show the relation between race-specific initial mortality and the number of journal articles and NIH grants. When included together, white deaths are more associated with journal articles than are black deaths, but black deaths are more associated with NIH grants. In these regressions the coefficients are statistically different, but their magnitudes suggest a colinearity problem. Overall, we find no consistent pattern of race-based bias in the innovative process.
B. Induced Innovation and Social Inequality
As shown in our model, induced innovation can have an unintended consequence on disparities in health outcomes. In the model, greater gains in survival occur for causes of death that are relatively more common among the majority group. Thus, the overall disparity of health outcomes widens. As discussed in Section II, this result arises mechanically when the difference in initial death rates across races (majority−minority) are positively correlated with survival gains. We test for evi-dence of this correlation empirically, by relating changes in condition-specific death rates to the difference in initial shares of death for majority and minority groups. The correlation of 0.08 is indeed positive and statistically significant.22
The overall impact of this correlation on subsequent inequality changes is shown in Table 1. The last column of the table shows the simulated mortality rates if mortality for each cause declined at the same rate for whites and blacks, using the declines for whites.23 In this scenario, the black-white ratio would change only
because white and black babies die of differing causes. As the table shows, the black-white infant mortality ratio still rises by 12 percentage points in this scenario. Thus, about one-third of the increase in the black-white mortality disparity, (0.12/ 0.30), is a result of induced innovation. Another one-third, (0.21−0.12)/0.30, results from the differentially greater reduction in mortality for whites relative to blacks within causes. The remaining one-third, (0.30−0.21)/0.30, is a result of differential growth of low-birth-weight babies among blacks.24 Notably, the role of induced
innovation in the rise of the black-white mortality ratio is comparable to the role of induced innovation in the overall mortality reduction documented earlier. In other words, black-white infant mortality ratios in the United States are responsive to induced innovation, growing in pace with induced improvements in survival for infants.
22. Here we control for birth weight by calculating death rates and survival gains within 500-gram intervals and then taking a weighted average based on the number of births in each interval.
23. As in the preceding column, the analysis is conditional on birth weight.
C. A Falsification Exercise: Education-Based Disparities
One concern about our findings is that we may be measuring the impact of being in an economically disadvantaged group, not necessarily a minority population group. It may be that the economically disadvantaged are doing worse over time, regardless of whether they are majority or minority groups. Because blacks are both a population minority and economically disadvantaged, we cannot completely dif-ferentiate between these theories with our data.
We test this using data on deaths by maternal education, restricting the sample to non-Hispanic whites. Women with some college education represent a minority of births (40 percent), but are better off economically. Thus, if the effect we find is a result of economic disadvantage, babies of women with some college should fare better over time than babies of women who never attended college. If the result is due to population size, babies of women who attended college should fare no better than babies of less educated women. Table 6 displays numbers similar to those in Table 1, but dividing mothers into groups based on college attendance. As the second column of the table shows, the children of women who never attended college have a 53 percent higher mortality rate in 1983–85 than those of women who attended some college. That ratio increased to 88 percent in 1996–98.
About one-third of that increase is a result of adverse trends in the birth weight distribution for women who did not attend college relative to women who did. Our model does not explain such effects. The entirety of the remainder is a result of more rapid declines in mortality within cause for the children of women with some college education. As the last column shows, there is no increase in the mortality ratio, or if anything a slight decrease, when mortality reductions by cause are as-sumed to be the same. Thus, our results do not suggest that the causes of death predominant among the economically advantaged are declining more rapidly than the causes among the economically disadvantaged. Indeed, they seem about the same.
The reason why women with some college education benefitted more from pro-gress within causes of death than women without any college education is not clear. It may reflect differences in access to care or the quality of that care. Overall, however, these results support the conclusion that it is induced innovation resulting from minority status itself that leads to less rapid mortality declines for blacks, and hence lagging health outcomes.
VII. Conclusions
484
The
Journal
of
Human
Resources
Table 6
Actual and Simulated Change in Infant Mortality Disparity by Maternal Education
1983–85 1996–98
Maternal Education
Share of Births (percent)
Infant Mortality Rate
Actual Infant Mortality Rate
Holding birth weight constant
Holding birth weight constant and equal change
in cause-specific mortality rates
(1) (2) (3) (4) (5)
No college 60 9.5 5.9 5.7 4.9
College attendee 40 6.2 3.2 3.3 3.3
Ratio (No college: college) 1.53 1.88 1.73 1.49
Change in ratio 0.35 0.21 −0.03
comes from public payers. The idea that medical progress is in part a result of perceived need has been common in the literature, although not tested to any great extent. Evidence from the overall population demonstrates a strong correlation be-tween disability-adjusted life years lost to a disease and current NIH funding, as well as mortality rates and NIH funding, but this work did not document the success of research (Gross, Anderson, and Powe 1999). We test the importance of induced innovation by considering care for a group that is particularly needy: low-birth-weight infants.
We reach two primary conclusions. First, there is a strong impact of induced innovation on technological change. Disease conditions with higher initial mortality rates had more grant effort devoted to them, saw more journal articles about them, and experienced a greater reduction in subsequent mortality. Induced innovation explains about 20 percent of the reduction in mortality over time. These results are driven by three major causes of death, SIDS, RDS, and heart defects, which ac-counted for nearly one-third of all deaths in our initial time period. Given the highly skewed distribution of mortality by cause, it is not surprising that we lose statistical power without these leading causes. Our regressions essentially fit these three causes along with all the remaining causes which have low initial mortality, less research, and (on average) smaller reductions in mortality.
Second, endogenous technological change benefits majority groups over minority groups. Majority groups are of necessity a larger share of total deaths than are minority groups. Thus, conditions that affect them more will receive more research attention. Our results show that this leads to a significant increase in the disparity between black and white infants as innovation allows premature white newborns to “catch up” to their black counterparts, who, for a given gestation and birth weight, tend to have better health.
As in other contexts, where large fixed-cost investments are required, it helps to live in an area (country or neighborhood) where other people share the same char-acteristics that require such investments (Waldfogel 2006). To the extent the minority and majority groups suffer from the same conditions, or where minorities suffer a higher prevalence of common conditions, such as cardiovascular disease, we might expect innovations that improve the prognosis for individuals with common diseases could disproportionately help minority groups. However, in adult populations, such a result is difficult to isolate empirically given the importance of behavioral factors like smoking, diet, and exercise in addition to medical innovation for common con-ditions like cardiovascular disease and many cancers.
486 The Journal of Human Resources
of pension policies or changes in pension policy. We believe that unequal progress in health should be one factor considered when targeting research.
Appendix
Cause of Death Data
We start with cause of death as identified on ICD-9 forms and tab-ulated by the National Center for Health Statistics. We then modify this in several ways. First, we formed 10 additional categories by breaking apart two NCHS cate-gories that grouped together distinct conditions with over 100 deaths in 1983–85: 770.xx and codes 775.2–775.9. We also formed five categories by identifying con-ditions within the NCHS residual group with over 250 deaths in this period, based on ICD-9, three-digit codes. In addition, we moved four of the NCHS categories into a residual category because they do not identify a specific condition, but are rather residual catchall categories (for example, “& unspecified,” or “all other”).
Specifically, our modifications from the NCHS 61 Cause Recode were: the cate-gory for “other respiratory conditions of newborn” (ICD-9 code 770) was subdivided into congenital pneumonia (770.0), massive aspiration syndrome (770.1), interstitial emphysema and related conditions (770.2), pulmonary hemorrhage (770.3), primary atelectasis (770.4), other and unspecified atelectasis (770.5), and chronic respiratory disease arising in the perinatal period (Bronchopulmonary dysplasia, Wilson-Mikity syndrome) (770.7); “all other and ill-defined conditions originating in the perinatal period” (codes 775.2–775.9, and 776.1–779) was subdivided into disseminated in-travascular coagulation in newborn (776.2), necrotizing enterocolitis in fetus or new-born (777.5), and hydrops fetalis not due to isoimmunization (778.0); and categories were created for disorders of fluid, electrolyte, and acid-base balance (276), cardio-myopathy (425), primary pulmonary hypertension (416.0), cardiac arrest (427.5), and renal failure, unspecified (586). The final 69 categories are shown in Table A1.
Table A1
Cause of Death Categories
Articles* NIH Grants*
ICD-9 Codes Condition(s) 1983–98 1983–98 1975–82
001–007, 010– 032, 034–035, 037, 039–041, 042–044, 080– 088, 091–139
Remainder of infectious and parasitic diseases
a a a
008–009 Certain intestinal infections b 172 38
Table A1(continued)
Articles* NIH Grants*
ICD-9 Codes Condition(s) 1983–98 1983–98 1975–82
033 Whooping cough b 113 17
036 Meningococcal infection b b b
038 Septicemia 2466 160 94
045–079 Viral diseases a a a
090 Congenital syphilis b 23 3
140–208 Malignant neoplasms, including neoplasms of lymphatic and hematopoietic tissues
a a a
210–239 Benign neoplasms, carcinoma in situ, and neoplasms of uncertain behavior and of unspecified nature
a a a
254 Diseases of thymus gland b b b
276 Disorders of fluid, electrolyte, and acid-base balance
1640 145 62
277 Cystic fibrosis b 224 158
280–289 Diseases of blood and blood-forming organs
3689 30 8
320–322 Meningitis 1630 223 48
323–389 Other diseases of nervous system and sense organs
a a a
416 Primary pulmonary hypertension
336 277 54
425 Cardiomyopathy 924 17 0
427.5 Cardiac arrest 287 77 23
460–465 Acute upper respiratory infections
a a a
466, 490–491 Bronchitis and bronchiolitis 694 186 109
480–486 Pneumonia 1810 351 107
487 Influenza b 156 61
488 The Journal of Human Resources
Table A1(continued)
Articles* NIH Grants*
ICD-9 Codes Condition(s) 1983–98 1983–98 1975–82
470–478, 492–
550–553, 560 Hernia of abdominal cavity and intestinal obstruction without mention of hernia
b b b
586 Renal failure, unspecified 1088 120 68
740 Anencephalus and similar anomalies
681 31 52
741 Spina bifida 777 153 69
742.3 Congenital hydrocephalus 1301 88 60
742.0–742.2,
745–746 Congenital anomalies of heart 8334 364 375
747 Other congenital anomalies of
758 Down’s syndrome 1242 153 156
758.1–758.9 Other chromosomal anomalies 474 74 1
760 Newborn affected by maternal conditions which may be unrelated to present pregnancy
b b b
Table A1(continued)
Articles* NIH Grants*
ICD-9 Codes Condition(s) 1983–98 1983–98 1975–82
761 Newborn affected by maternal complications of pregnancy
1144 119 25
762 Newborn affected by
complications of placenta, cord, and membranes
419 87 3
763 Newborn affected by other complications of labor and delivery
b 34 0
764 Slow fetal growth and fetal malnutrition
b b b
767 Birth trauma 1815 74 47
768.2–768.4 Fetal distress in liveborn infant 289 101 38
768.5–768.9 Birth asphyxia 1161 19 1
769 Respiratory distress syndrome 2803 776 509
770 Congenital pneumonia 26 3 3
770.1 Massive aspiration syndrome 256 3 7
770.2 Interstitial emphysema and related conditions
319 42 12
770.3 Pulmonary hemorrhage 86 37 2
770.4 Primary atelectasis 73 37 13
770.5 Other and unspecified atelectasis
b b b
770.7 Chronic respiratory disease arising in the perinatal period (Bronchopulmonary dysplasia, Wilson-Mikity syndrome)
879 621 29
771 Infections specific to the perinatal period
1162 125 37
772 Neonatal hemorrhage 825 150 54
773–774 Hemolytic disease of newborn, due to isoimmunization, and other perinatal jaundice
2287 55 54
490 The Journal of Human Resources
Table A1(continued)
Articles* NIH Grants*
ICD-9 Codes Condition(s) 1983–98 1983–98 1975–82
775.0–775.1 Syndrome of “infant of a diabetic mother” and neonatal diabetes mellitus
b b b
776 Hemorrhagic disease of newborn
153 34 20
776.2 Disseminated intravascular coagulation in newborn
106 23 10
777.5 Necrotizing enterocolitis in fetus or newborn
624 163 28
778 Hydrops fetalis not due to isoimmunization
1 2 4
798 Sudden infant death syndrome 2703 673 387
E911–E912 Inhalation and ingestion of food or other object causing
obstruction of respiratory tract or suffocation
c c c
E913 Accidental mechanical suffocation
c c c
E800–E910, E914–E949
Other accidental causes and adverse effects
c c c
E967 Child battering and other maltreatment
c c c
E960–E966, E968–E969
Other homicide c c c
* Data are not available for all categories. See the discussion on page 19 for further information. Specific reasons for the absence of data are as follows:
a. Overly broad category.
b. Lack of appropriately targeted search terms. In some cases, in the MEDLINE database, we were unable to effectively restrict searches to infant conditions despite the presence of an “infant” qualifier. c. Not a medical condition.
References
Acemoglu, Daron, and Joshua Linn. 2004. “Market Size and Innovation: Theory and Evidence from the Pharmaceutical Market.”Quarterly Journal of Economics