Analyzing Land Conversion
in South East Minahasa, Indonesia, under Landsat
Satellite Image Data using the Supervised
Classification Method
Eko Sediyono, Gregorius Anung Hanindito
Master of Information SystemSatyawacana Christian University Salatiga, Indonesia
[email protected], [email protected]
Adi Setiawan
Dept. of Science and Math Satyawacana Christian UniversitySalatiga, Indonesia [email protected]
Abstract— South East Minahasa is recent regency located in the North Sulawesi Province, Indonesia. It is officially announced in 2007 as the expansion of South Minahasa Regency. This area has a superior commodity in the plantation sector, especially for coconut plantation. This study is analyzingthe expansion pattern of plantation land and conversion of forest to plantation in South East Minahasa, Indonesia. The image data are taken from Landsat Satellite from the year of 2002, 2007, 2010, and 2014.
The results show that during 2002-2014 there are forest
degradation trend in South East Minahasa; from 42.906,25 Ha in 2002 to 26.392,87 ha in 2014. It is hoped that the results can give valuable input for the related government in establishing the land management regulation in the upcoming years.
Keywords—Remote Sensing; land use; land cover; Industrial plantation
I. INTRODUCTION
For many years, Indonesia has struggled with land management cases which impacted on deforestation. One of many crucial causes of deforestation in Indonesia is the plantation and agricultural land expansion on the forest area. The expansion cannot be conducted on the conservation forest [1]. This similar expansion problem also occurs in South East Minahasa Regency, Indonesia
South East Minahasa is one of the recent municipalities in North Sulawesi Province as the expansion result of South Minahasa Regency. Ratahan is chosen as the capital city. On May 23rd, 2007, the ad interim Minister of Internal State Affairs officially announced the South East Minahasa Regency with several other cities and municipalities such as Kotamobagu City, South Bolaang Mongondow Regency, East Bolaang Mongondow Regency and Sitaroe Regency [2]. This Regency has been established under the Law of Republic Indonesia No. 9 of 2007 [3].
South East Minahasa is one of the potential municipalities, especially for its plantation field. Its specialized sector is the coconut plantation. The provided data records that this Regency produced 37.687 tons of coconut in 2011 [4].
Therefore, to ensure the geographic observation in the concerned area, image data processing is performed by Landsat satellite using remote sensing method. The remote sensing image is the primary focus in the spatial analysis about the plantation land conversion in South East Minahasa.
The purpose of this study is to monitor the conversion of forest into plantation land and to observe the dissemination pattern of plantation land in South East Minahasa. It is conducted by analyzing the land use and land cover change during 2002 - 2014 using four samples Landsat image data in 2002, 2007, 2010, and 2014. The result of this study can be used by the Government to monitor and control the dissemination pattern of plantation land in South East Minahasa.
II. STUDY AREA
South East Minahasa Regency is located in 124°32”56’ East Longitude - 124°57”3’ East Longitude and 0°50”28’ North Longitude - 1°7”17’ North Latitude, with the total area is 730.62 km2. The topography of most parts in this Regency is mountain range area [5]. South East Minahasa has great potential in developing the plantation products, with coconut plant as the primary commodity.
This study focuses on the dissemination pattern and comparison of the plantation land during 2002-2014. The administrative location is on South East Minahasa Regency This Regency is situated on the south of North Sulawesi Province which is directly on the verge of Maluku Ocean.
III. LAND USE AND LAND COVER CHANGE
The land use is any human activity that can influence the dissemination pattern of the land cover [7]. Another definition states that the land use is the human purpose in land utilization, whereas the land cover refers to the biophysical attributes of the earth surface that can be directly monitored by aerial photographs and satellite sensor [8]. From the definitions, it can be concluded that the land use and the land cover are closely related. The land use will affect the land cover change.
The observation detection about the land use and land cover change can be conducted by remote sensing. It provides more detail information in monitoring the land use and the land cover [9]. The land use and the land cover research have been started since 1970s by launching the Landsat satellite in the early 1970s. It provides semi temporal data such as Multispectral Scanner (MSS), Thematic Mapper (TM), Enhanced Thematic Mapper Plus (ETM+) and Landsat Data Continuity Mission (LDCM) [10].
Geographic information system and remote sensing is one of the methods that can be used in doing the observation of the land use and land cover. Several steps that have been done in detecting the land use and land cover change are data acquisition, image classification, and post-classification comparison. In the analysis process, the map comparison is conducted by overlaying two analyzed maps [11].
This study is performed by several steps. The first step is image classification of remote sensing. This classification employs the supervised classification method using a maximum likelihood technique which converts the pixel values of an image into the land cover class.
The next step is the analysis of the forest conversion to the plantation. The intersection technique is performed by comparing the forest with the plantation land. The intersection technique is used to find out the conversion pattern of the forest to the plantation land within certain periods.
IV.SATELLITE IMAGE CLASSIFICATION METHOD Image classification is a process to determine the image pixel into certain classes. It is performed by collecting some identical pixel group and converting into certain classes in accordance with the information categories by the users [12]. Remote sensing presents two types of classification methods, namely supervised classification and unsupervised classification [13].
Unsupervised classification is an identification of certain pixel group in a multispectral image without information class gained by the users [13]. There are some disadvantages to using the unsupervised classification method, such as the result of the classification may not correspond with the information in the real classes, the users have limited control for the class chosen through the classification process, and the relationship between the spectral class and information class are not always related [14].
Supervised classification is a classification process using the training site based on the information class identified by the users. The training site are used to classify the pixel that its
identity is still unknown into a certain class [13]. There are some advantages to using the supervised classification method: the users have full control in determining the training site, the classification results are more specific, and the users does not face difficulties in matching the image class [14]. Based on those particular reasons, this study applies the supervised classification method as it aims to gain the accurate level of the image classification result.
V. METHODOLOGY
A. Data Requirement
The data are taken from Landsat satellite. The data are selected based on the cloud cover percentage in the selected area. If the cloud cover percentage is high, the classification and the analysis process of the land use and land cover will be more difficult. Table 1 shows the data characteristic in this study.
TABLE I. THE DATA CHARACTERISTICS
Satellite Acquisition Date Cloud Cover
Landsat 7 28 July 2002 < 10%
Landsat 7 23 May 2007 < 10%
Landsat 7 12 March 2010 < 10 % Landsat 8 28 December 2014 < 10%
Four data sets were taken out of the different acquisition time. To facilitate the classification and analysis process, the data used in this study have only less than 10% cloud cover.
B. Research Design
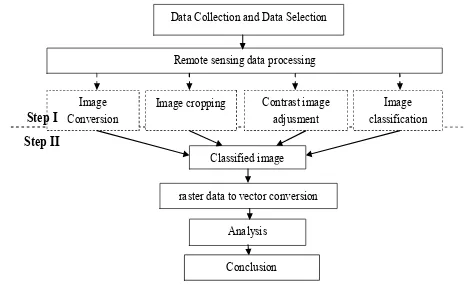
This research is conducted in several steps as described in Fig. 1.
Fig. 1. Flow Diagram of the Research Design
At the first stage, data collection, data selection, and remote sensing data process are performed to gain the classified image. Data are collected from Landsat satellite and selected by considering the cloud cover percentage. The remote sensing data process consists of four stages: image conversion, image cropping, contrast image adjustment, and image classification. The spatial resolution in each data is 30 meters explains that each real area that covers 30x30 m2 is represented by one pixel in the satellite image.
Image Conversion
Remote sensing data processing
Image cropping Contrast image
adjusment classification Image Data Collection and Data Selection
The supervised classification method is used in the image classification. It requires sufficient information of the Study area to gain the expected classes of the land cover class group [16]. The information about the area study is converted into training site made into digits based on the interpretation result of the satellite image which accuracy has been assured through interpreting both aerial image and survey [17].
The supervised classification method applies the maximum likelihood concept based on the probability that each pixel of the satellite image represents a certain class on the real condition [16]. Generally, the maximum likelihood is formulated on 1, 2, 3, 4, and 5 formulas, in which an X pixel is a pixel vector value which is grouped into k class if the probability X in k class is the biggest compared to the probability in the other classes [17].
L(X) = Max { L1(X), L2(X),…, LK(X) } (1)
with L(X) is the probability of X to be k class with the following calculation:
with dk2 is Mahalanobis distance which is formulated as
follows:
X = pixel vector value for X = (X1, X2, X3,…., Xn)t,
k = class for ( k =1, 2, 3, …, K), N = total of canal data,
Mk = average vector for k class which is calculated as
follows:
(4)
m = total of training site for k class,
Xki = pixel vector value for the – i th of k class of training
site,
CK = matrix covariant of k class which is formulated as
follows:
At the second step, the conversion of raster to vector image and the analysis process through intersection technique are performed to gain the forest to plantation land conversion and the dissemination pattern of plantation land. Intersection technique is one of the GIS techniques to analyzing the intersection between two different vectors. This technique can
be used in land use and land cover change analysis [18]. The observation using the intersection technique will result on the dissemination pattern of the analyzed land cover [19]. In this study, the analysis is performed in the following images:
1. The forest land cover image in 2002 with the plantation land use image in 2007
2. The forest land cover image in 2007 with the plantation land use image in 2010.
3. The forest land cover image in 2010 with the plantation land use image in 2014.
4. The forest land cover image in 2002 with the plantation land use image in 2014.
The intersections between the images are conducted using the intersection technique and it results on the analysis of the land use and land cover change in the area of South East Minahasa.
VI. RESULT AND DISCUSSION
A. Landsat Satellite Image Data Processing
This study utilizes four images data observation from Landsat satellite with a spatial resolution of 30 meters. The Landsat Satellite image data processing results on the classified images.
1) Classification
The image classification is performed by identifying each image pixel into a certain type of class using the aerial picture reference and direct observation on the field. As has been explained earlier, the classification process in this study is done using the supervised classification technique applying the maximum likelihood concept which emphasizes on the probability level of pixel x on a certain point to be in the k class. An image on a certain coordinate with an x pixel will be classified based on the real appearance both on direct observation and aerial picture. Through the observation, the x value pixel will be transformed into a certain k class.
In multispectral image, there are a number of canals known as band. On the satellite image, each band has a different pixel value for each coordinate point. The combination of each band will give a different coloring level on each image. The illustration of pixel value on the image band can be seen in Table 2.
TABLE II. THE PROBABILITY LEVEL OF THE SAMPLE DATA
In Table 2, 10 samples of coordinate points are randomly taken. The pixel value of band 3 and band 5 from those samples of coordinate points are different. The Max Lk(X) in
the table refers to the probability of the pixel value of a point to be in the certain class. However, each L1(X) and L2(X)
clarifies the probability level of the pixel value of a point to be in the 1st class or the 2nd class. In addition, the biggest probability of the pixel value to be in the certain class is shown by looking for the biggest probability pixel value of a coordinate toward the available classes. On the provided data samples, coordinates number 1 until 5 have a tendency to be classified into the 1st class, with the probability of L1(X).
Meanwhile, coordinates number 6 until 10 have a tendency to be classified into the 2nd class, with the probability of L2(X).
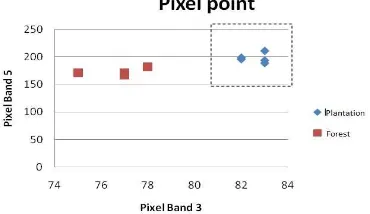
Fig. 2 shows several coordinate points that are randomly taken on the appearance of the plantation land and forest with the different pixel density of band 3 and band 5. Those pixel values are transformed into several certain classes through the probability process of the biggest chance as explained earlier.
The classification method of maximum likelihood is applied in each pixel in the Landsat images of South East Minahasa in 2002, 2007, 2010, and 2014 in order to obtain classified images based on the certain class using the ER Mapper software. This process results on the information about the tendency of decreasing vegetation forest as the impact of plantation land extension. The result can be seen in Fig. 4.
Fig. 2. Probability of Maximum Likelihood Classification
Fig. 3. The Classification Image Observation Result
Fig. 3 shows the classification image on the study area using the supervised classification method with the maximum likelihood concept. The dark green color represents the vegetation forest, whereas the light green color represents the plantation land. Fig. 3 explains that the plantation area extends and the vegetation forest narrows within 2002-2014.
2) Analysis of Forest to Plantation Land Conversion
a) The intersection process: the forest image in
2002 and the plantation land image in 2007 The forest image in 2002 intersects with the plantation land image in 2007. It aims to obtain the conversion pattern of the plantation land toward the forest area as drawn in the following Fig. 4.
Fig 4 explains that there is an extension area of the plantation land within the period of 2002-2007. The area with light green color refers to the land cover of the plantation land, whereas the area with dark green color refers to the land cover of the forest and the area with red color refers to the conversion pattern of the forest into the plantation land within the period of 2002-2007.
Fig. 4. The Conversion of Land Cover in 2002-2007
b) The intersection process: the forest area in 2007
and the plantation area in 2010
Fig. 5. The Conversion of Land Cover in 2007-2010
Fig. 5 show the pattern of the land cover conversion of the forest to the plantation land in 2007-2010. The area with dark green color refers to the forest, whereas the area with light green color refers to the plantation land and the area with red color refers to the analysis result of the forest conversion into the plantation land during 2007-2010.
c) The intersection process: the forest area in 2010
and the plantation area in 2014
This intersection process uses the forest image in 2010 and the plantation land image in 2014.
Fig. 6 show the pattern of the land cover conversion of the forest land into the plantation land in 2010-2014. The area with dark green color refers to the forest, whereas the area with light green color refers to the plantation land and the area with red color refers to the analysis result of the forest conversion into the plantation land since 2010-2014.
Fig. 6. The Conversion of Land Cover in 2010-2014
d) The intersection process: the forest area in 2002
and the plantation area in 2014.
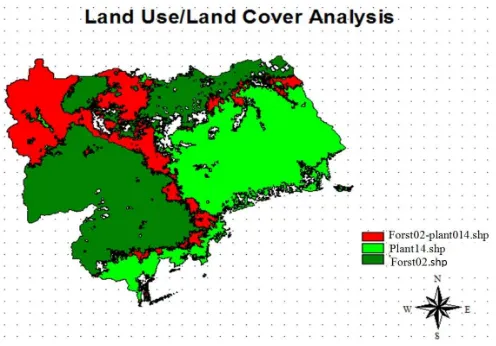
This intersection process aims to obtain the conversion pattern of the forest into the plantation land within the period of 2002 – 2014 as seen in Fig. 7.
Fig. 7. The Conversion of Land Cover in 2002-2014
Fig. 7 shows the pattern of the land cover conversion of the forest land into the plantation land in 2002-2014. The dark green color refers to the land cover of the forest, whereas the light green color refers to the land cover of the plantation land and the red color refers to the conversion pattern of the forest into the plantation land since 2002-2014.
3) Analysis in Graph
The comparison size between the forest and the plantation land is shown in a graph which illustrates the expansion pattern of the plantation land toward the vegetation forest.
Fig. 8. Forest and the Plantation Land Comparison
4) Discussion
The results show that the classification of the satellite image can be used to monitoring the condition of land cover vegetation in a certain area. It can be found from the conversion process of the satellite image pixel value into a land cover class based on the information gained from the aerial picture and the field survey. The intersection process is done in analyzing the land conversion with the intersection between two classes that intersect each other. The intersection of those two classes forms the conversion area of the cover land that occurs in a certain period.
It can be seen in this study that the extension pattern of the plantation land in South East Minahasa Regency increased within the period of 2002 – 2014. The analysis result of the Landsat image shows that the plantation land cover in 2002 was around 34.95% from the total area in South East Minahasa Regency. However, it dramatically increased into 53.43% in 2014. It was inversely proportional with the condition of the forest land cover in that area. Within the period of 2002 – 2014, the condition of the forest land cover kept decreasing. The result of this study shows that the forest area in 2002 was 58.61% in South East Minahasa Regency, whereas in 2014 the forest area was left for only 36.06%.
VII.CONCLUSION
The trend of forest degradation during 2002-2014 in South East Minahasa is the key issue in this study; moreover, the condition forest area is inversely with the plantation land area. Based on this study, a serious attention from the related government is needed to minimize the forest degradation in South East Minahasa. The government needs to increase the control and supervision to regulate the land management in South East Minahasa. For further study, it is recommended to have a deeper analysis of the other land cover change such as agricultural land, settlement, and another public sectors.
Related to the process of this study, hopefully there will be further studies that perform a deeper analysis which not only focus on the forest conversion but also on the other land cover conversions such as the housing complex, agriculture, and other public sectors.
ACKNOWLEDGMENT
The authors would like to thanks to Directorate General of Higher Education, Indonesia for research funding with scheme of Hibah Pascasarjana No. 001/K6/KL/SP/PENELITIAN /2015.
REFERENCES
[1] C. P. . Purba, S. G. Nanggara, M. Ratriyono, Isnenti, Apriani, L. Rosalina, N. A. Sari, and A. H. Meridian, The Figure of Indonesian Forestry. Bogor: Forest Watch Indonesia, 2014.
[2] Ministry of home affairs (Kemendagri), “Southeast Minahasa Regency/ Kabupaten Minahasa Tenggara,” 2011. [Online]. Available:
http://www.kemendagri.go.id/pages/profil- daerah/kabupaten/id/71/name/sulawesi-utara/detail/7107/minahasa-tenggara. [Accessed: 04-Feb-2014].
[3] Southeast Minahasa district administration (Pemkab Minahasa Tenggara), “Geographical of Southeast Minahasa/ Geografis Minahasa Tenggara,” 2015. [Online]. Available: http://www.mitrakab.go.id/hal-geografis.html. [Accessed: 25-Jan-2015].
[4] Capital Investment Coordination Board (BKPM), “Potential Coconut Production in Southeast Minahasa/ Potensi Kelapa di Kabupaten Minahasa Tenggara,” 2014. .
[5] Central Statistics Bureau of South Minahasa (BPS Minahasa Selatan), Minahasa Southeastern In Figures/ Minahasa Tenggara Dalam Angka. Ratahan, 2013.
[6] N. D. Morie, “Land Use And Land Cover Changes In Harenna Forest And Surounding Area, Bale Mountains National Park, Oromia National Regional State, Ethiopia”, 2007.
[7] S. Martínez and D. Mollicone, “From Land Cover to Land Use: A Methodology to Assess Land Use from Remote Sensing Data,” Remote Sens., vol. 4, pp. 1024–1045, 2012.
[8] E. J. Lindquist, R. D’Annunzio, A. Gerrand, K. MacDicken, F. Achard, R. Beuchle, A. Brink, H. D. Eva, P. Mayaux, J. San-Miguel-Ayanz, And, and H.-J. Stibig, Global forest land-use change 1990–2005. Rome: Food and Agriculture Organization of the United Nations and European Commission Joint Research Centre, 2012.
[9] J. Rogan and D. Chen, “Remote sensing technology for mapping and monitoring land-cover and land-use change,” Prog. Plan., vol. 61, pp. 301–325, 2004.
[10] Y. Tian, K. Yin, D. Lu, L. Hua, Q. Zhao, and M. Wen, “Examining Land Use and Land Cover Spatiotemporal Change and Driving Forces in Beijing from 1978 to 2010,” Remote Sens., vol. 6, pp. 10593–10611, 2014.
[11] M. F. Iqbal and I. A. Khan, “Spatiotemporal Land Use Land Cover change analysis and erosion risk mapping of Azad Jammu and Kashmir, Pakistan,” Egypt. J. Remote Sens. Sp. Sci., vol. 17, pp. 209–229, 2014. [12] K. Perumal and R. Bhaskaran, “Supervised Classification Performance
Of Multispectral Images,” J. Comput., vol. 2, no. 2, pp. 124–129, 2010. [13] S. K. Deb and R. K. Nathr, “No Title,” Glob. J. Res. Eng. Civ. Struct.
Eng., vol. 12, no. 1, pp. 5–16, 2012.
[14] D. I.M.Enderle and R. C. WeihJr, “Integrating Supervised and Unsupervised Classification Methods to Develop a More Accurate Land Cover Classification,” J. Ark. Acad. Sci., vol. 59, pp. 65–73, 2005. [15] S. Al-Tamimi and J. T. Al-Bakri, “Comparison Between Supervised and
Unsupervised Classifications for Mapping Land Use/Cover in Ajloun Area,” Jordan J. Agric. Sci., vol. 1, pp. 73–83, 2005.
[16] F. S. Al-Ahmadi and A. S. Hames, “Comparison of Four Classification Methods to Extract Land Use and Land Cover from Raw Satellite Images for Some Remote Arid Areas, Kingdom of Saudi Arabia,” JKAU; Earth Sci, vol. 20, pp. 167–191, 2009.
[17] R. Mukhaiyar, “Classifications Of Land Use from The Remote Sensing Data/ Klasifikasi Penggunaan Lahan Dari Data Remote Sensing,” J. Teknol. Inf. Pendidik., vol. 2, 2010.
[18] J. Mackenzie, “Land-Use/Land Cover Transitions in Delaware, 2002-2007.” Newark, 2009.