DBS GROUP HOLDINGS LTD AND ITS SUBSIDIARY COMPANIES
Fina nc ia l Pe rform a nc e Sum m a ry For T he First H a lf Y e a r 2 0 0 1
First Half 2000
First Half 2001
Incr/ (Decr)
Profit and Loss Account S$’m S$’m %
Net interest income 1,046 962 (8.1)
Non-interest income 442 566 28.2
Fee and commission income 260 251 (3.7)
Dividends 26 21 (19.0)
Rental income 16 19 20.8
Other income 139 275 97.6
Income before operating expenses 1,488 1,528 2.7
Staff costs (281) (389) 38.5
Other operating expenses (313) (360) 14.9
Operating profit 894 779 (12.9)
Provisions (64) (46) (27.7)
Associated companies 22 34 51.6
Net profit before tax 852 766 (10.1)
Taxation (160) (141) (12.2)
Minority interests 12 4 (65.7)
Net profit attributable to members 704 629 (10.6)
First Half 2000
First Half 2001
Incr/ (Decr)
Key Balance Sheet Data S$’m S$’m %
Total assets 107,552 156,497 45.5
Customer loans 52,429 69,617 32.8
Customer deposits 80,400 114,851 42.8
Consolidation of Dao Heng
Following receipt of Hong Kong Monetary Authority approval on June 27, 2001, DBS Bank began its tender for shares in Dao Heng Bank Group Limited (DHG) on June 29, 2001.
At June 30, 2001, DBS Bank through DBS Diamond Holdings Ltd. (80% owned) had already obtained a 56.9% effective holding in DHG. Consequently, DHG’s assets and liabilities were consolidated. Its pro-rata contribution to the DBSH Group’s Profit & Loss Statement however, was deemed not material for inclusion in this reporting period.
Exhibit 1
Group Net Profit Attributable to Members
436 112 1,072 1,389 704 629 0 200 400 600 800 1000 1200 1400
1997 1998 1999 2000 1H2000 1H2001 S$ million
Profit and Loss
DBSH Group’s net profit attributable to members in First Half 2001 decreased 10.6% to S$629 million.
Income before operating expenses registered an increase of 2.7% amidst weaker macroeconomic conditions and an increasingly competitive environment. Operating expenses increased by 26.1% to S$749 million. The increase was due to higher staff cost (S$108 million), technology-related expenses (S$24 million) and advertising expenses (S$13 million).
Exhibit 2
Group Net Interest Income and Net Interest Margin
1 ,0 0 2 1 ,4 3 0
2 ,0 3 5 2 ,0 3 9
1 ,0 4 6 9 6 2
0 5 0 0 1 0 0 0 1 5 0 0 2 0 0 0 2 5 0 0
1 9 9 7 1 9 9 8 1 9 9 9 2 0 0 0 1 H 2 0 0 0 1 H 2 0 0 1
1.78 2.07
1.73 1.77
2.02 2.02
Net Interest Income and Net Interest Margin
Net interest income declined by 8.1% to S$962 million in First Half 2001. Net interest margin decreased to 1.78% as compared to 2.07% in First Half 2000. The lower net interest margin was due to the shift from corporate loans to lower-yielding interbank lendings. Intensified market competition also resulted in narrower interest margin for housing loans. To a smaller extent, the temporary deployment of the proceeds from the recent capital issues in the interbank market also contributed to the reduction in net interest
DBS GROUP HOLDINGS LTD AND ITS SUBSIDIARY COMPANIES
Table 1
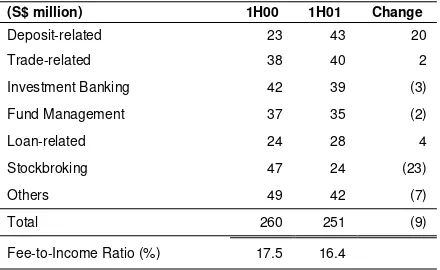
Group Fee and Commission Income
(S$ million) 1H00 1H01 Change
Deposit-related 23 43 20
Trade-related 38 40 2
Investment Banking 42 39 (3)
Fund Management 37 35 (2)
Loan-related 24 28 4
Stockbroking 47 24 (23)
Others 49 42 (7)
Total 260 251 (9)
Fee-to-Income Ratio (%) 17.5 16.4
Fee and Commission Income
Fee and commission income decreased 3.7% to S$251 million, due mainly to lower stockbroking fees (S$23 million) resulting from weak market volumes and the deregulation of brokerage commission. The decrease was partially offset by higher deposit-related fees (S$20 million). Fee and commission income contributed to 16.4% of the total operating income, down from 17.5% for First Half 2000.
Dividends & Rental Income
Dividends and rental income decreased marginally by 3.7% to S$41 million.
Table 2
Group Other Income
(S$ million) 1H00 1H01 Change
Net gains on trading in foreign
exchange 52 112 60
Net gains on sale of trading securities
and derivatives trading 55 102 47 Net gains on disposal of investment
securities 8 16 8
Net gains on disposal of fixed assets 4 26 22
Others 20 19 (1)
Total 139 275 136
Other Income
Other income increased substantially by 97.6% to S$275 million, due to higher foreign exchange trading profits (S$60 million) and higher profits from the sale of Singapore Government Securities (S$45 million). Profit of S$31 million on the disposal of DBS Securities Building was also included in the accounts.
Non-interest Income to Operating
Table 3
Group Operating Expenses
(S$ million) 1H00 1H01 Change
Staff costs 281 389 108
Occupancy expenses 73 77 4
Technology-related expenses 63 87 24 Professional and consultancy fees 38 33 (5)
Others 139 163 24
Total 594 749 155
Cost-to-Income Ratio (%) 39.9 49.0
Operating Expenses
DBSH Group continues to invest heavily in human resources. The 26.1% increase in operating expenses to S$749 million was mainly due to higher staff costs of S$108 million, of which S$42 million can be attributed to one-time contractual payments, staff adjustments and sign-on bsign-onuses. The balance was principally due to the recruitment of additional staff, salary increments including allowances, and higher variable bonus provisions on an enlarged pool of staff. In addition, higher technology-related (S$24 million) and advertising expenses (S$13 million) were incurred for various business initiatives. Cost-to-income ratio increased to 49.0% as compared to 39.9% in First Half 2000.
Table 4
Group Provisions
(S$ million) 1H00 1H01 Change
DBS Thai Danu Bank (DTDB) 11 4 (7)
Regional Countries (RC)* 24 11 (13)
Singapore (9) 49 58
Other Countries 11 7 (4)
Non-Loan Provisions 27 30 3
Specific Provisions 64 100 36
General Provisions (17) (64) (47)
Total DBSH Group’s Share 47 36 (11)
Minority Interests’ Share 17 10 (7)
Total DBSH Group
Provisions 64 46 (18)
* Refers to Malaysia, Indonesia, Thailand, Korea and the Philippines.
Provisions
Provisions decreased by 27.7% to S$46 million. For the five regional countries, lower loan provisions of S$11 million were required following a reduction in DBS’ regional non-performing loans in the First Half 2001. In Singapore, there was a one-time transfer of provisions from general to specific in connection with the folding-in of DBS Finance Ltd to DBS Bank. This transfer accounts for part of the increase in specific provisions for Singapore borrowers.
Minority Interests
DBS GROUP HOLDINGS LTD AND ITS SUBSIDIARY COMPANIES
Exhibit 3
Group Non-Performing Loans
0 3 0 0 0 6 0 0 0 9 0 0 0
J u n 9 8 D e c 9 8 J u n 9 9 D e c 9 9 J u n 0 0 D e c 0 0 J u n 0 1
D T D B D ao He n g 3 ,9 0 7
7 ,0 8 6
8 ,1 2 1 8 ,1 4 9 7 ,6 6 6
4 ,4 1 1 4 ,8 3 4 8 1 5
1 ,1 4 3
2 ,8 7 6 6.2 13.0 13.1 11.8 7.6 8.5 12.7
NBk NPL/NBk Loans
Exhibit 4
Group Non-Performing Loans – by Loan Grading
0 2 0 0 0 4 0 0 0 6 0 0 0
D T D B D a o H e n g D K O B O t h e r s 5 R C
S 'p o r e S u b s t a n d a rd
D o u b tf u l L o s s 1 , 6 1 0
6 2 4
3 1 8
3 2 3 8 1 5
1 , 1 4 3
4 , 8 3 4 T ota l
R C - R e g io n a l c o u n t r ie s
S $ m i l l i o n
Asset Quality
Excluding DHG, non-performing loans (NPLs) decreased 8.9% to S$4,019 million at end-June 2001 as compared to end-December 2000. DHG’s NPLs amounted to S$815 million.
Non-bank NPLsas a percentage of total non-bank loans stood at 6.2%, an improvement compared with 7.6% at end-December 2000, reflecting DBSH’s aggressive management of its NPL portfolio across the region. Excluding DHG, non-bank NPLs as a percentage of total non-non-bank loans would still have declined to 6.5%.
Of the total S$4,834 million in NPLs, 73% were in the substandard category and 63% were secured by collateral.
Approximately 12% of the NPLs that had been classified as substandard were “performing” NPLs. These loans were classified due to weak financials although debt servicing was still current.
Exhibit 5
Group Cumulative Specific and General Provisions
0 1000 2000 3000 4000 5000
Jun 98 Dec 98 Jun 99 Dec 99 Jun 00 Dec 00 Jun 01
SP GP S$ million
1,894 3,147
3,852 4,286 3,978
2,286 2,643
SP+GP/ Unsecured NPLs SP+GP/NPLs
146.5
1 1 9 . 6 1 0 2 . 7 1 1 0 . 6 1 1 8 . 4 1 1 4 . 8 1 2 9 . 9
54.7 51.8 48.5 44.4 47.4 52.6 51.9
Cumulative Specific and General Provisions
Total cumulative specific and general provisions at end-June 2001 amounted to 146.5% of unsecured NPLs, and 54.7% of total NPLs (or 59.9% of total NPLs of S$4,410 million under US SEC guidelines).
Based on MAS guidelines, Group loan loss reserve coverage for DBS Thai Danu’s NPLs was 62%.
Table 5
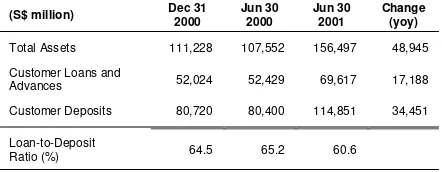
Key Balance Sheet Items
(S$ million) Dec 312000 Jun 302000 Jun 302001 Change(yoy)
Total Assets 111,228 107,552 156,497 48,945 Customer Loans and
Advances 52,024 52,429 69,617 17,188 Customer Deposits 80,720 80,400 114,851 34,451 Loan-to-Deposit
Ratio (%) 64.5 65.2 60.6
Balance Sheet
[image:6.595.83.312.230.636.2]The consolidation of DHG contributed to the increase in DBSH Group assets. Total assets were up 45.5% to S$156 billion. Customer loans increased by 32.8% to S$70 billion. Excluding DHG, customer loans increased by S$1 billion despite a weak loan market. Customer deposits registered 42.8% increase (or S$34 billion) to S$115 billion. Excluding DHG, the increase was S$10 billion. This amount included a one-time placement of S$5 billion from a customer, which had the effect of bringing down the loan-to-deposit ratio to 60.6%, as compared to 65.2% for First Half 2000.
Table 6
Capital
(S$ million) Dec 31 2000 Jun 30 2001
Tier I 10,200 11,061
Tier II 3,211 5,007
Total Capital 13,411 16,069
Risk Weighted Assets,
including Market Risks 70,963 91,972
Exhibit 6
Capital Adequacy Ratio (CAR)
13.6 2.0 14.6 1.2 15.7 3.5 14.4 4.5 12.0 5.5 0 5 10 15 20
1997 1998 1999 2000 Jun 01
Tie r I Tie r II
%
15.6 15.8
19.2 18.9
17.5
Capital Adequacy Ratio (CAR)
Combined Tier I and II CAR, measured according to the Bank of International Settlements (BIS) guidelines, remains strong at 17.5%, which is more than twice the minimum BIS requirement of 8%. Of the total, 12.0% is in the form of Tier I capital.
In March 2001, DBS Bank through DBS Capital Funding Corporation (100% owned), issued US$725 million and S$100 million subordinated term debts, which qualified for Tier I capital treatment. This was followed by issuance of Tier II US$850 million subordinated term debt in May 2001.
DBS GROUP HOLDINGS LTD AND ITS SUBSIDIARY COMPANIES
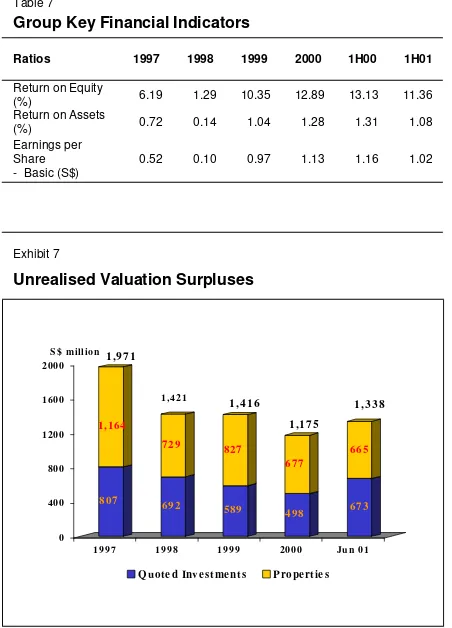
Table 7
Group Key Financial Indicators
Ratios 1997 1998 1999 2000 1H00 1H01
Return on Equity
(%) 6.19 1.29 10.35 12.89 13.13 11.36 Return on Assets
(%) 0.72 0.14 1.04 1.28 1.31 1.08 Earnings per
Share - Basic (S$)
0.52 0.10 0.97 1.13 1.16 1.02
Financial Indicators
Return on Equity (ROE) was 11.36% compared to 13.13% achieved for First Half 2000. Return on Assets (ROA) was 1.08% compared to 1.31% registered in First Half 2000. These ratios are, however, higher than pre-crisis levels in 1997.
Exhibit 7
Unrealised Valuation Surpluses
807
1,164
692
729
589
827
498
677
673
665
0 400 800 1200 1600 2000
1997 1998 1999 2000 Ju n 01 S $ m illio n
Q uote d Inve stme nts Prope rtie s 1 ,9 7 1
1,421 1 ,4 1 6
1 ,1 7 5 1 ,3 3 8
Unrealised Valuation Surpluses
DBS GROUP HOLDINGS LTD
UNAUDITED CONSOLIDATED PROFIT AND LOSS ACCOUNT FOR THE HALF YEAR ENDED JUNE 30 2001
In S$’million Note
First Half 2001
Second Half 2000
First Half 2000
Interest income 2,426 2,487 2,410
Less: Interest expense 1,464 1,494 1,364
Net interest income 1 962 993 1,046
Fee and commission income 2 251 249 260
Dividends 3 21 57 26
Rental income 19 16 16
Other income 4 275 129 139
Income before operating expenses 14 1,528 1,443 1,488
Less: Staff costs 389 332 281
Other operating expenses 360 320 313
Total operating expenses 5 749 652 594
Operating profit 779 791 894
Less: Provision for possible loan losses and
diminution in value of other assets 46 (10) 64
733 802 830
Add: Share of profits less losses of associated
companies 34 21 22
Net profit before taxation 766 823 852
Less: Taxation 6 132 153 156
Share of taxation of associated companies 9 2 4
Net profit after taxation 625 668 692
Minority interests 4 17 12
Net profit attributable to members 14 629 685 704
Earnings per ordinary share @
- Basic 102 Cents 110 Cents 116 Cents
- Fully diluted 96 Cents 108 Cents 106 Cents
(see related notes on pages 3 to 22)
@ Annualised
Appendix
DBS GROUP HOLDINGS LTD
UNAUDITED CONSOLIDATED BALANCE SHEET AS AT
2001 2000 2000 2001 2000 2000
In S$’million Note Jun 30 Dec 31 Jun 30 Note Jun 30 Dec 31 Jun 30
SHARE CAPITAL AND RESERVES
ASSETS
Share capital 1,308 1,307 1,335 Cash, and balances and placements
with central banks
2,709 5,145 4,597
RESERVES Singapore Government securities
and treasury bills
9,223 8,655 8,860
Share premium account 14 7 185
Other reserve 4,273 4,273 4,273
Capital redemption reserve 29 29 - Trading securities 12,204 4,849 3,521
Capital reserve 11 -
-General reserve 1,755 1,755 1,637
Revenue reserve 3,752 3,124 3,290 Balances, placements with, and
loans and advances to banks
48,588 34,569 32,862
9,834 9,188 9,385
Bills receivable from non-bank customers
10 1,483 992 1,144
SHAREHOLDERS' FUNDS 11,142 10,495 10,720
Loans and advances to non-bank customers
10 68,134 51,031 51,285
MINORITY INTERESTS 7 2,235 (126) (127)
Investment securities 4,375 341 326
Other assets 3,132 3,298 2,547
SUBORDINATED TERM DEBTS
8 6,043 2,508 2,735
Associated companies 556 558 615
LIABILITIES
Deposits and balances of banks
11,135 12,054 9,130 Goodwill on acquisition 3,419 -
-Deposits and other accounts of non-bank customers
9 114,851 80,720 80,400
Other debt securities in issue 2,809 655 475 Fixed assets 2,674 1,790 1,796
Other borrowings 535 649 620
Bills payable 399 407 393
Other liabilities 6,938 3,144 2,250
Current taxation 395 408 804
Deferred taxation 15 18 13
Dividends payable - 296 139
156,497 111,228 107,552 14 156,497 111,228 107,552
Life-fund liabilities to policyholders
1,583 1,289 1,053 Life-fund assets attributable to
policyholders
1,583 1,289 1,053
TOTAL LIABILITIES AND
SHAREHOLDERS’ FUNDS 158,080 112,517 108,605 TOTAL ASSETS 158,080 112,517 108,605
MEMORANDUM ITEMS
Contingent liabilities 13,875 8,674 11,075
Commitments 44,935 33,065 35,814
58,810 41,739 46,889
Financial derivatives 350,511 176,194 76,914
NOTES TO THE UNAUDITED CONSOLIDATED FINANCIAL STATEMENTS
1 Net Interest Income and Margin
DBSH Group’s net interest income for 1st Half 2001 was S$31 million and S$84
million lower than 2nd Half 2000 and 1st Half 2000, respectively. The net
interest margin was 1.78% compared to 1.97% in 2nd Half 2000 and 2.07% in 1st
Half 2000. The lower net interest margin was due to the shift from corporate loans to lower-yielding interbank lendings. Intensified market competition also resulted in narrower interest margin for housing loans. To a smaller extent, the temporary deployment of the proceeds from the recent capital issues in the interbank market also contributed to the reduction in net interest income.
In S$'million First Half 2001* Second Half 2000 First Half 2000
Average
balance Interest
Average rate @
(%)
Average
balance Interest
Average rate @
(%)
Average
balance Interest
Average rate @
(%)
Interest bearing assets 108,926 2,426 4.49 101,009 2,487 4.92 101,026 2,410 4.77
Non-interest bearing assets
7,118 - - 6,412 - - 7,058 -
-Total assets 116,044 107,421 108,084
Interest bearing liabilities
101,914 1,464 2.90 93,908 1,494 3.18 94,169 1,364 2.90
Non-interest bearing liabilities
3,073 - - 2,979 - - 2,702 -
-Total liabilities 104,987 96,887 96,871
Net interest income 962 993 1,046
Net interest income as a % of average interest
bearing assets
1.78 1.97 2.07
@ Annualised
Appendix
Average balances are calculated on a monthly average basis.
Interest bearing assets comprise cash, balances and placements with central banks; balances, placements with, and loans and advances to banks; loans and advances to non-bank customers including bills receivable, and debt securities held. Non-interest bearing assets comprise equity investments, fixed assets, accrued interest receivable, sundry debtors, revaluation of financial instruments, sundry deposits and prepayments.
Interest bearing liabilities comprise deposits and balances of banks, deposits and other accounts of non-bank customers, debt securities issued and other borrowings. Non-interest bearing liabilities comprise accrued operating expenses, sundry creditors, balances arising from revaluation of financial instruments, and interest and other income received in advance.
2 Fee and Commission Income
Fee and commission income comprises the following:
First Half Second Half First Half
In S$’million 2001 2000 2000
Deposit-related 43 37 23
Trade-related 40 37 38
Investment banking 39 56 42
Fund management 35 25 37
Loan-related 28 27 24
Stockbroking 24 31 47
Credit card 16 18 15
Guarantees 14 12 14
Others 12 6 20
3 Dividends
Dividend income in 2nd Half 2000 included special dividends of S$50 million
from NatSteel Limited.
4 Other Income
Other income comprises the following:
First Half Second Half First Half
In S$’million 2001 2000 2000
Net gains on trading in foreign exchange 112 67 52
Net gains on sale of trading securities and
derivatives trading 102 - 55
Net gains on disposal of investment
securities 16 33 8
Net gains on disposal of fixed assets 26* 5 4
Other income 19 24 20
Total 275 129 139
Appendix
5 Other Operating Expenses
Other operating expenses comprises the following:
First Half Second Half First Half
In S$’million 2001 2000 2000
Staff costs 389 332 281
Occupancy expenses 77 75 73
Technology-related expenses 87 69 63
Professional and consultancy fees 33 35 38
Others 163 141 139
Total 749 652 594
The increase in expenses in 1st Half 2001 was due to higher staff costs,
technology-related expenses and advertising expenses.
6 DBSH Group’s effective tax rate was 18.4% for 1st Half 2001. This was lower
than that derived by applying the statutory income tax rate of 24.5% to the profit before taxation. The lower effective tax rate was mainly due to profit arising from the Asian Currency Unit offshore transactions which is subject to tax at a concessionary rate of 10%.
7 Minority interests represent the interests of third parties in the equity shares of
the Group’s subsidiaries. It also includes the non-cumulative, redeemable preference shares of S$1,100 million issued by DBS Bank.
8 The subordinated term debts of S$6,043 million included Tier I US$725 million
9 Deposits and Other Accounts of Non-Bank Customers
At June 30, 2001, total customer deposits of DBSH Group amounted to S$114,851 million, of which Dao Heng Bank Group Limited (DHG) accounted for S$24,635 million.
In S$’million
Jun 30 2001
Distribution %
Dec 31 2000
Distribution %
Jun 30 2000
Distribution % Analysed by Currency
Singapore dollar 55,415 48.2 55,533 68.8 55,974 69.6
US dollar 29,721 25.9 14,573 18.0 12,860 16.0
Thai Baht 3,066 2.7 2,864 3.5 3,287 4.1
Japanese Yen 298 0.3 307 0.4 1,000 1.2
Hong Kong dollar 21,396 18.6 4,414 5.5 4,132 5.2
Others 4,955 4.3 3,029 3.8 3,147 3.9
Total 114,851 100.0 80,720 100.0 80,400 100.0
Analysed by Type
Savings account (include S$ autosave)
40,973 35.7 38,057 47.2 37,467 46.6
Current account 9,040 7.9 8,099 10.0 7,612 9.5
Fixed deposits 63,810 55.5 34,005 42.1 34,003 42.3
Other deposits 1,028 0.9 559 0.7 1,318 1.6
Total 114,851 100.0 80,720 100.0 80,400 100.0
Analysed by Maturity
Repayable on demand 50,160 43.7 46,178 57.2 45,174 56.2
Due within 1 year 64,039 55.8 34,038 42.2 34,932 43.4
Due over 1 year but within 3 years
626 0.5 500 0.6 294 0.4
Due over 3 years but within 5 years
26 # 4 # -
-Due over 5 years - - - - -
-Total 114,851 100.0 80,720 100.0 80,400 100.0
Appendix
10 Loans to, and Bills Receivable from Non-Bank Customers
At June 30, 2001, total customer loans, including bills receivable of DBSH Group, amounted to S$69,617 million, of which DHG accounted for S$15,994 million.
In S$’million
Jun 30 2001
Dec 31 2000
Jun 30 2000
Gross 72,077 54,166 56,219
Less :
Specific provisions 1,325 1,141 2,669
General provisions 1,135 1,002 1,121
Net 69,617 52,023 52,429
Including:
Bills receivable 1,483 992 1,144
Loans 68,134 51,031 51,285
69,617 52,023 52,429
In S$’million
Jun 30 2001
Distribution %
Dec 31 2000
Distribution %
Jun 30 2000
Distribution %
Industry Breakdown
Manufacturing 6,264 8.7 5,797 10.7 5,639 10.0
Building and Construction 10,378 14.4 8,726 16.1 9,500 16.9
Housing Loans 24,619 34.2 16,304 30.1 16,192 28.8
General Commerce 5,282 7.3 3,701 6.8 4,071 7.3
Transportation, Storage and
Communications 6,135 8.5 3,487 6.4 3,227 5.7
Financial Institutions, Investment and Holding
Companies 4,759 6.6 4,143 7.7 4,670 8.3
Professionals and Private Individuals (except Housing Loans)
8,430 11.7 6,317 11.7 6,014 10.7
Others 6,210 8.6 5,691 10.5 6,906 12.3
In S$’million
Jun 30 2001
Distribution %
Dec 31 2000
Distribution %
Jun 30 2000
Distribution %
Analysed by Currency and Fixed/ Variable Rates
Fixed rate
Singapore dollar 12,519 88.0 11,331 91.7 10,790 97.2
US dollar - - 10 # 6 #
Thai Baht 1,010 7.1 775 6.3 113 1.0
Japanese Yen - - - - -
-Hong Kong dollar 477 3.3 155 1.3 131 1.2
Others 224 1.6 86 0.7 67 0.6
Sub-total 14,230 100.0 12,357 100.0 11,107 100.0
Variable rate
Singapore dollar 24,310 42.0 24,745 59.2 25,967 57.6
US dollar 8,694 15.0 8,248 19.7 8,056 17.8
Thai Baht 1,704 3.0 1,814 4.3 3,915 8.7
Japanese Yen 754 1.3 659 1.6 858 1.9
Hong Kong dollar 21,223 36.7 5,284 12.6 4,779 10.6
Others 1,162 2.0 1,059 2.6 1,537 3.4
Sub-total 57,847 100.0 41,809 100.0 45,112 100.0
Total 72,077 54,166 56,219
Analysed by Maturity
Repayable on demand 6,449 8.9 4,714 8.7 4,642 8.3
Due within 1 year 21,616 30.0 16,429 30.4 16,151 28.7
Due over 1 year but within 3
years 12,238 17.0 9,771 18.0 11,088 19.7
Due over 3 years but within
5 years 7,476 10.4 5,751 10.6 5,521 9.8
Due over 5 years 24,298 33.7 17,501 32.3 18,817 33.5
Total 72,077 100.0 54,166 100.0 56,219 100.0
Analysed by Segment @
Singapore 41,729 57.9 40,895 75.5 41,712 74.2
Other ASEAN 3,915 5.4 3,753 6.9 5,358 9.5
Other Asia Pacific 24,825 34.5 7,705 14.2 6,940 12.4
Rest of the World 1,608 2.2 1,813 3.4 2,209 3.9
Total 72,077 100.0 54,166 100.0 56,219 100.0
# : Insignificant
@ : Based on the location of the bank, branch, or office booking the loan.
Appendix
11 At June 30, 2001, total cumulative specific and general provisions for loan
losses amounted to S$2,460 million. Details are as follows:
In S$’million Specific General Total
Interest- in-suspense
Balance at January 1, 2001 1,141 1,002 2,143 49
On acquisition of subsidiary 230 195 425
-Utilisation / transfers during the year (64) (7) (71) (1)
Charge to profit and loss account 19 (55) (36)
-Interest suspended during the year (1) - (1) 14
12 Exposures to Malaysia, Indonesia, Thailand, Korea, the Philippines (Regional Countries), Hong Kong and China
DBSH Group has exposures to certain countries in the Asia Pacific region.
The exposures are determined based on the location of the credit risk of the customers and counterparties regardless of where the transactions are booked.
At June 30, 2001, DBSH Group had assets, both cross-border and local, in the Regional Countries, amounting to S$7,805 million (December 31, 2000: S$7,126 million), and in Hong Kong and China amounting to S$32,648 million (December 31, 2000: S$8,003 million).
The increase in exposure to Hong Kong was due to the consolidation of DHG’s exposures (S$23,694 million) at end-June 2001.
Jun 30 2001 Dec 31 2000 Jun 30 2000
In S$’million Assets NPLs(a) Assets NPLs(a) Assets NPLs(a)
Malaysia 661 309 815 304 791 388
Indonesia 502 141 487 176 729 417
Thailand (excluding DTDB) 326 37 356 49 464 182
Korea 1,385 44 1,044 51 1,020 60
The Philippines 1,679 93 1,354 87 1,412 97
DTDB
4,553
3,252
624
1,143
4,056 3,070
667 1,238
4,416 4,753
1,144 3,000
Total Regional NPLs 7,805 1,767 7,126 1,905 9,169 4,144
Hong Kong 31,614 1,238 6,906 541 6,183 776
China 1,034 145 1,097 153 1,106 158
Total 40,452 3,150 15,129 2,599 16,457 5,078
Appendix
The DBSH Group’s exposures to these countries at June 30, 2001 were as follows:
In S$’million Loans and debt securities
Less: Loans to/Investments in
Financial
Net Exposure
Assets in
Bank
Central Banks & Govt. Securities
Non-Banka
Investments Total
Subsidiaries/
Overseas Branches Amount
As a % of Total Assets
(a) (b) (c) (d) (e)=
(a+b+c+d)
(f) (g)=(e-f) (h)
Malaysia 552 - 588 51 1,192 531 661 0.4
Indonesia 210 54 306 33 603 101 502 0.3
Thailand (excluding
DTDB) 31 9 293 18 351 25 326 0.2
Korea 639 254 492 14 1,398 13 1,385 0.9
The Philippines 302 177 542 903 1,925 245 1,679 1.1
SUB-TOTAL 1,734 494 2,221 1,019 5,467 915 4,553 3.0
DTDB 67 278 2,869 47 3,260 8 3,252 2.1
TOTAL REGIONAL
COUNTRIES 1,801 771 5,090 1,066 8,728 924 7,805 5.0
Hong Kong 3,617 4,104 24,260 6,169 38,147 6,535 31,614 20.2
China 729 45 872 5 1,651 618 1,034 0.7
TOTAL 6,147 4,920 30,222 7,240 48,526 8,076 40,452 25.8
(a) Non-bank loans include loans to government and quasi-government entities.
The DBSH Group’s exposures to these countries at December 31, 2000 were as follows:
In S$’million Loans and debt securities
Less: Loans to/Investments in
Financial
Net Exposure
Assets in
Bank
Central Banks & Govt. Securities
Non-Banka
Investments Total
Subsidiaries/
Overseas Branches Amount
As a % of Total Assets
(a) (b) (c) (d) (e)=
(a+b+c+d)
(f) (g)=(e-f) (h)
Malaysia 664 34 645 48 1,391 576 815 0.8
Indonesia 205 47 301 37 591 103 487 0.5
Thailand (excluding
DTDB) 53 9 302 17 381 25 356 0.3
Korea 609 224 385 13 1,231 187 1,044 1.0
The Philippines 271 137 511 694 1,612 258 1,354 1.3
SUB-TOTAL 1,802 451 2,144 809 5,205 1,149 4,056 3.8
DTDB 58 231 2,748 42 3,079 9 3,070 2.8
TOTAL REGIONAL
COUNTRIES 1,860 682 4,892 851 8,284 1,158 7,126 6.4
Hong Kong 783 202 6,226 1,015 8,226 1,320 6,906 6.2
China 743 27 960 9 1,738 641 1,097 1.0
TOTAL 3,386 911 12,078 1,874 18,249 3,120 15,129 13.6
(a) Non-bank loans include loans to government and quasi-government entities.
Appendix
The DBSH Group’s exposures to these countries at June 30, 2000 were as follows:
In S$’million Loans and debt securities
Less: Loans to/Investments in
Financial
Net Exposure
Assets in
Bank
Central Banks & Govt. Securities
Non-Banka
Investments Total
Subsidiaries/
Overseas Branches Amount
As a % of Total Assets
(a) (b) (c) (d) (e)=
(a+b+c+d)
(f) (g)=(e-f) (h)
Malaysia 617 52 667 47 1,383 593 791 0.8
Indonesia 250 116 451 40 857 128 729 0.7
Thailand (excluding
DTDB) 96 9 396 24 524 60 464 0.5
Korea 632 175 416 14 1,236 216 1,020 1.0
The Philippines 321 134 502 753 1,709 297 1,412 1.4
SUB-TOTAL 1,916 485 2,432 877 5,710 1,294 4,416 4.3
DTDB 73 361 4,258 78 4,771 18 4,753 4.4
TOTAL REGIONAL
COUNTRIES 1,990 846 6,690 955 10,481 1,312 9,169 8.5
Hong Kong 537 142 5,606 926 7,211 1,029 6,183 5.7
China 605 14 974 10 1,603 497 1,106 1.0
TOTAL 3,132 1,003 13,269 1,892 19,295 2,838 16,457 15.3
(a) Non-bank loans include loans to government and quasi-government entities.
13 Non-Performing Loans and Provisions
At June 30, 2001, DBSH Group’s total non-performing loans amounted to S$4,834 million (December 31, 2000: S$4,411 million), of which DHG’s NPLs amounted to S$815 million. Non-performing loans (NPLs) are loans, contingent facilities and debt instruments classified as “Substandard”, “Doubtful” or “Loss” in accordance with MAS Notice 612.
Out of the total NPLs of S$4,834 million:
- S$3,554 million (73%) [December 31, 2000: S$3,508 million (80%)] were in
the substandard category; and
- S$3,030 million (63%) [December 31, 2000: S$2,651 million (60%)] were
secured by collateral.
Appendix
DBSH Group, in consultation with the Monetary Authority of Singapore, made special general provisions on the performing loans to Regional Countries over and above the normal specific and general provisions. Total cumulative specific and general provisions for regional exposure amounted to S$1,206 million at June 30, 2001 (December 31, 2000: S$1,197 million).
Details of DBSH Group’s NPLs and provisions at June 30, 2001 were as follows:
In S$’million
Regional Countries Singapore Other
Countries
Total
DTDB (a) Others
June 30 2001
Non- Performing Loans (NPLs) 1,143 624 1,610 1,457 4,834
- Substandard 943 450 1,369 791 3,554
- Doubtful 7 111 8 309 435
- Loss 193 63 232 356 844
NPLs as a % of:
- Total loans in the respective
countries 35.1% 11.4% 3.4% 2.3% 4.0%
- Group total assets 0.7% 0.4% 1.0% 0.9% 3.1%
Non-bank NPLs as a % of non-bank loans in the respective
countries 38.0% 25.6% 3.6% 5.2% 6.2%
Total Cumulative Provisions 712 494 740 697 2,643
- Specific provisions 538 196 340 390 1,463
- General provisions 174 298 400 307 1,180
Total Cumulative Provisions as a % of:
- Total loans in the respective
countries 21.8% 9.0% 1.6% 1.1% 2.2%
- Group total assets 0.5% 0.3% 0.5% 0.4% 1.7%
- NPLs in the respective countries 62% 79% 46% 48% 55%
- Unsecured NPLs in the respective
Details of DBSH Group’s NPLs and provisions at December 31, 2000 were as follows:
In S$’million
Regional Countries Singapore Other
Countries
Total
DTDB (a) Others
December 31 2000
Non- Performing Loans (NPLs) 1,238 667 1,735 770 4,411
- Substandard 956 501 1,544 507 3,508
- Doubtful 32 98 29 198 358
- Loss 250 68 163 65 545
NPLs as a % of:
- Total loans in the respective
countries 40.2% 12.8% 3.5% 2.3% 4.8%
- Group total assets 1.1% 0.6% 1.6% 0.7% 4.0%
Non-bank NPLs as a % of non-bank loans in the respective
countries 42.7% 28.2% 4.2% 7.5% 7.6%
Total Cumulative Provisions 719 478 787 302 2,286
- Specific provisions 545 191 307 194 1,237
- General provisions 174 286 480 108 1,049
Total Cumulative Provisions as a % of:
- Total loans in the respective
countries 23.4% 9.2% 1.6% 0.9% 2.5%
- Group total assets 0.6% 0.4% 0.7% 0.3% 2.1%
- NPLs in the respective countries 58% 72% 45% 39% 52%
- Unsecured NPLs in the respective
Appendix
Details of DBSH Group’s NPLs and provisions at June 30, 2000 were as follows:
In S$’million
Regional Countries Singapore Other
Countries
Total
DTDB (a) Others
June 30 2000
Non- Performing Loans (NPLs) 2,999 1,144 2,452 1,071 7,666
- Substandard 1,235 825 2,171 712 4,943
- Doubtful 96 115 43 325 579
- Loss 1,669 205 237 33 2,144
NPLs as a % of:
- Total loans in the respective
countries 62.9% 20.0% 5.2% 3.2% 8.4%
- Group total assets 2.8% 1.1% 2.3% 1.0% 7.1%
Non-bank NPLs as a % of non-bank loans in the respective countries
68.7% 42.0% 5.7% 10.6% 12.7%
Total Cumulative Provisions 1,832 794 876 477 3,978
- Specific provisions 1,693 427 406 279 2,804
- General provisions 138 367 470 198 1,174
Total Cumulative Provisions as a % of:
- Total loans in the respective
countries 38.4% 13.9% 1.8% 1.4% 4.4%
- Group total assets 1.7% 0.8% 0.8% 0.4% 3.7%
- NPLs in the respective countries 61% 69% 36% 45% 52%
- Unsecured NPLs in the respective
countries 126% 101% 106% 121% 115%
13.1 Industry Analysis of Non-Performing Loans
The following table shows the industry breakdown of the non-performing loans of DBSH Group:
In S$’million
Jun 30 2001
Distribution %
Dec 31 2000
Distribution %
Jun 30 2000
Distribution %
Manufacturing 895 18.5 917 20.8 1,786 23.3
Building and Construction 946 19.6 878 19.9 1,767 23.1
Housing Loans 299 6.2 254 5.8 470 6.1
General Commerce 890 18.4 847 19.2 1,445 18.8
Transportation, Storage
and Communications 280 5.8 234 5.3 337 4.4
Financial Institutions, Investment and Holding Companies
503 10.4 433 9.8 682 8.9
Professionals and Private Individuals (except Housing Loans)
415 8.6 285 6.5 366 4.8
Others 606 12.5 563 12.7 813 10.6
Appendix
13.2 Accrual, Past Due and Restructured Loans
The following table shows an analysis of non-performing loans in accordance with United States Securities and Exchange Commission (SEC) guidelines. The DBSH credit risk management procedures are based on MAS Notice 612 loan gradings. The information included, which is not derived from those procedures, is presented to enable users to compare DBSH with other international institutions. This information is not required under the Singapore Companies Act.
In S$’million
Jun 30 2001
Dec 31 2000
Jun 30 2000 Singapore
Non accrual loans 1,431 1,403 1,888
Non – Restructured Restructured
1,071 360
897 506
1,572 317
Regional Countries
Non accrual loans 1,670 1,784 3,954
Non – Restructured Restructured
546 1,124
698 1,087
2,419 1,535
Other Countries
Non accrual loans 1,309 537 701
Non – Restructured Restructured
1,096 213
417 120
624 78
Total 4,410 3,724 6,544
14 Segment Analysis
Geographical Segmental Analysis (Secondary segment information)
DBSH Group operates in four main geographical areas:
• Singapore, the home country of DBSH, which includes all the areas of
operations in the primary business segments.
• “Other ASEAN countries”, which includes business activities in Brunei,
Cambodia, Indonesia, Laos, Malaysia, Myanmar, the Philippines, Thailand and Vietnam. The main activities for other Asean countries comprise mainly branch and subsidiary operations.
• “Other Asia Pacific countries”, which includes business activities Australia,
Bangladesh, China, Hong Kong, India, Japan, Korea, New Zealand, Pakistan, Papua New Guinea, Russia, Sri Lanka and Taiwan. The main activities for other Asia Pacific countries comprise mainly branch and subsidiary operations.
• Rest of the World- the main activities are branch operations.
Appendix
In S$’million Total assets
(b)
Distribution %
Income before operating
expenses
Distribution %
Net profit Attributable to
members
Distribution % June 30 2001
Singapore (a) 86,869 55.5 1,239 81.2 558 88.7
Other ASEAN (a) 4,736 3.0 71 4.6 (2) (0.3)
Other Asia Pacific 58,475 37.4 194 12.7 57 9.1
Rest of the World 6,417 4.1 24 1.5 16 2.5
Total 156,497 100.0 1,528 100.0 629 100.0
December 31 2000
Singapore (a) 89,888 80.8 2,406 82.1 1,207 86.9
Other ASEAN (a) 4,491 4.0 124 4.2 5 0.4
Other Asia Pacific 11,715 10.6 345 11.8 136 9.8
Rest of the World 5,134 4.6 56 1.9 41 2.9
Total 111,228 100.0 2,931 100.0 1,389 100.0
June 30 2000
Singapore (a) 86,053 80.0 1,199 80.5 604 85.8
Other ASEAN (a) 5,171 4.8 93 6.3 10 1.4
Other Asia Pacific 11,192 10.4 165 11.1 66 9.4
Rest of the World 5,136 4.8 31 2.1 24 3.4
Total 107,552 100.0 1,488 100.0 704 100.0
(a) Singapore includes the operations of the Asian Currency Unit. Special general provisions for regional exposures and additional
specific provisions for DTDB’s loans are booked in Singapore.