Full Terms & Conditions of access and use can be found at
http://www.tandfonline.com/action/journalInformation?journalCode=vjeb20
Download by: [Universitas Maritim Raja Ali Haji] Date: 11 January 2016, At: 20:27
Journal of Education for Business
ISSN: 0883-2323 (Print) 1940-3356 (Online) Journal homepage: http://www.tandfonline.com/loi/vjeb20
A Peer Assessment System to Improve Student
Team Experiences
Robert Anson & James A. Goodman
To cite this article: Robert Anson & James A. Goodman (2014) A Peer Assessment System to Improve Student Team Experiences, Journal of Education for Business, 89:1, 27-34, DOI: 10.1080/08832323.2012.754735
To link to this article: http://dx.doi.org/10.1080/08832323.2012.754735
Published online: 13 Dec 2013.
Submit your article to this journal
Article views: 243
View related articles
CopyrightC Taylor & Francis Group, LLC ISSN: 0883-2323 print / 1940-3356 online DOI: 10.1080/08832323.2012.754735
A Peer Assessment System to Improve
Student Team Experiences
Robert Anson and James A. Goodman
Boise State University, Boise, Idaho, USA
Groups are frequently used in courses, but there is substantial evidence that insufficient attention is paid to creating conditions for successful teamwork. One key condition is high-quality, individual, and team-level feedback. An online peer assessment system and team improvement process was developed for this test case based on three design criteria: efficient administration of the assessment, promotion of quality feedback, and fostering effective team processes. Sample data from 13 teams were collected to propose a means of testing the system against these criteria.
Keywords: collaboration, feedback, peer evaluation, team
At the sixth annual Teaching Professor conference, three un-dergraduates were invited to talk about their student experi-ences. They made a plea to the college instructors assembled, “no more group assignments—at least not until you figure out how to fairly grade each student’s individual contributions” (Glenn, 2009, para. 1).
Across most disciplines, faculty make frequent use of student groups to create engaging learning environments, develop collaboration skills, and meet employer needs for people who can work effectively in teams. While the goal is to provide a positive learning experience, the reality often falls short (Pieterse & Thompson, 2006). Oakley, Hanna, Kuzmyn, and Felder (2007) reported that 68% of engineering students worked in teams, and one quarter were dissatisfied while Bolton (1999) found 72% of business students reported working in teams, with one third dissatisfied. In both cases the principal culprit was the presence of shirkers or slackers, reported in one third of undergraduate classes, and one fifth of graduate classes (Oakley et al., 2007).
Peer assessment is widely used by instructors to discour-age social loafing, assign individual grades, and help students learn from others’ observations of their behavior. In general there are two types of peer assessment approaches: summa-tive and formasumma-tive. Summasumma-tive assessment typically occurs after the team endeavor to determine grades. Formative
as-Correspondence should be addressed to James A. Goodman, Boise State University, Center for Teaching and Learning, 1910 University, Boise, ID 83725-1005, USA. E-mail: jamesgoodman1@boisestate.edu
sessment is conducted during the class or project to provide feedback for improving the teamwork processes or products. Both approaches are frequently used.
Oakley, Felder, Brent, and Elhajj (2004) emphasized in-terim formative assessments. Gueldenzoph and May (2002) reviewed the peer assessment literature for best practices and found that nongraded, formative assessments are the most ef-fective means to help the team surface and resolve problems. Bacon, Stewart, and Silver (1999) cautioned against using end-of-term, summative peer assessments because they may actually expand team differences. Members may tolerate un-desirable behaviors instead of confronting them, “thinking that they can ‘burn’ those they are in conflict with at the end of the quarter on the peer assessments” (Bacon et al., 1999, p. 474).
Brutus and Donia (2010) noted that most research has focused on peer assessment effects within evaluated groups. Their study examined students who did team projects in two consecutive semester courses; some completed peer assess-ments both semesters, while others did so only in the final semester. They found that student performance in the repeat assessment groups was significantly higher than for students who were only evaluated once. Their study raised the po-tential that peer assessment feedback could help students develop team skills and that positive effects of peer assess-ment feedback may be enhanced through repeated use and greater emphasis in the pedagogical process.
Unfortunately, as Cheng and Warren (2000) countered, effective peer assessment can be time consuming to ad-minister with traditional methods. Administrative time is a
28 R. ANSON AND J. A. GOODMAN
disincentive to the willingness of faculty to conduct repeated formative assessments with which students may actually im-prove their collaboration skills. To combat this, logistics need to be addressed. Our test case research will describe a researcher-developed system to collect and process peer assessment data. The hosted web-system is available to the larger education community. This research also suggests a pedagogical process for conducting the formative peer as-sessments designed to enhance team development. Sample data are collected in an exploratory manner to indicate how future research could validate its efficacy.
STUDY
Our long-term goal, in which this study is a first major step (Ferrance, 2000), was to enable students to become more effective team members. Toward this end, we developed a web-based system for capturing and reporting student team peer assessment feedback. The system was designed to ac-complish three principle objectives: (a) administer the feed-back process efficiently, (b) promote quality feedfeed-back, and (c) foster effective team processes.
The first objective, efficiency in collecting, compiling, and reporting peer assessments, is necessary for instruc-tors to consider engaging in the peer assessment process. Paper-based feedback methods have various disadvantages: instructor effort and time to transcribe or summarize com-ments (a requirement to maintain anonymity), as well as delays in returning results to students. The instructor effort is a disincentive to frequent formative feedback rounds. The re-sult is longer delays between behavior and feedback, or use of summative feedback only, which is more punitive than behavior-changing. Students are only able to improve if they receive the feedback in a timely manner as a formative tool for improving behaviors.
The second and third objectives, quality feedback and effective team processes, are based on the expectation that individuals will be much more willing to change their behav-iors within the team when provided constructive information about what to change. If the system can promote quality feed-back and foster more effective team processes in the short term, students will be more likely to learn to become more effective at working in teams over the long term. Handwrit-ten comments present two anonymity issues that may affect feedback quality: (a) the receiver is more likely to interpret the feedback in light of his perceptions of the author and (b) the author is likely to reduce his candor regarding certain behaviors.
Sample data were collected from two courses taught by one author (R. A.) in information technology manage-ment. Both involved upper-division undergraduate students working in four to five person teams on extended, multi-phase projects. One was a senior project capstone course in which student teams worked on real client projects across
the semester. The five teams had full responsibility for their work and client relationship while designing and developing an information system. The second course was in systems analysis and design. Seven teams worked together through a 13-week project delivered in four phases. The course and project addressed gathering, analyzing, and prototyping re-quirements for a new information system.
Historically, teams have been an important aspect of both courses. Usually the teams work well together, but, anecdo-tally, there are often some broken teams bringing their prob-lems to the instructor. Slackers are the most common symp-tom, but the circumstances differ wildly. The core problem appears to be remarkably consistent, involving some block-age in group communications. A behavior (or lack of it) is observed by other team members, then problems snowball as assumptions fill in the cause or motivation, and members withdraw or exclude other members from key conversations, meetings, or assignments.
Our question was the following: Will improving the feed-back communications between students affect the incidence of broken teams? If members regularly gave feedback to one another in a constructive, problem-solving atmosphere, could we reduce the incidence of miscommunications turn-ing molehills into mountains? If we instituted a process in which student team members had a safe and legitimized space for sharing and discussing feedback, could we overcome the tendency of students, as peers, to avoid giving constructive feedback to one another?
TEAM IMPROVEMENT SYSTEM
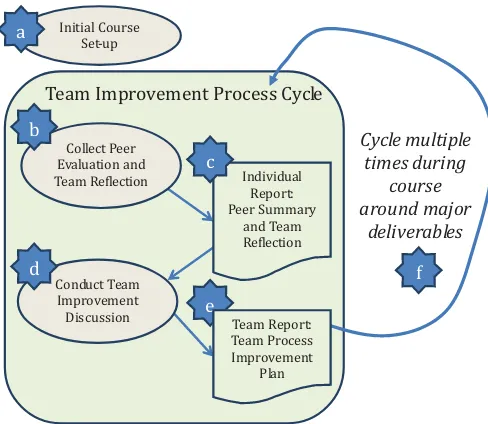
The feedback process was administered by a system consist-ing of software and processes. Figure 1 illustrates the broad outlines of the team improvement process (TIP) designed for use with the system. After the initial class setup, the instruc-tor may conduct as many formative or summative assessment cycles through the TIP as he wishes with a minimum of extra administrative effort. The system components are described below for each step of the process.
The peer assessment system (PAS) was designed to con-duct summative and formative peer assessments of student team behaviors. One author (R. A.) tested and refined the prototype for two years before he and a colleague developed the current, fully hosted, online system.
Initial Course Setup
Three setup steps were required for the course. The first step was forming teams. The instructor assigned teams using criteria of common meeting time blocks and diverse skills and interests. Second, in one course, an hour of initial team training was provided (a prerequisite to senior project). Stu-dents read “Coping with Hitchhikers and Couch Potatoes on Teams” by Oakley (2003) and related their past experiences
Team Improvement Process Cycle
Cycle multiple times during
course around major
deliverables Collect Peer
Evaluation and Team Reϐlection
Conduct Team Improvement Discussion
Individual Report: Peer Summary
and Team Reϐlection b
c
d
e
f Initial Course
Set-up a
Team Report: Team Process Improvement
Plan
FIGURE 1 Team improvement process (TIP) for gathering and disseminating team behavior feedback (color figure available online).
back to the case in a short essay. This was followed by an in-class discussion about team problems and best practices. Then teams developed a team charter—an extended form of the expectations agreement used by Oakley et al. (2004)—for their first project milestone.
The third step was to load the student information into PAS from a simple Excel file with student names, email addresses, and team names. Finally, three assessments were set up for the classes. Each assessment was defined by a start, end, and two reminder dates so that PAS could send preformatted email messages to students with links to take their survey or access their personalized report.
Peer and Team Reflection Survey
Each TIP cycle started by emailing the invitation message and link to each student to complete the assessment out-side of class. Many of the questions were adapted from Oakley et al. (2004). See Appendix A for an abbreviated form of the questions. The four question sets included closed and open-ended peer assessment questions repeated for each team member (and the respondent—as a self-reflection) then a set of closed and open-ended questions regarding the team.
Individual Report: Peer Summary and Team Reflection
When the assessment ends, PAS emails the students a link to view their personalized feedback report. Closed responses are summarized and open-ended responses are listed anony-mously. Appendix A illustrates a sample student report that includes (a) averaged ratings on nine questions about his or her team citizenship behaviors, (b) suggestions supplied to student by team members (anonymous), (c) averaged
rat-ings on eight questions about overall team functioning, and (d) responses to three open-ended questions about the team (anonymous).
The comprehensive instructor report is similar to the stu-dent report except that it istu-dentifies the author of ratings and comments to enable the instructor to explore potential biases and inappropriate comments. The instructor report also dis-plays results for a holistic rating question to calculate grades for individual team participation.
Conduct Team Improvement Discussion
In formative assessment rounds for this study, based on the TIP, the instructor printed student reports to hand out in class with a few minutes to silently read. Then teams met for a focused, 10–15-min team improvement discussion. To guide the discussion, a common post-review technique was used: (a) What are we doing well? (b) What are we doing poorly? (c) What are the top three things we should do differently? This approach is both simple, easily adopted, and reinforced a common real-world approach.
Team Process Improvement Plan
Each team member was asked to take meeting notes during the improvement discussion. These notes were transcribed into the team’s process improvement plan for their next phase of work.
TIP Assessment Cycles
Three assessment cycles were conducted in each course, fol-lowing each major project milestone. These included two for-mative peer assessments, at approximately the one-third and two-thirds points in the class, plus a final summative round in
30 R. ANSON AND J. A. GOODMAN
which the TIP cycle ended after step (b). In the senior project course, team participation was qualitatively factored into the individual’s final grade. In the analysis and design course, students were awarded individualized project participation points (up to 10% of the project total.) These individual team points were calculated using an approach adapted from the Cheng and Martin (2000) study that adjusted individual stu-dent participation by the team’s rating norms: (individual score / average individual score for team)×(.10×possible project points). The individual score question, using a 9-point scale, reads “For{Team Member}, please rate his/her level of participation, effort and sense of responsibility, not his or her academic ability. This evaluation is confidential and will not be shared with your team members,” and was evaluated with the following scale anchors: 1 =excellent; 2=very good; 3 = satisfactory; 4 =ordinary; 5 =marginal; 6 =
deficient; 7=unsatisfactory; 8=superficial; 9=no show.
SAMPLE DATA AND MEASUREMENTS
Sample data were collected to illustrate possible assessments of each design goal—(a) efficient administration, (b) quality feedback, and (c) effective processes. These data are pre-sented here to suggest how a more rigorous study, using a larger sample and control groups, could reliably evaluate the efficacy of the PAS as a whole, and in terms of particular features.
Efficiently Administer the Feedback Process
Administrative efficiency could be evaluated by recording the average time for the instructor and students to complete each step of the assessment process. Table 1 shows the average times in the sample data for the preliminary setup, as well as for the instructor and student activities related to each step in the TIP. These times are averaged across the two courses and the three assessment iterations for each course. Shaded cells represent in-class activities.
Overall, the instructor spent an average of 15 min at the start of the semester to set up each course and customize emails in the web survey software. This did not include time required to create a spreadsheet with the student names, emails and team names to upload, nor time to assign students to teams. Then each cycle required about 25 min of instructor and 25 min of student time. In total, only 25 min of class time were required per cycle to hold team improvement discus-sions. The system, however, allows students to access their feedback reports online. If in-class team discussions were not held, each cycle would require only 10 min of instructor and student time (step b), plus time spent reviewing feedback.
Promote Quality Feedback
Feedback quality could be measured by evaluating the student-peer comments against criteria denoting feedback
TABLE 1
Average Times for Instructor and Student to Complete Each Activity of the Team Improvement Process
TIP step Instructor time
Cycle time per
Set up course and customize messages (create student spreadsheet, assigning teams, and training time is not included)
Total One time setup: 15 min Per cycle: 25 min
Per cycle: 25 min
Note.TIP=Team Improvement Process.
quality. Extensive literature exists regarding feedback char-acteristics that are more likely to produce behavior change to close a performance gap. DeNisi and Kluger (2000) con-ducted a meta-analysis of the feedback effectiveness litera-ture to examine how to improve feedback interventions in general, and 360◦appraisals in particular. Among their
find-ings, they recommended feedback interventions that focused on the task performance and not on the person, include spe-cific suggestions for improvement, do not compare individu-als’ performance to others, and deliver feedback by computer instead of in person.
Another feedback characteristic that has received atten-tion is the positive or negative orientaatten-tion of the feedback. DeNisi and Kluger (2000), among others, pointed out the complex effects of feedback orientation on performance. While Lizzio, Wilson, Gilchrist, and Gallois (2003) found that using positive feedback could help mitigate adverse ef-fects of negative (i.e., corrective) feedback on self-esteem in management situations, studies of students have found pos-itive comments were often discounted (Hyland & Hyland, 2001) or that positive feedback may soften critical comments
TABLE 2
Characteristics Used to Code Comments for Feedback Quality of the peer’s participation Specificity Constructive,
to the point where the feedback loses its impact on behavior change (Young, 2000).
We suggest evaluating feedback quality using the three cri-teria shown in Table 2: task focus, directive, and orientation. Values relating to high-quality feedback are also identified in the table.
A total of 134 comments were submitted to the question “make at least one to two constructive suggestions for [team member name] to improve his or her team participation and contribution.” Of the 160 promptings, 131 (82%) received comments. The authors independently coded each comment by task focused, constructive, and orientation with a com-posite interrater reliability of 94%, indicating that the codes were consistently interpreted.
Our experience is that students often find it difficult, as peers, to provide directive comments to one another that seek to guide effective behavior. However, as shown in Table 3, over two-thirds of the comments (69%) were directive. The majority of comments (61%) focused on process while only 16% focused on tasks. Nearly half (47%) of the comments were positive while 37% were negative (indicating a need for change).
Mixed-orientation comments comprised only 14% of the total. We would like to have seen more of these which are often believed to be the most effective due to the positive effect they might generate to propel behavior changes. The only other sizable set of comments was positive, nondirec-tional comments. These evoke a general sense of support but lack sufficient specificity to aid individual improvement.
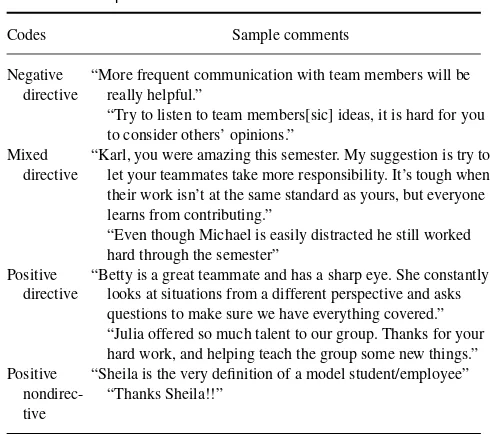
To provide a sense of the types of comments students provided to one another, Table 4 provides some examples of comments. The codes for orientation and direction are included.
TABLE 3
Orientation and Directive Nature of Relevant Peer Comments Input by Students
Directionality or directive
Item Constructive/specific general/nonspecific Total % (n)
Orientation
Positive 18 29 47 (60)
Negative 36 0 37 (47)
Mixed 14 0 15 (19)
Note.Totals may equal more than 100% due to rounding.
Foster Effective Team Processes
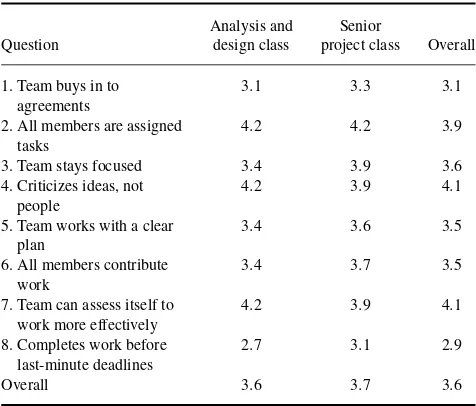
To evaluate team process effectiveness, questions included within the Peer Assessment were available. Each student was asked how his team used eight important team processes. Each team process was rated on a 4-point Likert-type scale ranging from 1 (never) to 5 (always). The results in Table 5 show the average scores across all eight questions by class. See full questions in Appendix A, question B1.
Three team processes stood out as strengths for most teams: assigning tasks to all members, focusing criticism on ideas instead of on people, and the team’s ability to as-sess itself. The latter two points may have been related to the TIP used in these classes. One item stood out as a weakness,
TABLE 4
Sample Student Peer Assessment Comments
Codes Sample comments
Negative directive
“More frequent communication with team members will be really helpful.”
“Try to listen to team members[sic] ideas, it is hard for you to consider others’ opinions.”
Mixed directive
“Karl, you were amazing this semester. My suggestion is try to let your teammates take more responsibility. It’s tough when their work isn’t at the same standard as yours, but everyone learns from contributing.”
“Even though Michael is easily distracted he still worked hard through the semester”
Positive directive
“Betty is a great teammate and has a sharp eye. She constantly looks at situations from a different perspective and asks questions to make sure we have everything covered.” “Julia offered so much talent to our group. Thanks for your hard work, and helping teach the group some new things.” Positive
nondirec-tive
“Sheila is the very definition of a model student/employee” “Thanks Sheila!!”
32 R. ANSON AND J. A. GOODMAN
TABLE 5
Average Rating for Each Team Process by Class
Analysis and Senior
Question design class project class Overall
1. Team buys in to agreements
3.1 3.3 3.1
2. All members are assigned tasks
4.2 4.2 3.9
3. Team stays focused 3.4 3.9 3.6
4. Criticizes ideas, not people
4.2 3.9 4.1
5. Team works with a clear plan
3.4 3.6 3.5
6. All members contribute work
3.4 3.7 3.5
7. Team can assess itself to work more effectively
4.2 3.9 4.1
8. Completes work before last-minute deadlines
2.7 3.1 2.9
Overall 3.6 3.7 3.6
Note.Ratings were defined on a 5-point Likert-type scale ranging from 1 (never) to 5 (always).
“completes work before last minute deadlines.” This was consistent with the instructor’s informal observations that student teams were extremely deadline-driven.
One final point should be raised about the findings in Ta-ble 5. The literature suggests that the presence of a slacker appears to be the single greatest cause of team problems. Question 6, “All members contribute work” provides a means of comparing the findings in this study with others. Analyzed on the team level, only two of 13 teams (15%) had an aver-age score below 3.0. On the individual level, only 11 of 54 students, about 20%, rated a team member as a 1 (never) or a 2 (rarely) on this measure. In comparison, Oakley et al. (2007) reported that 29% of all engineering students taking classes over a two-year period reported at least one slacker among their course teams.
DISCUSSION
Formative feedback, focused on team behaviors, can be a potent ingredient for improving student teamwork (Guelden-zoph & May, 2002; Kaufman & Felder, 2000; Oakley et al., 2004). However, the question of efficiency raised by Cheng and Warren (2000), is an important practical issue to over-come. Conducting formative assessments, especially multi-ple rounds during the life of a student team, can consume extensive instructor time and effort. Can use of a computer system improve the efficiency of administering formative peer assessments and improve the quality of feedback and the changes in team behavior? This study illustrates the de-sign and use of a computerized peer assessment system and
describes the collection of sample data that, in a larger study, could provide conclusive support for this question.
Four design decisions for PAS were intended to positively influence the quality of feedback and impact on team behav-iors. First, anonymity was intended to enable the receiver to focus on the content of the feedback, rather than the source. Second, increasing assessment efficiency was proposed to encourage instructors to make more frequent opportunities for teams and members to reflect on and improve their behav-iors. Third, open-ended questions concerning the individual and team were intended to engage the student in constructive reflection of their own, their peers’, and their team’s behav-iors. Finally, the team improvement discussion immediately following the feedback report was planned to redirect indi-vidual attention toward taking positive, practical changes as a team. Further research will be needed to isolate these effects. This study is missing three important factors that need to be added in future research. This study lacked control groups without peer assessment, or which employed alternative as-sessment methods, to determine the extent of difference made by the PAS intervention. Similarly, there were too few teams to examine the relative strength of various influences. Lastly, some degree of longitudinal assessment is needed for both in-dividuals and teams. It must be possible to determine whether any immediate, observed effects on students or teams consti-tute longer term learning and change.
Relatively few changes to the system are required. Prin-ciple among the changes is adding the ability to compare assessment results over time to track individual or team progress. This information could help the individual iden-tify persistent behavioral weaknesses on which to focus his or her change efforts, or assist efforts to coach or instruct stu-dents in how to improve his or her team skills. If the system could track a student’s assessments across different teams and different course topics or types of interactive environ-ments, the assessment information could have even greater impact (McGourty et al., 2001).
Two process changes should be tested, based on sugges-tions from Kaufman and Felder (2000). First, they recom-mended adding a preliminary practice assessment cycle, us-ing a case, for students to gain familiarity with the assess-ment. A similar approach could be used for students to see how the PAS application works, to understand the questions asked, and to view the anonymous report format. The second change is to apply guidance in brief, just-in-time crisis clin-ics at key team development stages. The insight gained by an instructor into the challenges shared across teams could enable a targeted approach to such interventions.
CONCLUSION
Oakley et al. (2007) summed up their report with the fol-lowing: “Students are not born knowing how to work ef-fectively in teams, and if a flawed or poorly implemented
team-based instructional model is used, dysfunctional teams and conflicts among team members can lead to an unsatisfac-tory experience for instructors and students alike” (p. 270). Bacon et al. (1999) wrote, “Students learn more about teams from good team experiences than from bad ones” (p. 485). A key best practice for fostering positive student team experi-ences is to provide individual students and teams with timely and repeated high-quality feedback (Johnson, Johnson, & Smith, 1991). Without feedback, students will not be able to learn to improve their behaviors—this time, or the next time around.
REFERENCES
Bacon, D., Stewart, K., & Silver, W. (1999). Lessons from the best and worst student team experiences: How a teacher can make the difference. Journal of Management Education,23, 467–488.
Bolton, M. (1999). The role of coaching in student teams: A just-in-time approach to learning.Journal of Management Education,23, 233– 250.
Brutus, S., & Donia, M. (2010). Improving the effectiveness of students in groups with a centralized peer evaluation system.Academy of Manage-ment Learning and Education,9, 652–662.
Cheng, W., & Warren, M. (2002). Making a difference: Using peers to assess individual students’ contributions to a group project.Teaching in Higher Education,5, 243–255.
DeNisi, A., & Kluger, A. (2000). Feedback effectiveness: Can 360-degree appraisals be improved?The Academy of Management Executive,14, 129–139.
Ferrance, E. (2000).Action research. Providence, RI: Brown University Northeast and Islands Regional Education Laboratory.
Glenn, D. (2009, June 8). Students give group assignments a fail-ing grade. The Chronicle of Higher Education. Retrieved from http://chronicle.com/daily/2009/06/19509n.htm
Gueldenzoph, L., & May, L. (2002). Collaborative peer evaluation: Best practices for group member assessments.Business Communication Quar-terly,65, 9–20.
Hyland, F., & Hyland, K. (2001). Sugaring the pill: Praise and criticism in written feedback.Journal of Second Language Writing,10, 185–212. Johnson, D. W., Johnson, R. T., & Smith, K. A. (1991).Cooperative
learn-ing: Increasing college faculty instructional productivity. Washington, DC: ASHE-ERIC Higher Education.
Kaufman, D., & Felder, R. (2000). Accounting for individual effort in coop-erative learning teams.Journal of Engineering Education,89, 133–140. Lizzio, A., Wilson, K., Gilchrist, J., & Gallois, C. (2003). The role of gender
in the construction and evaluation of feedback effectiveness.Management Communication Quarterly,16, 341–379.
McGourty, J., Shuman, L., Besterfield-Sacre, M., Hoare, R., Wolfe, H., Olds, B., & Miller, R. (2001, October).Using technology to enhance outcome assessment in engineering education. Paper presented at the 31st ASEE/IEEE Frontiers in Education Conference, Reno, NV. Oakley, B. (2003). Coping with hitchhikers and couch potatoes
on teams. Retrieved from http://cgi.stanford.edu/∼dept-ctl/cgi-bin/ tomprof/posting.php
Oakley, B., Felder, R., Brent, R., & Elhajj, I. (2004). Turning student groups into effective teams.Journal of Student Centered Learning,2(1), 9–34. Oakley, B., Hanna, D., Kuzmyn, Z., & Felder, R. (2007). Best practices
involving teamwork in the classroom: Results from a survey of 6,435 engineering student respondents.IEEE Transactions on Education,50, 266–272.
Pieterse, V., & Thompson, L. (2006). A model for successful stu-dent teams. Retrieved from http://www.cs.up.ac.za/cs/vpieterse/pub/ PieterseThompson.pdf
Young, P. (2000). ”I might as well give up”: Self-esteem and mature students’ feelings about feedback on assignments.Journal of Further and Higher Education,24, 409–418.
34
R.
ANSON
AND
J.
A.
GOODMAN
APPENDIX
A:
Student
Repor
t