Methodological Issues and Findings–Part I
Jeff A. Stanley, Jay W. Pettegrew, and Matcheri S. Keshavan
Our knowledge of the biological basis of schizophrenia has significantly increased with the contribution of in vivo proton and phosphorus magnetic resonance spectroscopy (MRS), a noninvasive tool that can assess the biochemistry from a localized region in the human body. Studies thus far suggest altered membrane phospholipid metabolism at the early stage of illness and reducedN-acetylaspartate, a measure of neuronal volume/viability in chronic schizo-phrenia. Inconsistencies remain in the literature, in part due to the complexities in the MRS methodology. These complexities of in vivo spectroscopy make it important to understand the issues surrounding the design of spectros-copy protocols to best address hypotheses of interest. This review addresses these issues, including 1) understanding biochemistry and the physiologic significance of metabo-lites; 2) the influence of acquisition parameters combined with spin–spin and spin–lattice relaxation effects on the MRS signal; 3) the composition of spectral peaks and the degree of overlapping peaks, including the broader un-derlying peaks; 4) factors affecting the signal-to-noise ratio; 5) the various types of localization schemes; and 6) the objectives to produce accurate and reproducible quan-tification results. The ability to fully exploit the potentials of in vivo spectroscopy should lead to a protocol best optimized to address the hypotheses of interest. Biol Psychiatry 2000;48:357–368 ©2000 Society of Biologi-cal Psychiatry
Key Words:in vivo, proton, phosphorus, brain, spectros-copy, quantification
Introduction
O
ver the past decade, in vivo proton (1H) andphos-phorus (31P) magnetic resonance spectroscopy
(MRS) have found increasing application in schizophrenia research. Phosphorus MRS studies have observed altered levels of membrane phospholipid metabolites in the
pre-frontal region of first-episode schizophrenia subjects, sup-porting the hypothesis of a neurodevelopmental abnormal-ity in this illness (Pettegrew et al 1991; Stanley et al 1995b). Proton MRS studies have observed reduced N -acetylaspartate (NAA), a metabolite reflecting the volume and/or viability of neurons in the prefrontal and temporal lobes. Although these observations offer insightful infor-mation about the the biological basis of schizophrenia, inconsistencies remain in the literature. At least in part, this may be due to the complexities of the rapidly changing MRS methodology.
Magnetic resonance spectroscopy, like magnetic reso-nance imaging (MRI), is based on the principle of nuclear magnetic resonance (MR) (Farrar and Becker 1971; Fuku-shima and Roeder 1981; Gadian 1995); however, unlike MRI, which provides cross-sectional, anatomic images based on the tissue water environment, MRS provides a “frequency-signal intensity” spectrum of multiple peaks that reflect the biochemical composition of a localized region in the body. Each biochemical or metabolite is identified by its unique position or chemical shift along the frequency axis of a spectrum, and the peak intensity or the area under the peak is proportional to the concentration of that assigned metabolite. Magnetic resonance spectros-copy is a challenging and complex noninvasive tool, which can be applied using numerous approaches. The investigator has the choice of selecting the nuclei of interest (e.g.,1H or31P), the magnetic field strength of the MR system, the transmit/receive coil configuration, the method used to localize the region of interest, and the method to postprocess and quantify the MRS data. As a result, the observed data can represent biochemical infor-mation from a single localized three-dimensional volume, or from multiple voxels in a single cross-sectional slice or multiple slices—also known as spectroscopic imaging (MRSI) or chemical shift imaging (CSI). Depending on the magnetic field strength of the MR system, sensitivity of the nuclei, coil configuration, localization scheme, and acquisition parameters, the localized brain tissue volume size can range from a fraction of 1 cm3 up to approxi-mately 60 cm3. The metabolite information obtained by quantifying the peak areas can pertain to the metabolism of membrane phospholipids, high-energy phosphates, and
From the Neurophysics Laboratory (JAS, JWP), Department of Psychiatry (JAS, JWP, MSK), Western Psychiatric Institute and Clinic, University of Pittsburgh School of Medicine, Pittsburgh, Pennsylvania.
Address reprint requests to Matcheri S. Keshavan, M.D., University of Pittsburgh Medical Center, Western Psychiatric Institute & Clinic, 3811 O’Hara Street, Room 984, Pittsburgh PA 15213.
Received January 12, 2000; revised May 12, 2000; accepted May 26, 2000.
© 2000 Society of Biological Psychiatry 0006-3223/00/$20.00
neuronal processes. Due to the above different approaches available to address a particular biochemical question, it is important to have a comprehensive understanding of MRS methodology. Such understanding is critical when design-ing an in vivo MRS protocol best optimized to test the hypotheses of interest in psychiatric research. In this review we discuss the issues surrounding the process of designing and optimizing an in vivo 1H and 31P MRS
protocol to study the human brain, including 1) the biochemical information, 2) factors influencing the signal-to-noise ratio (S/N), 3) acquisition schemes, and 4) post-processing and quantification methods.
Understanding the Biochemistry
1H Metabolites
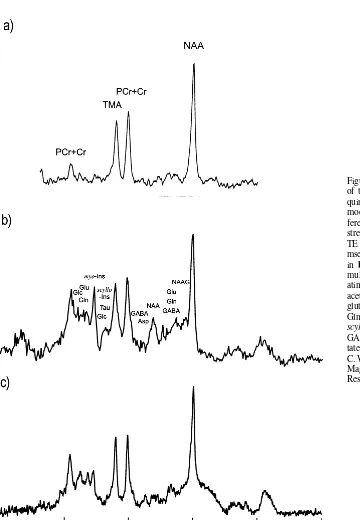
A typical in vivo 1H brain spectrum includes singlet resonances from NAA, phosphocreatine plus creatine (PCr1Cr), and trimethylamines (TMAs) at 2.01, 3.02, and 3.20 ppm, respectively (Figure 1). Multiple spectral peaks or multiplets from glutamate, glutamine, myo-inositol,
g-aminobutyric acid (GABA), aspartate,N -acetylaspartyl-glutamate (NAAG), taurine, glucose, and scyllo-inositol are also present in a typical in vivo 1H brain spectrum. These multiplets (e.g., doublets or triplets) are the result of through-bond interactions between protons of CH, CH2,
CH3 groups, etc. (and, likewise in the 31
P mode, the phosphorus of PO3groups) from the same molecule and
the strength of this interaction is characterized by a scalar J-coupling constant. The phase of the spectral peaks within a multiplet changes or modulates as a function of the acquisition parameter (e.g., the spin– echo time [TE] of a 90°-TE/2-180°-TE/2 spin– echo pulse sequence; for fur-ther details, see Gadian 1995) and the scalar J-coupling constant (Ernst and Hennig 1991). Therefore, these latter metabolites are best observed by minimizing the modula-tion (i.e., by minimizing the TE) or by choosing a TE/2 interval that is a multiple of 1/2 J (Table 1).
N-Acetylaspartate, which is second to glutamate in terms of total concentration of free amino acids, accounts for approximately 85–90% of the proton signal of the N-acetyl group, and NAAG primarily accounts for the remaining 10 –15%, depending on the localized brain region (Frahm et al 1991; Pouwels and Frahm 1997). Both NAA and NAAG are localized exclusively in mature neurons and neuronal processes, and not in glia (Urenjak et al 1993).N-Acetylaspartate is formed in mitochondria from acetyl-CoA and aspartate by the membrane-bound enzymeL-aspartateN-acetyltransferase, an enzyme selec-tively found in the brain (Truckenmiller et al 1985). N-Acetylaspartate is considered a putative marker of the number or volume of neurons (Arnold et al 1990). Addi-tionally, decreases in NAA have been shown to be
reversible (De Stefano et al 1995), and therefore the levels of NAA detected by in vivo1H MRS depend not only on
factors that change the neuronal composition of the tissue sampled, but also on factors affecting the general viability of neurons.
The observed1H PCr1Cr resonance is not a preferred
measure to assess the high-energy phosphate metabolism, since theN-methyl resonance of PCr and Cr are indistin-guishable and both PCr and Cr are reactants in the creatine kinase high-energy phosphate reaction. The TMA reso-nance observed in a 1H brain spectrum is primarily comprised of freely mobile metabolites, including glycer-olphosphocholine (GPC), phosphorylcholine (PC), and choline; however, the choline concentration is below the limit of detection, being approximately 1/50th of the combined observed in vivo PC and GPC concentration (Miller 1991).
Glutamate is the most abundant amino acid in the brain and plays a major role as an excitatory neurotransmitter in the cerebral cortex (Erecinska and Silver 1990), which is rich in glutamatergic neurons (Shepherd 1994). Following the release of glutamate from the presynaptic terminal to the synaptic cleft, excess glutamate is taken up by sur-rounding glia and is subsequently converted predomi-nantly to glutamine by glutamate synthase. Glutamine is then released, taken up by the presynaptic neuron, and converted into glutamate by mitochondrial glutaminase. The synthesis of glutamine is primarily derived from this glutamate– glutamine cycling, which increases with brain activity and is directly coupled with glucose utilization and lactate production in glia (Magistretti and Pellerin 1999; Rothman et al 1999). The above and the fact that the in vivo concentration of glutamate is greater than glu-tamine (Pouwels and Frahm 1998) suggest that part of the glutamate observed using in vivo1H MRS is not directly
associated with the glutamate– glutamine cycle and may be part of the metabolic glutamate pool (Erecinska and Silver 1990; van den Berg and Garfinkel 1971). Thus, in the context of in vivo1H MRS, glutamine may prove to be
more sensitive than glutamate as an indicator of glutama-tergic neurotransmission (Bartha et al 1997; Stanley et al 1996).
31P Metabolites
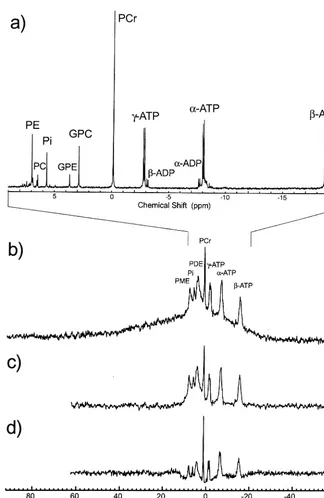
In vivo 31P MRS provides direct assessment of brain membrane phospholipid and high-energy metabolism by quantifying the 31P resonances of phosphomonoesters
phospho-lipids (Dawson 1985; Pettegrew et al 1987). Likewise, GPC and glycerolphosphoethanolamine (GPE), which are freely mobile breakdown products of membrane phospho-lipids, predominantly constitute the PDE resonance (Daw-son 1985; Pettegrew et al 1987). Underlying these two resonances are less mobile molecules with PME and PDE moieties (Figure 2), such as phosphorylated proteins, vesicles, micelles, and the phospholipid bilayer of cell membranes (Burnell et al 1980; de Kruijff et al 1980;
Kilby et al 1991; McNamara et al 1994; Pettegrew et al 1994).
Measurements of the freely mobile PME and PDE metabolites are sensitive to the anabolic and catabolic activity of membrane phospholipids that occur during neurodevelopment. Early in postnatal brain development, levels of membrane phospholipid precursors (PE and, to a lesser degree, PC) are high and those of breakdown products GPE and GPC are low; this is followed by
Figure 1. Single-voxel in vivo1H spectra
of the left prefrontal region (8 cm3)
ac-quired with the stimulated acquisition mode (STEAM) sequence, and with dif-ferent echo times (TEs) and field strengths:(a)TE5135 msec at 1.5 T,(b) TE520 msec at 1.5 T, and(c)TE520 msec at 4.0 T. The metabolite assignment in bapproximates the position of their multiplets. PCr, phosphocreatine; Cr, cre-atine; TMA, trimethylamine; NAA, N -acetylaspartate; NAAG,N -acetylaspartyl-glutamate; Glc, glucose; Glu, -acetylaspartyl-glutamate; Gln, glutamine; myo-Ins, myo-inositol;
dramatic decreases in precursor levels and increases in breakdown products that then plateau, as the brain reaches maturation (Bluml et al 1999; Buchli et al 1994c; Burri et al 1988; Hanaoka et al 1998; Pettegrew et al 1990, 1997). The interpretation of the in vivo PME and PDE measure-ments depends on the ability to quantify the freely mobile metabolites with minimal contamination of the broader, underlying resonances, which will be discussed later.
The31P resonances of PCr, Pi, NDP, and NTP provide information about high-energy phosphate metabolism (Figure 2). Adenosine diphosphate (ADP) and adenosine triphosphate (ATP) predominantly constitute the NDP and NTP resonances. Since theb- and a-ADP reside on the shoulders of theg- anda-ATP, respectively (Figure 2a), theb-ATP becomes the simplest and the preferred reso-nance in assessing ATP. Adenosine triphosphate serves as the high-energy reservoir in the metabolism of carbohy-drates, lipids, and proteins, via the Krebs’ cycle. High-energy PCr, synthesized by creatine kinase, serves as an energy buffer and as an energy shuttle from subcellular sites of energy production to sites of energy consumption, which in both cases help brain ATP levels to remain constant (Bessman and Geiger 1981; Wallimann et al 1992). Under the condition of increased energy utilization and/or depletion of PCr production, the PCr level de-creases and Pi inde-creases.
Phosphomonoester and PDE levels are greater and PCr levels are lower in white matter than in gray matter
(Buchli et al 1994a; Mason et al 1998). In white matter, which has a greater content of sphingomyelin, PC and PE act as both anabolic and catabolic products. It is unclear if the above increase in PMEs and PDEs is due to the freely mobile metabolites or to the less mobile metabolites; however, under ex vivo conditions the phospholipid bi-layer signal is significantly greater in white matter (Buchli et al 1994a; Burt et al 1989). This may be due to the vastly different cellular architecture: long axonal fibers sur-rounded by myelin sheaths dominate the white matter, whereas the gray matter is composed of the cell bodies and of neuronal and glia processes.
Understanding the MR Signal
In any cross-sectional study, it is the “effect size” that determines if a finding is significant between groups. A way to increase the effect size is to reduce the variance of the measured variable, assuming that the variance is not dominated by intersubject variability. To a MR spectros-copist, this is the most critical factor, since variance is directly related to the S/N. When one designs an MRS protocol, there are many factors that control the S/N. For example, the sensitivity of the1H nuclei is 15 times that of the31P nuclei. Thus, the tendency is to reduce the size of the localized volume or voxel in the 1H mode (e.g., approximately 0.1– 8.0 cm3). The smaller voxel potentially increases the specificity by minimizing the partial volume
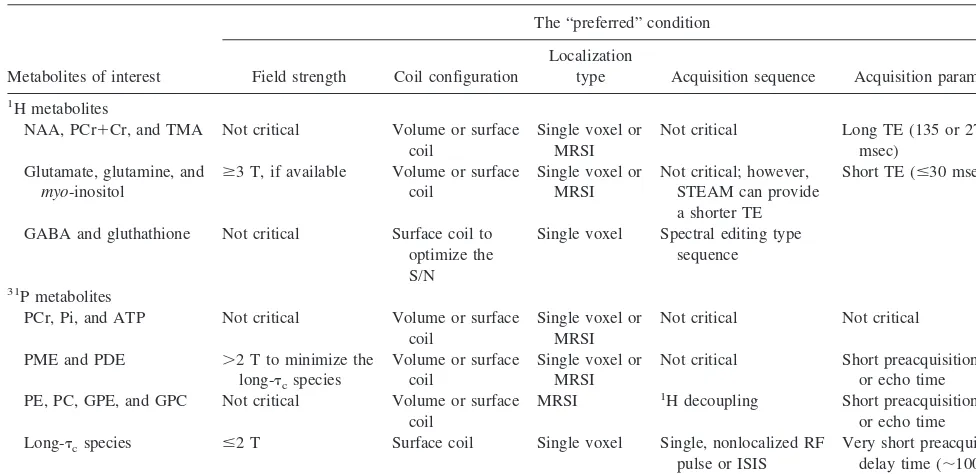
Table 1. The “Preferred” Experimental Condition for the Metabolites of Interest
Metabolites of interest
The “preferred” condition
Field strength Coil configuration
Localization
type Acquisition sequence Acquisition parameters
1H metabolites
NAA, PCr1Cr, and TMA Not critical Volume or surface coil
Single voxel or MRSI
Not critical Long TE (135 or 272
msec) Glutamate, glutamine, and
myo-inositol
$3 T, if available Volume or surface coil
GABA and gluthathione Not critical Surface coil to optimize the S/N
Single voxel Spectral editing type sequence
31P metabolites
PCr, Pi, and ATP Not critical Volume or surface
coil
Single voxel or MRSI
Not critical Not critical
PME and PDE .2 T to minimize the
long-tcspecies
Volume or surface coil
Single voxel or MRSI
Not critical Short preacquisition delay or echo time
PE, PC, GPE, and GPC Not critical Volume or surface coil
MRSI 1H decoupling Short preacquisition delay
or echo time
Long-tcspecies #2 T Surface coil Single voxel Single, nonlocalized RF
pulse or ISIS
Very short preacquisition delay time (;100msec or less)
1
H, proton; NAA,N-acetylaspartate; PCr, phosphocreatine; Cr, creatine; TMA, trimetylamine; MRSI, magnetic resonance spectroscopic imaging; TE, echo time; STEAM, stimulated acquisition mode; GABA,g-aminobutyric acid; S/N, signal-to-noise ratio;31
P, phosphorus; Pi, inorganic orthophosphate; ATP, adenosine triphosphate; PME, phosphomonoester; PDE, phosphodiester;tc, correlation time; PE, phosphorylethanolamine; PC, phosphorylcholine; GPE, glycerolphosphoethanolamine; GPC,
of gray and white matter and cerebrospinal fluid (CSF) at the expense of reducing the S/N. Therefore, in general the localization of 1H MRS enables examination of small anatomic structures, whereas much larger voxels and longer scan times are required for adequate S/N in 31P MRS.
The observed human brain concentration of NAA (which constitutes nine protons) is approximately similar to that of the glutamate concentration (which constitutes eight protons); however, the reliability/sensitivity in the quantification of these two in vivo1H metabolites differs
greatly (de Graaf and Bovee 1990; Provencher 1993; Stanley et al 1995a), due mainly to the differences in the number of protons that resonate at a particular chemical shift. The CH3 of NAA (three protons) gives rise to an
uncoupled singlet with a relatively high S/N at 2.01 ppm. In contrast, the a- and b-CH2groups of glutamate (two
protons each) are strongly coupled at low fields (e.g., 1.5 T), leading to complex multiplets with poorer S/N and, hence, less reliable measurements. The quantification of glutamate is further impaired by other metabolites with a similar chemical structure and, hence, similar chemical
Figure 2. (a) Phosphorus (31P)
spec-trum of a perchloric acid extract of a freeze-clamped rat brain acquired at 11.7 T. In vivo31P spectra of the human
brain acquired with a single radio fre-quency pulse and different preacquisi-tion delay times—(b)150msec,(c)500
shifts and multiplets that overlap each other, such as glutamine and GABA (Figure 1).
In addition to a change in metabolite concentration, signal amplitude in the spectral peak area also can change due to alteration in the spin–lattice (T1) relaxation time
constant of the metabolite. The T1relaxation determines
the time required to fully recover the MR signal following the radio frequency (RF) pulses of a localization sequence (Gadian 1995). Typically, T1 relaxation times of 1H
metabolites NAA, PCr1Cr, and TMAs at 1.5 T are approximately between 1.0 and 1.5 sec (Kreis et al 1993), which differ depending on brain region, tissue type, and field strength. To fully recover the MR signal, the pulse repetition time (TR) must be at least 5 3 T1. If this
condition is not met, then the observed MR signal will have a signal amplitude less than the fully relaxed MR signal; this is referred to aspartial saturation. The T1of
metabolites may differ between subject groups; therefore, significant differences in signal amplitudes could be due to a partial saturation effect and not to a change in metabolite concentration. For example, if the T1changes from 1 sec
to 1.5 sec, the signal amplitude decreases by 19%, using a TR of 1.5 sec. To avoid this issue of possible T1saturation, the protocol should have a T1that is at least five times the
longest T1of the measured metabolites.
The last concept to introduce deals with the motional and/or rotational mobility of the observed metabolites, which is characterized by a correlation time, tc, and is
inversely proportional to the spin–spin relaxation time constant (T2). The T2is an exponential time constant that characterizes the decay of the MR signal or free-induction decay (FID), including the decay of a spin– echo signal (Gadian 1995). This implies that freely mobile molecules with a shorttcwill have a longer observed FID signal (or
longer T2), whereas less mobile and/or larger molecules
with a longertcwill have a much shorter observed FID
signal (or shorter T2). If the preacquisition delay or TE of the acquisition scheme is short, the resulting FID or spectral information not only includes narrow line shapes, but also relatively broader line shapes underlying the narrower peaks (i.e., longtcspecies with short short T2s).
In the case of a short TE 1H acquisition, these broader
peaks are distributed throughout the quantified spectral region and are due to macromolecules (Behar et al 1994; Kauppinen et al 1992). This should be taken into account when quantifying short TE 1H MRS data (Bartha et al 1999a; Pfeuffer et al 1999; Provencher 1993; Stanley et al 1995a). In31P MRS with a short preacquisition delay time, the PME and PDE line shapes may include not only the freely mobile metabolites, but also less mobile molecules with PME and PDE moieties (i.e., vesicles, micelles, membrane proteins, and membrane phospholipids), as noted earlier (Figure 2). As a result, having the
contribu-tion of both short and longertcmetabolites as part of the
quantified PME and PDE levels complicates the interpre-tation of any PME or PDE changes in a study.
Acquisition Protocol
1H MRS
In designing an MRS protocol, it is important to define the metabolite(s) of interest to best address the hypothesis (Table 1). If NAA is central to the hypothesis, then the critical parameter is echo time. Use of a longer TE (e.g., 272 msec) results in well-separated and easily quantifiable singlets, including NAA, PCr1Cr, and TMAs (Figure 1a). In general, the larger the voxel, the more difficult it is to optimize the homogeneity of B0over that region.
Conse-quently, since the spectral resolution is not as critical to resolve the singlets for a long TE sequence, NAA, PCr1Cr, and TMAs are frequently measured using an MRSI-type acquisition scheme as opposed to a long TE single-voxel technique. In general, MRSI techniques tend to have greater spatial resolution (approximately less than 1 cm3, compared with several cm3 for a single-voxel technique). The advantage of greater spatial resolution reduces the partial volume of unwanted tissue.
If glutamate, glutamine, and/or myo-inositol are the metabolites of interest, a short TE should be used, as noted earlier (Table 1). In this case, maximizing the B0
homo-geneity over the voxel (i.e., by “shimming”) is crucial to best resolve these overlapping peaks (Gruetter 1993; Hu et al 1995; Shen et al 1997). Therefore, a short TE sequence is frequently done with a single-voxel study, with a few exceptions (Mason et al 1994; Pioro et al 1999; Posse et al 1993; Soher et al 1998). This is the trade-off between the long and short TE acquisition schemes. Using a shorter TE provides a longer list of measurable metabolites, at the expense of acquiring information from a single voxel per measurement. Importantly, the T2 weighting on the me-tabolite resonance amplitudes is greater for the longer TE acquisition, and significant differences in metabolite levels or ratios between subject groups may reflect T2 differ-ences and not true concentration differdiffer-ences. In vivo short TE1H spectroscopy at a higher B0field (Mason et al 1994;
Posse et al 1995) has the advantage of weakening the apparent coupling by the increased chemical shift disper-sion, which in turn reduces the degree of overlap between the multiplets (Figure 1) and improves the accuracy of quantifying the data (Bartha et al 1999b).
two-dimensional J-coupling–resolved spectroscopy can be used to isolate a particular resonance of GABA (Keltner et al 1997; Rothman et al 1993; Wilman and Allen 1995; Table 1). A similar approach has been used to quantify other, less prominent metabolites including glutathione (Trabesinger et al 1999), which is of interest in schizo-phrenia research (Do et al 1999).
Briefly, other issues to consider in designing an acqui-sition protocol include 1) testing the localization and reproducibility of the sequence with known solution phan-toms, including measuring the effective size of the local-ized voxels (Bovee et al 1995; Leach et al 1995; Podo et al 1998); 2) optimizing the correct order of the slice-selective RF pulses in the stimulated acquisition mode (STEAM) or point-resolved spectroscopy (PRESS) se-quence to minimize the eddy current effects and suscep-tibility effects that distort the homogeneity of the B0 field due to strong field gradients generated at the interface between air and water (e.g., in the sinuses and mouth; Ernst and Chang 1996; Seeger et al 1999); 3) incorporat-ing outer volume suppression pulses to minimize any susceptibility artifacts (Seeger et al 1999); 4) obtaining absolute metabolite concentration levels (discussed in the next section); and 5) incorporating a three-dimensional imaging sequence or a series of fully relaxed unsuppressed water acquisitions at different TEs to obtain gray and white matter and CSF composition in each voxel (Doyle et al 1995; Hetherington et al 1996; Kreis et al 1993; Lim and Spielman 1997; Lundbom et al 1999).
31P MRS
High-energy phosphate metabolism is best assessed using
31
P spectroscopy (Table 1). Unlike in the1H mode, where the Cr and PCr resonances are indistinguishable, an in vivo
31P brain spectrum is composed of PCr, Pi, and ATP,
which are reliably quantifiable. Choices for localization sequences include the image-selected in vivo spectroscopy applied as a single- or multiple-voxel technique (Burger et al 1992; Ordidge et al 1986) and spin– echo (Lim et al 1994; Merboldt et al 1990) and CSI sequences (Brown 1992). The surface coil provides the most sensitivity, followed by the Helmholtz coil and the volume coil.
If membrane phospholipid metabolism is of interest in the hypothesis, the preferred metabolites are the PMEs and PDEs (Table 1). The TMA resonance in1H MRS is not a preferred candidate to assess the membrane phospholipid metabolism because this resonance is composed of both the precursor and breakdown products; however, the difficulty with31P MRS is the quantification of the PME and PDE spectral region. Depending on the preacquisition delay or TE used to acquire the data, an in vivo31P brain
spectrum may contain not only the freely mobile
metab-olites, but also less mobile molecules with PME and PDE moieties, as discussed earlier. This also includes the membrane phospholipid bilayers if the preacquisition delay time is very short (Figure 2). The membrane phospholipid bilayer contribution can be minimized by applying an off-resonance saturation prepulse (McNamara et al 1994) or by using a high B0field strength of..2 T
(Bates et al 1989). Postprocessing methods, discussed later, also can be used to either eliminate or quantify the relatively broader underlying peak.
Major advances in hardware/software over the years have enabled the use of 1H decoupling with in vivo 31P
MRS. This method removes spectral broadening due to the
1H–31P interaction, and as a result, the individual PC and
PE and GPC and GPE resonances are resolvable (Luyten et al 1989; Murphy-Boesch et al 1993). Additionally, S/N can be further enhanced by using the nuclear Overhauser effect (NOE; Li et al 1996). If the decoupled nuclei have a greater sensitivity than the observed nuclei (e.g.,1H. 31P) and these nuclei are coupled through space (via
dipolar coupling), then their increased signal arises from the transfer of signal from the decoupled nuclei to the observed nuclei. For the 1H decoupling 31P observed
condition, the maximum theoretical enhancement is 24%, which assumes that the 1H–31P interaction is purely
dipolar and there is no T1saturation effect occuring on the
transferred1H signal. The ability to sustain a constant1H
decoupling across the sample without exceeding the RF absorption limit for the body and to ensure constant magnitude of NOE enhancement between subjects is critical for this technique; this may prove to be problem-atic if not carefully tested and monitored. The importance of quantifying the broader underlying resonance is dem-onstrated in a1H decoupled31P MRS study by
observa-tions of increased PDE levels in chronic medicated schizo-phrenia subjects being due to the broad underlying peak, and not to the freely mobile breakdown products of membrane phospholipids (Potwarka et al 1999).
Postprocessing and Quantification
In recent years the quantification procedures (de Beer and van Ormondt 1992; Provencher 1993) have dramatically improved to produce accurate and reproducible results (Bartha et al 1999a; Brooks et al 1999a, 1999b; Keevil et al 1998; Stanley et al 1995a). Advances in quantification include:
1992; Vanhamme et al 1997]), the domain in which the raw data is collected, provides greater flexibility in choosing the correct model function (e.g., Lorent-zian, Gaussian or Voigt), and the phase and preac-quisition delay time parameters are optimized in the fitting routine. The latter eliminates manual phasing by an operator and any subjective baseline correc-tion in the frequency domain due to the preacquisi-tion delay time. Addipreacquisi-tionally, the model funcpreacquisi-tions used in the frequency domain are not the exact time domain counterpart functions (de Beer and van Ormondt 1992). Methods that integrate spectral peaks by placing two boundaries on either side of the peak are unreliable, since the integrated area does not account for the degree of overlap, espe-cially when applied to quantifying the PCr1Cr and TMAs, in which these resonances could overlap. 2. Minimal manipulation of the raw data prior to
quantification in order to best preserve the signal amplitudes.Resolution enhancement methods such as the Lorentzian-to-Gaussian transformation (Fer-rige and Lindon 1978) should be avoided, as they do not preserve the true metabolite amplitudes. The degree of enhancement depends on the spectral line width, which may vary from subject to subject and, hence, vary the enhancement amount between sub-jects. Quantifying magnitude spectra, which are created from the real and imaginary parts of the signal, is also problematic. Negative signals become positive, which artificially increases the amplitudes of the measured metabolites, and as the S/N de-creases the noise tends to dominate the measured amplitudes (e.g., in regions near or in ventricles). Additionally, choosing Lorentzian or Gaussian as the model function would not accurately represent the line shape of the spectral peaks in a magnitude spectrum. The convolution difference method (Ack-erman et al 1980) is very effective in removing relatively broad underlying peaks, but this method also should be avoided because the appropriate line-broadening factor is subjective and the amount of signal subtracted also is dependent on the spectral line width, which may vary between subjects. Al-ternatively, one can quantify the data in the time domain by omitting the first several data points of the FID (i.e., the signal from the rapidly decaying component attributing to the broader underlying peaks; Stanley et al 1997). As a result, the fitting will have no influence from the broad underlying signal, which can also be quantified with this method.
3. Incorporating a priori knowledge to improve the specificity of resolving overlapping resonances. In
quantifying the ATP resonances in a31P spectrum,
typically the model includes two doublets and one triplet. Likewise, a priori knowledge of multiplets for each metabolite should be incorporated in the quantification approach, especially for short-TE1H
data, to accurately model the data (Bartha et al 1999a; de Graaf and Bovee 1990; Provencher 1993; Stanley et al 1995a). Recent short-TE in vivo 1H MRS studies also have shown that incorporating spectral resonances of long-tcspecies from
macro-molecules can significantly improve the accuracy and precision of the quantified in vivo metabolites (Bartha et al 1999a; Behar et al 1994; Stanley et al 1995a).
4. Obtaining absolute metabolite concentration levels instead of expressing results as metabolite ratios.It is always assumed that the denominator of a metab-olite ratio remains constant when values are com-pared between subject groups. Observations of changes in the metabolite level of the denominator such as PCr1Cr (Connelly et al 1994; Gadian et al 1994) stress the importance of absolute quantifica-tion. Several studies have compared different abso-lute quantification methods (Barantin and Akoka 1997; Buchli et al 1994b; Danielsen et al 1995; Keevil et al 1998), including the unsuppressed water signal with no T1 saturation effect as an internal
standard; collecting the signal of an external refer-ence standard; using the flip angle of a modified water suppression RF pulse; a phantom replacement method; and using an externally generated, cali-brated, modulated RF signal that the transmit coil is able to receive. Using the unsuppressed water signal as an internal reference is a quick and easy method to apply; however, this method assumes that all of the tissue water signal is MR visible and that the apparent T2 (and T1, if the unsuppressed water signal is not fully relaxed) of the water signal is similar between subject groups. This may not be the case (e.g., in schizophrenia; Williamson et al 1992). Overall, it is unclear which method provides the most accuracy and reliability.
Reporting Parameters Describing the MRS
Protocol
As noted throughout this text, in vivo spectroscopy can be applied in numerous ways for various reasons. Conse-quently, inconsistencies in schizophrenia research using in vivo MRS may involve such factors as 1) brain region; 2) voxel size and the amount of partial volume of unwanted tissue; 3) amount of T2attenuation, which is determined
saturation effects; 5) manipulation of the raw data via apodization, resolution enhancement, baseline correction, and the removal of unwanted water and/or lipid signal; and 6) assumptions that are made in the chosen method to express the quantified metabolite levels (e.g., ratios and T1, T2, and CSF correction factors). Therefore, to better
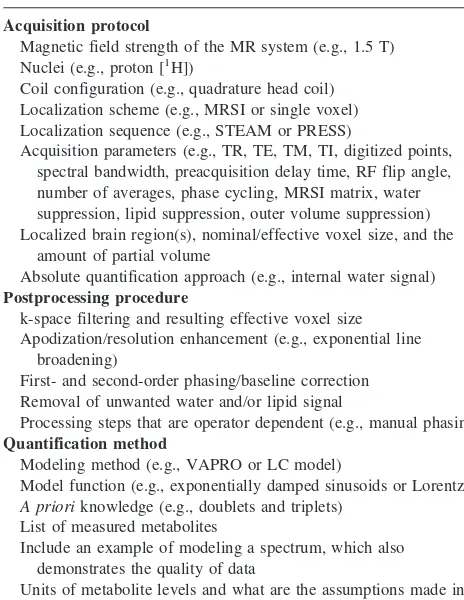
understand the inconsistency between studies documenta-tion of key acquisidocumenta-tion, postprocessing, and quantificadocumenta-tion parameters/issues and assumptions in the determination of the metabolite levels is critical. Summarized in Table 2 are standard parameters and issues that should be included as a minimum in MRS-related publications in schizophrenia.
Conclusions
Because of the many different aspects of in vivo spectros-copy, the application of this technique in the research environment can be demanding, and the variability in findings thus far in MRS research in schizophrenia may be related in part to the use of diverse approaches (Keshavan et al 2000). Consequently, a considerable amount of knowledge is required to design and develope the
appro-priate in vivo spectroscopy protocol to address hypotheses of interest. In this review we addressed these issues, including understanding 1) the biochemistry and the phys-iologic significance of metabolites; 2) the influence of acquisition parameters combined with T1and T2effects on
the MRS signal; 3) the composition of spectral peaks and the degree of overlapping peaks, including the broader underlying peaks; 4) the factors influencing the S/N; 5) the various types of localization schemes, and 6) the objec-tives of quantification to produce accurate and reproduc-ible results. This ability to fully exploit the potentials of in vivo spectroscopy should lead to a protocol that is best optimized for hypothesis-driven schizophrenia research.
References
Ackerman JJ, Grove TH, Wong GG, Gadian DG, Radda GK (1980): Mapping of metabolites in whole animals by 31P
NMR using surface coils.Nature283:167–170.
Arnold DL, Matthews PM, Francis G, Antel J (1990): Proton magnetic resonance spectroscopy of human brainin vivoin the evaluation of multiple sclerosis: Assessment of the load of disease.Magn Reson Med14:154 –159.
Barantin L, Akoka S (1997): An overview of absolute quantifi-cation methods for in vivo MRS. J Magn Reson Analysis
3:21–27.
Bartha R, Drost DJ, Williamson PC (1999a): Factors affecting the quantification of short echoin-vivo1H MR spectra: Prior
knowledge, peak elimination, and filtering. NMR Biomed
12:205–216.
Bartha R, Drost DJ, Williamson PC, Menon RS (1999b): Quantification precision of in-vivo short echo 1H STEAM
spectra at 1.5 tesla and 4.0 tesla. In: Proceedings of the International Society for Magnetic Resonance in Medicine.
Berkeley, CA: ISMRM, 1572.
Bartha R, Williamson PC, Drost DJ, Malla A, Carr TJ, Cortese L, et al (1997): Measurement of glutamate and glutamine in the medial prefrontal cortex of never-treated schizophrenic patients and healthy controls by proton magnetic resonance spectroscopy.Arch Gen Psychiatry54:959 –965.
Bates TE, Williams SR, Gadian DG (1989): Phosphodiesters in the liver: The effect of field strength on the31P signal.
Magn Reson Med12:145–150.
Behar KL, Rothman DL, Spencer DD, Petroff OA (1994): Analysis of macromolecule resonances in1H NMR spectra of
human brain.Magn Reson Med32:294 –302.
Bessman SP, Geiger PJ (1981): Transport of energy in muscle: The phosphorylcreatine shuttle.Science211:448 – 452. Bluml S, Seymour KJ, Ross BD (1999): Developmental changes
in choline- and ethanolamine-containing compounds mea-sured with proton-decoupled 31P MRS in in vivo human
brain.Magn Reson Med42:643– 654.
Bovee WM, Keevil SF, Leach MO, Podo F (1995): Quality assessment in in vivo NMR spectroscopy: II. A protocol for quality assessment. EEC Concerted Research Project.Magn Reson Imaging13:123–129.
Brooks JC, Roberts N, Kemp GJ, Martin PA, Whitehouse GH Table 2. Standard Parameters and Issues That Should Be
Included as a Minimum in an MRS-related Publication
Acquisition protocol
Magnetic field strength of the MR system (e.g., 1.5 T) Nuclei (e.g., proton [1H])
Coil configuration (e.g., quadrature head coil) Localization scheme (e.g., MRSI or single voxel) Localization sequence (e.g., STEAM or PRESS)
Acquisition parameters (e.g., TR, TE, TM, TI, digitized points, spectral bandwidth, preacquisition delay time, RF flip angle, number of averages, phase cycling, MRSI matrix, water suppression, lipid suppression, outer volume suppression) Localized brain region(s), nominal/effective voxel size, and the
amount of partial volume
Absolute quantification approach (e.g., internal water signal)
Postprocessing procedure
k-space filtering and resulting effective voxel size Apodization/resolution enhancement (e.g., exponential line
broadening)
First- and second-order phasing/baseline correction Removal of unwanted water and/or lipid signal
Processing steps that are operator dependent (e.g., manual phasing)
Quantification method
Modeling method (e.g., VAPRO or LC model)
Model function (e.g., exponentially damped sinusoids or Lorentzian)
A prioriknowledge (e.g., doublets and triplets) List of measured metabolites
Include an example of modeling a spectrum, which also demonstrates the quality of data
Units of metabolite levels and what are the assumptions made in the calculation (i.e., T1, T2, and CSF corrections)
(1999a): Magnetic resonance imaging-based compartmenta-tion and its applicacompartmenta-tion to measuring metabolite concentra-tions in the frontal lobe.Magn Reson Med41:883– 888. Brooks WM, Friedman SD, Stidley CA (1999b): Reproducibility
of1H-MRS
in vivo. Magn Reson Med41:193–197. Brown TR (1992): Practical applications of chemical shift
imaging.NMR Biomed5:238 –243.
Buchli R, Duc CO, Martin E, Boesiger P (1994a): Assessment of absolute metabolite concentrations in human tissue by 31P MRSin vivo. Part I: Cerebrum, cerebellum, cerebral gray and white matter.Magn Reson Med32:447– 452.
Buchli R, Martin E, Boesiger P (1994b): Comparison of calibra-tion strategies for the in vivo determination of absolute metabolite concentrations in the human brain by31P MRS. NMR Biomed7:225–230.
Buchli R, Martin E, Boesiger P, Rumpel H (1994c): Develop-mental changes of phosphorus metabolite concentrations in the human brain: A 31P magnetic resonance spectroscopy
studyin vivo. Pediatr Res35:431– 435.
Burger C, Buchli R, McKinnon G, Meier D, Boesiger P (1992): The impact of the ISIS experiment order on spatial contam-ination.Magn Reson Med26:218 –230.
Burnell EE, Cullis PR, de Kruijff B (1980): Effects of tumbling and lateral diffusion on phosphatidylcholine model mem-brane 31P-NMR lineshapes. Biochim Biophys Acta603:63–
69.
Burri R, Lazeyras F, Aue WP, Straehl P, Bigler P, Althaus U, Herschkowitz N (1988): Correlation between31P NMR
phos-phomonoester and biochemically determined phosphoryleth-anolamine and phosphatidylethphosphoryleth-anolamine during develop-ment of the rat brain.Dev Neurosci10:213–221.
Burt CT, Cheng HM, Jungalwalla F (1989):31P NMR studies of
excised gray and white calf brain.Comp Biochem Physiol B Biochem Mol Biol94:679 – 685.
Connelly A, Jackson GD, Duncan JS, King MD, Gadian DG (1994): Magnetic resonance spectroscopy in temporal lobe epilepsy.Neurology44:1411–1417.
Danielsen ER, Michaelis T, Ross BD (1995): Three methods of calibration in quantitative proton MR spectroscopy.J Magn Reson B106:287–291.
Dawson RMC (1985): Enzymatic pathways of phospholipid metabolism in the nervous system. In: Eichberg J, editor.
Phospholipids in Nervous Tissues.New York: Wiley, 45–78. de Beer R, van Ormondt D (1992): Analysis of NMR data using time domain fitting procedures. In: Diehl P, Fluck E, Gunther H, Kosfeld R, Seelig J, editors.NMR: Basic Principles and Progress,Vol 123. Berlin: Springer-Verlag, 199 –281. de Graaf AA, Bovee WM (1990): Improved quantification ofin
vivo 1H NMR spectra by optimization of signal acquisition and processing and by incorporation of prior knowledge into the spectral fitting.Magn Reson Med15:305–319.
de Kruijff B, Rietveld A, Cullis PR (1980):31P-NMR studies on
membrane phospholipids in microsomes, rat liver slices and intact perfused rat liver.Biochim Biophys Acta600:343–357. De Stefano N, Matthews PM, Arnold DL (1995): Reversible decreases in N-acetylaspartate after acute brain injury.Magn Reson Med34:721–727.
Do KQ, Trabesinger AH, Kirsten-Kruger M, Lauer CJ, Dydak U, Hell D, et al (1999): A unified hypothesis of schizophrenia based on glutathione deficit.Biol Psychiatry45(8S):42.
Doyle TJ, Bedell BJ, Narayana PA (1995): Relative concentra-tions of proton MR visible neurochemicals in gray and white matter in human brain.Magn Reson Med33:755–759. Erecinska M, Silver IA (1990): Metabolism and role of glutamate
in mammalian brain.Prog Neurobiol35:245–296.
Ernst T, Chang L (1996): Elimination of artifacts in short echo time H MR spectroscopy of the frontal lobe.Magn Reson Med36:462– 468.
Ernst T, Hennig J (1991): Coupling effects in volume selective
1H spectroscopy of major brain metabolites.
Magn Reson Med21:82–96.
Farrar TC, Becker ED (1971): Pulse and Fourier Transform NMR: Introduction to Theory and Methods. New York: Academic Press.
Ferrige AG, Lindon JC (1978): Resolution enhancement in FT NMR through the use of a double exponential function. J Magn Reson31:337–340.
Frahm J, Michaelis T, Merboldt KD, Hanicke W, Gyngell ML, Bruhn H (1991): On the N-acetyl methyl resonance in localized 1H NMR spectra of human brain in vivo. NMR Biomed4:201–204.
Fukushima E, Roeder SBW (1981):Experimental Pulse NMR: A Nuts and Bolts Approach.Reading, MA: Addison-Wesley. Gadian DG (1995):NMR and Its Applications to Living Systems,
2nd ed. Oxford, UK: Oxford University Press.
Gadian DG, Connelly A, Duncan JS, Cross JH, Kirkham FJ, Johnson CL, et al (1994): 1H magnetic resonance
spectros-copy in the investigation of intractable epilepsy.Acta Neurol Scand Suppl152:116 –121.
Gruetter R (1993): Automatic, localizedin vivoadjustment of all first- and second-order shim coils.Magn Reson Med29:804 – 811.
Hanaoka S, Takashima S, Morooka K (1998): Study of the maturation of the child’s brain using 31P-MRS. Pediatr Neurol18:305–310.
Hetherington HP, Pan JW, Mason GF, Adams D, Vaughn MJ, Twieg DB, Pohost GM (1996): Quantitative1H spectroscopic
imaging of human brain at 4.1 T using image segmentation.
Magn Reson Med36:21–29.
Hu J, Javaid T, Arias-Mendoza F, Liu Z, McNamara R, Brown TR (1995): A fast, reliable, automatic shimming procedure using1H chemical-shift-imaging spectroscopy.J Magn Reson B108:213–219.
Kauppinen RA, Kokko H, Williams SR (1992): Detection of mobile proteins by proton nuclear magnetic resonance spec-troscopy in the guinea pig brain ex vivo and their partial purification.J Neurochem58:967–974.
Keevil SF, Barbiroli B, Brooks JC, Cady EB, Canese R, Carlier P, et al (1998): Absolute metabolite quantification byin vivo
NMR spectroscopy: II. A multicentre trial of protocols forin vivo localised proton studies of human brain.Magn Reson Imaging16:1093–1106.
Keltner JR, Wald LL, Frederick BD, Renshaw PF (1997):In vivo
detection of GABA in human brain using a localized double-quantum filter technique.Magn Reson Med37:366 –371. Keshavan MS, Stanley JA, Pettegrew JW (2000): Magnetic
brain phospholipid structures in vivo.Biochim Biophys Acta
1085:257–264.
Kreis R, Ernst T, Ross BD (1993): Absolute quantitation of water and metabolites in the human brain. II. Metabolite concen-trations.J Magn Reson B102:9 –19.
Leach MO, Collins DJ, Keevil S, Rowland I, Smith MA, Henriksen O, et al (1995): Quality assessment inin vivoNMR spectroscopy: III. Clinical test objects: Design, construction, and solutions.Magn Reson Imaging13:131–7.
Li CW, Negendank WG, Murphy-Boesch J, Padavic-Shaller K, Brown TR (1996): Molar quantitation of hepatic metabolites
in vivoin proton-decoupled, nuclear Overhauser effect en-hanced 31P NMR spectra localized by three-dimensional
chemical shift imaging.NMR Biomed9:141–155.
Lim KO, Pauly J, Webb P, Hurd R, Macovski A (1994): Short TE phosphorus spectroscopy using a spin-echo pulse.Magn Reson Med32:98 –103.
Lim KO, Spielman DM (1997): Estimating NAA in cortical gray matter with applications for measuring changes due to aging.
Magn Reson Med37:372–377.
Lundbom N, Barnett A, Bonavita S, Patronas N, Rajapakse J, Tedeschi, Di Chiro G (1999): MR image segmentation and tissue metabolite contrast in 1H spectroscopic imaging of
normal and aging brain.Magn Reson Med41:841– 845. Luyten PR, Bruntink G, Sloff FM, Vermeulen JW, van der
Heijden JI, den Hollander JA, Heerschap A (1989): Broad-band proton decoupling in human 31P NMR spectroscopy. NMR Biomed1:177–183.
Magistretti PJ, Pellerin L (1999): Cellular mechanisms of brain energy metabolism and their relevance to functional brain imaging.Philos Trans R Soc Lond B Biol Sci354:1155–1163. Mason GF, Chu WJ, Vaughan JT, Ponder SL, Twieg DB, Adams D, Hetherington HP (1998): Evaluation of 31P metabolite
differences in human cerebral gray and white matter.Magn Reson Med39:346 –353.
Mason GF, Pan JW, Ponder SL, Twieg DB, Pohost GM, Hetherington HP (1994): Detection of brain glutamate and glutamine in spectroscopic images at 4.1 T.Magn Reson Med
32:142–145.
McNamara R, Arias-Mendoza F, Brown TR (1994): Investiga-tion of broad resonances in 31P NMR spectra of the human
brainin vivo. NMR Biomed7:237–242.
Merboldt KD, Chien D, Hanicke W, Gyngell ML, Bruhn H, Frahm J (1990): Localized 31P NMR spectroscopy of the
adult human brainin vivo using stimulated-echo (STEAM) sequences.J Magn Reson89:343–361.
Miller BL (1991): A review of chemical issues in 1H NMR
spectroscopy: N-Acetyl-L-aspartate, creatine and choline.
NMR Biomed4:47–52.
Murphy-Boesch J, Stoyanova R, Srinivasan R, Willard T, Vign-eron D, Nelson S, et al (1993): Proton-decoupled31P
chem-ical shift imaging of the human brain in normal volunteers.
NMR Biomed6:173–180.
Ordidge RJ, Connelly A, Lohman JB (1986): Image-selectedin vivo spectroscopy (ISIS). A new technique for spatially selective NMR spectroscopy.J Magn Reson66:283–294. Pettegrew JW, Keshavan MS, Panchalingam K, Strychor S,
Kaplan DB, Tretta MG, Allen M (1991): Alterations in brain high-energy phosphate and membrane phospholipid
metabo-lism in first-episode, drug-naive schizophrenics. A pilot study of the dorsal prefrontal cortex by in vivo phosphorus 31 nuclear magnetic resonance spectroscopy.Arch Gen Psychi-atry48:563–568.
Pettegrew JW, Kopp SJ, Minshew NJ, Glonek T, Feliksik JM, Tow JP, Cohen MM (1987):31P nuclear magnetic resonance
studies of phosphoglyceride metabolism in developing and degenerating brain: Preliminary observations.J Neuropathol Exp Neurol46:419 – 430.
Pettegrew JW, McClure RJ, Keshavan MS, Minshew NJ, Pan-chalingam K, Klunk WE (1997): 31P magnetic resonance
spectroscopy studies of developing brain. In: Keshavan MS, Murray RM, editors.Neurodevelopement & Adult Psychopa-thology.Cambridge, UK: Cambridge University Press, 71– 92.
Pettegrew JW, Panchalingam K, Klunk WE, McClure RJ, Muenz LR (1994): Alterations of cerebral metabolism in probable Alzheimer’s disease: A preliminary study.Neurobiol Aging
15:117–132.
Pettegrew JW, Panchalingam K, Withers G, McKeag D, Strychor S (1990): Changes in brain energy and phospholipid metab-olism during development and aging in the Fischer 344 rat.
J Neuropathol Exp Neurol49:237–249.
Pfeuffer J, Tkac I, Provencher SW, Gruetter R (1999): Toward an
in vivoneurochemical profile: Quantification of 18 metabo-lites in short-echo-time1H NMR spectra of the rat brain.J Magn Reson141:104 –120.
Pioro EP, Majors AW, Mitsumoto H, Nelson DR, Ng TC (1999):
1H-MRS evidence of neurodegeneration and excess
gluta-mate1glutamine in ALS medulla.Neurology53:71–79. Podo F, Henriksen O, Bovee WM, Leach MO, Leibfritz D, de
Certaines JD (1998): Absolute metabolite quantification byin vivoNMR spectroscopy: I. Introduction, objectives and ac-tivities of a concerted action in biomedical research.Magn Reson Imaging16:1085–1092.
Posse S, Cuenod CA, Risinger R, Le Bihan D, Balaban RS (1995): Anomalous transverse relaxation in1H spectroscopy
in human brain at 4 Tesla.Magn Reson Med33:246 –252. Posse S, Schuknecht B, Smith ME, van Zijl PC, Herschkowitz N,
Moonen CT (1993): Short echo time proton MR spectro-scopic imaging.J Comput Assist Tomogr17:1–14.
Potwarka JJ, Drost DJ, Williamson PC, Carr T, Canaran G, Rylett WJ, Neufeld RW (1999): A 1H-decoupled31P
chem-ical shift imaging study of medicated schizophrenic patients and healthy controls.Biol Psychiatry45:687– 693.
Pouwels PJ, Frahm J (1997): Differential distribution of NAA and NAAG in human brain as determined by quantitative localized proton MRS.NMR Biomed10:73–78.
Pouwels PJ, Frahm J (1998): Regional metabolite concentrations in human brain as determined by quantitative localized proton MRS.Magn Reson Med39:53– 60.
Provencher SW (1993): Estimation of metabolite concentrations from localizedin vivoproton NMR spectra.Magn Reson Med
30:672– 679.
Rothman DL, Petroff OA, Behar KL, Mattson RH (1993): Localized 1H NMR measurements of gamma-aminobutyric
acid in human brain in vivo. Proc Natl Acad Sci U S A
90:5662–5666.
RG (1999):In vivonuclear magnetic resonance spectroscopy studies of the relationship between the glutamate-glutamine neurotransmitter cycle and functional neuroenergetics.Philos Trans R Soc Lond B Biol Sci354:1165–1177.
Seeger U, Klose U, Lutz O, Grodd W (1999): Elimination of residual lipid contamination in single volume proton MR spectra of human brain.Magn Reson Imaging17:1219 –1226. Shen J, Rycyna RE, Rothman DL (1997): Improvements on anin vivo automatic shimming method [FASTERMAP]. Magn Reson Med38:834 – 839.
Shepherd GM (1994):Neurobiology,3rd ed. New York: Oxford University Press.
Soher BJ, Young K, Govindaraju V, Maudsley AA (1998): Automated spectral analysis III: Application to in vivo proton MR spectroscopy and spectroscopic imaging. Magn Reson Med40:822– 831.
Stanley JA, Drost DJ, Williamson PC, Thompson RT (1995a): The use ofa prioriknowledge to quantify short echoin vivo 1H MR spectra.
Magn Reson Med34:17–24.
Stanley JA, Panchalingam K, Miller G, McClure RJ, Pettegrew JW (1997): A new method to quantify the broad component under the phosphodiester resonance and its application to study first-episode never medicated schizophrenics. In: Pro-ceedings of the International Society for Magnetic Resonance in Medicine.Berkeley, CA: ISMRM, 1408.
Stanley JA, Williamson PC, Drost DJ, Carr TJ, Rylett RJ, Malla A, Thompson RT (1995b): Anin vivostudy of the prefrontal cortex of schizophrenic patients at different stages of illness via phosphorus magnetic resonance spectroscopy.Arch Gen Psychiatry52:399 – 406.
Stanley JA, Williamson PC, Drost DJ, Carr TJ, Rylett RJ, Morrison-Stewart S, Thompson RT (1994): Membrane phos-pholipid metabolism and schizophrenia: An in vivo31P-MR
spectroscopy study.Schizophr Res13:209 –215.
Stanley JA, Williamson PC, Drost DJ, Rylett RJ, Carr TJ, Malla A, Thompson RT (1996): An in vivo proton magnetic resonance spectroscopy study of schizophrenia patients.
Schizophr Bull22:597– 609.
Trabesinger AH, Weber OM, Duc CO, Boesiger P (1999): Detection of glutathione in the human brainin vivoby means of double quantum coherence filtering. Magn Reson Med
42:283–289.
Truckenmiller ME, Namboodiri MAA, Brownstein MJ, Neale JH (1985): N-Acetylation of L-aspartate in the nervous system: Differential distribution of a specific enzyme.J Neurochem
45:1658 –1662.
Urenjak J, Williams SR, Gadian DG, Noble M (1993): Proton nuclear magnetic resonance spectroscopy unambiguously identifies different neural cell types.J Neurosci13:981–989. van den Berg CJ, Garfinkel D (1971): A stimulation study of brain compartments. Metabolism of glutamate and related substances in mouse brain.Biochem J123:211–218. Vanhamme L, van den Boogaart A, Van Huffel S (1997):
Improved method for accurate and efficient quantification of MRS data with use of prior knowledge. J Magn Reson
129:35– 43.
Wallimann T, Wyss M, Brdiczka D, Nicolay K, Eppenberger HM (1992): Intracellular compartmentation, structure and function of creatine kinase isoenzymes in tissues with high and fluctuating energy demands: The “phosphocreatine cir-cuit” for cellular energy homeostasis.Biochem J281:21– 40. Williamson P, Pelz D, Merskey H, Morrison S, Karlik S, Drost D, et al (1992): Frontal, temporal, and striatal proton relax-ation times in schizophrenic patients and normal comparison subjects.Am J Psychiatry149:549 –551.