SIFT FOR DENSE POINT CLOUD MATCHING AND AERO TRIANGULATION
Jaan-Rong Tsay a, *, Ming-Shiuan Lee b a
Dept. of Geomatics, National Cheng Kung University, 70101 Tainan, Taiwan - [email protected]
bDept. of Geomatics, National Cheng Kung University, 70101 Tainan, Taiwan - [email protected]
Commission III, WG III/1
KEY WORDS: SIFT, Dense Matching, Quality Filtering (QF), Aerotriangulation, Point Cloud
ABSTRACT:
This paper presents a new method for dense point cloud matching and aero triangulation based on the well-known scale invariant feature transform (SIFT) technique. The modern digital cameras can take high resolution aerial images with high end lap between contiguous images in a strip and, if needed, also with high side lap between images on neighboring strips. Therefore, automation on image matching for generation of high density of 3D object points becomes applicable. A new method is thus developed to perform the processing. Moreover, it can do an aero triangulation and automatic tie point measurement without the need on the input data such as block and strip data for providing image overlap information. In order to increase the effectiveness of the method for simultaneously processing a large number of aerial images with large image format in a block area, both schemes of Quality Filtering (QF) and Affine Transformation Prediction (AFTP) are proposed for automatic tie point extraction and measurement with a better and satisfactory efficiency. Tests are done by using aerial images taken with the RMK DX camera in Taiwan. Also, high precision ground check points are adopted to evaluate the quality of the results. They show that a high density of 3D object points are extracted and determined. Furthermore, the automatic tie point selection and measurement is done efficiently even under the circumstance that no priori-knowledge on image overlap is available. Also, ground check points show that the accuracy of photo coordinates is 0.21 pixels, namely it reaches a subpixel level.
* Corresponding author. This is useful to know for communication with the appropriate person in cases with more than one author.
1. INTRODUCTION
One of the up-to-date issues in photogrammetry is dense matching, especially pixelwise matching of aerial images. Matching results provided by local stereo matching methods like Normalized Cross-Correlation (NCC) and Least Square Image Matching (LSIM) are in general not reliable enough. Global matching (GM) of highly overlapping images increases the reliability, but its computational complexity is too high. The commercial software Photosynth/Geosynth by Microsoft Corporation utilized the GM technique for dense matching and stitching pictures together, with Virtual Earth, encouraging businesses to combine the two technologies (Computerworld, 2012). In order to reduce the runtime of GM, the German Aerospace Center (Deutsches Zentrum für Luft- und Raumfahrt, DLR) developed the semiglobal matching (SGM) method. Both SGM and its extensions are described in typical publications like (Hirschmueller, 2008 and 2011). They are adopted by the commercial software 3D RealityMaps to perform accurate and reliable dense point cloud matching, and are useful for many applications like 3D reconstruction of object surfaces, especially on local surfaces with occlusions, edges, fine structures, and low or repetitive textures (Siegert, 2011; RealityMaps, 2012).
For example, the pixelwise, Mutual Information (MI)-based matching cost is used for compensating radiometric differences of input images. The method offers a very good trade off between runtime and accuracy, particularly at object borders. SGM has participated in several tests and evaluations. The Middlebury stereo pages (Scharstein and Szeliski, 2011) currently list 108 stereo methods. The consistent SGM that is modified for structured indoor scenes has a Rank of 30 and an average error of 5.8%.
The SGM method is very well-known in the field of computer vision, and used for finding corresponding pixels in a pair of images or multiple ones. It assumes the image orientation data and the information of image overlapping are known. In photogrammetry, unknowns of image orientations and object coordinates can be solved by bundle block adjustment, which is a primary process of geomatic data acquisition (Heipke, 1997). To further increase the degree of automation of modern aerial triangulation and geomatic data acquisition, this paper proposes a new method based on SIFT for dense point cloud matching without the need on any image overlap information.
2. METHOD
2.1 Main Processing Phases
To take a more compatible architecture into account, a scale and rotation invariant method is selected for automatic tie point measurements, namely the well-known scale invariant feature transform (SIFT) technique. SIFT belongs to the class of feature-based matching, and includes two main processing phases – keypoint extraction and keypoint matching (Lowe, 2004). Keypoint extraction includes Gaussian filtering and computation of DoG (Difference of Gaussian) at different image pyramid level to detect the extreme values. Those pixels with these extreme values are selected keypoints, described by means of a descriptor defined by a 128 dimensional vector. Then keypoint matching is simply to calculate the Euclidean distances from one keypoint descriptor on the left image to another keypoint descriptors on the right image, i.e. a pair of images at one time. If the distance ratio (the shortest Euclidean distance divided by the second short one) is smaller than the threshold, then the keypoint is matched. Thus, the one on the left image is matched to another one on the right image. Otherwise, the matching for this keypoint on the left image fails. International Archives of the Photogrammetry, Remote Sensing and Spatial Information Sciences, Volume XXXIX-B3, 2012
The matching and searching operations will be done repeatedly until all keypoints are processed.
The proposed dense matching strategy is illustrated in Figure 1. Without the need on priori knowledge on image overlap information, the first step is to process SIFT keypoint extraction to obtain the location (abbreviated as Loc.) and descriptor (abbreviated as Des.) of each kepoint on P input images (P ≧
2). The loop number equals to P, namely the number of input
images. Step 2 will be the keypoint matching for
C
2p pairs ofimages, and one image pair at each time. Then, the result table of each image matching pair stores locations (of matched points) and numbers of the left and right image for every image matching pair. And Step 3 will be matched point connection via comparing the locations of matched points, rearranging and coding all the matched points into numbered result, eventually.
Figure 1. Dense point cloud matching strategy
Figure 2 illustrates the format of temporary tables of matched point connection. Every table of single image matching pair’s result contains locations (row, column) of matched points on left and right image, denoted by (rL, cL) and (rR, cR). And the table of connection result stores location (r,c), point number (PN) and index value for every tie point in each image, which is done by means of location matching using the result table of image matching pair. The index value is used for descriptor inquiry, namely to inform that the descriptor belongs to the i-th keypoint on the j-th image. Therefore, the numbered tie points are connected, if their |∆r|<10-6pixels and |∆c|<10-6 pixels, and the repeated measurements are eliminated at this step.
Figure 2. Connection of matched points
Figure 3. Method of key point extraction for a large image
Furthermore, in order to increase the operational efficiency especially for large format image of m x n pixels, e.g. m=12096 and n=11200 for our test aerial images, the input image is first divided into small sub-images, as shown in Figure 3. Taking the capacity of the core processing programs executed on the adopted PC into account, each sub-image of the size 1800 rows x 1800 columns is used in this study. Then, key points are
extracted in each image. All key points extracted in all sub-images are then merged together to output the results of key point extraction for the original input image of large format.
2.2 Quality Filtering (QF)
The extremely huge number of key points limits the efficiency of matching a large number of aerial images with large image format. In order to reduce the runtime, quality filtering (QF) is attempting to reserve those key points with best image quality. The standard deviation Gstd of gray levels, computed by Eq.(1), of every keypoint is computed in a local image window of 15 x 15 pixels centered at the keypoint. Generally, Gstd stands for the contrast of the keypoint image. In case of less noise, it also indicates the amount of texture information (or so-called quality) on the keypoint.
Assuming that the indicator values Gstd of all keypoints in one image are normally distributed, the threshold for the selection of those best key points will be set to their mean plus standard deviation of overall indicator values in one image. Thus, only about 16% key points are reserved for later matching. Apparently, QF uses a heuristic filtering step based on the standard deviation of gray-levels to throw away weak keypoints in uniformly distributed individual sub-images. Since the indicator value of QF is changeable and the threshold is adjustable, the goodness and availability of the setting will be verified by the tests.
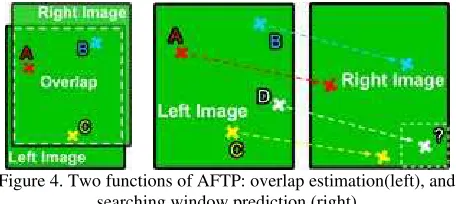
Figure 4. Two functions of AFTP: overlap estimation(left), and searching window prediction (right)
2.3 Affine Transformation Prediction (AFTP)
This method uses AFTP to estimate the overlap area, and to predict the location of searching window, as shown in Figure 4. Instead of using original high resolution images, AFTP uses higher layer images with less number of key points in image pyramid to perform a fast pre-matching to maintain the efficiency and determine the necessity of follow-up process simultaneously. The image size at the top level is assumed to be about 700 x 700 pixels. If the six affine transformation parameters of an image matching pair can be calculated with a proper accuracy by means of least-squares adjustment (LSA), then these two images are overlapped. The locations of their corresponding image points are approximately described by the affine transformation parameters, which can also be utilized for prediction of searching window. Otherwise, this image matching pair has no overlap or rare overlap, and it will be skipped in the follow-up matching process. As long as better overlapped image matching pairs are processed, the tie points International Archives of the Photogrammetry, Remote Sensing and Spatial Information Sciences, Volume XXXIX-B3, 2012
can then be connected correctly in a procedure for connecting all matched points.
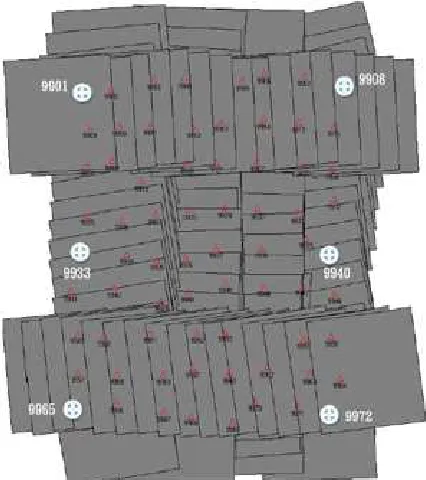
Moreover, another advantage of the AFTP on the top level of image pyramid is that AFTP automatically provides approximate image overlap information in a block. In other word, this study proposes the new method for SIFT supported dense point cloud matching and aero triangulation without the need on the known image overlap information which is often given by the input strip and block parameters.
Figure 5. AFTP provides approximate image overlap information automatically
The afore-mentioned method for dense point cloud matching can be done by the only input of aerial images. After the transformation from image coordinates (r, c) to photo coordinates (x, y), a bundle block adjustment with data snooping (Baarda, 1968) procedure is used for preliminary error detection (Kruck, 1984), and quality validation is done by means of ground check points.
Figure 6. Overlap of all 108 test images, and locations of 6 ground control points and 65 check points
3. TESTS
3.1 Efficiency Analysis
Test data includes in total 108 aerial images taken with the RMK DX camera with the focal length f=9.2cm in Chang-Hua, Taiwan, inclusive of four strips and two cross strips. Figure 6 shows the overlap of these 108 aerial images and the locations
of 6 ground control points and 65 check points uniformly distributed in the test block of about 4km x 4km. The average flight height is about 1100m. The pixel size of these large format aerial images is 7.2µm, and the image size is 12096 rows x 11200 columns. In other word, the average groundel size is about 8.6cm. All tests are done on a PC with the CPU of Intel Corel i5-750 at 2.67 GHz, and the RAM of 3GB, as well as the OS of Microsoft Windows XP Professional SP3, where all programs are written in MATLAB.
First, a block of 11 images is selected for testing the computational efficiency of key point extraction, AFTP and QF, as shown in Table 1. Key point extraction for 11 images spent 6575 seconds. When distance ratio of AFTP is 0.2, there are 28 image matching pairs available, i.e. loop number is reduced from 55 to 28. The “distance ratio of AFTP” means the distance ratio of SIFT set to a stricter smaller threshold in order to select less number of best keypoints as input points to the AFTP. AFTP for these image pairs spent 116 seconds. QF for all key points on all 11 images spent 567 seconds. Figure 7 illustrates the image coverage determined automatically by the AFTP for these 11 images. It demonstrates an advantage of the proposed new method for dense point cloud matching and aero triangulation, namely without the need on image overlap information.
process object Calculation time (seconds)
Key point extraction
11 images 6575
AFTP 55 image pairs 116
QF 11 images 567
Table 1. Calculation time
Figure 7. Image overlap determined by AFTP for the 11 test images
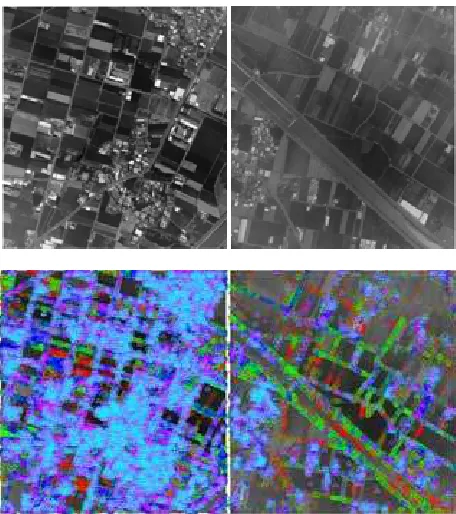
Summarily, Table 2 shows the key point density for these 108 test images on different level of image pyramid, where a stricter threshold 0.2 for the distance ratio of SIFT is adopted to extract less number of best key points. Figure 8 illustrates the key point density on each pyramid level. Apparently, a higher level of image, namely a smaller scale of image, owns a denser cloud of key points. Generally speaking, the density of key points depends not only on the distance ratio threshold of SIFT but also on the amount of image information as well as image quality. For example, Figure 9 illustrates the locations of key International Archives of the Photogrammetry, Remote Sensing and Spatial Information Sciences, Volume XXXIX-B3, 2012
points extracted from two images where red +, green ο , blue ◊ , magenta @ and cyan D denote key points extracted on the level 0, 1, 2, 3, and 4, respectively. The image 10123 (left) has better quality than the image 60185 (right) so that it has much denser cloud of key points. Both images 10123 and 60185 have the same image size of 12096 x 11200 pixels. The same distance ratio of 0.2 determines 359404 and 55269 key points on the image 10123 and 60185, respectively.
Moreover, Figure 10 illustrates the location of key points after quality filtering on different pyramid level. Apparently, they are located at those local feature points with good contrast and textures. Table 3 shows summarily the number and density of key points without and with QF for these 108 test images. For example, Figure 11 illustrates the location of key points without and with quality filtering operation for both good image 10123 and bad image 60185. They show clearly that QF reserves less number of best key points.
Level 0
Level 1
Level 2
Level 3
Level 4 Avg. 1.38 2.34 3.39 4.86 7.29 Max 2.72 4.08 5.97 8.15 12.01 Min 0.41 0.57 0.86 1.41 2.24 RMSD 0.61 0.90 1.32 1.88 2.68 Image
size (pixels)
12096 x 11200
6048 x 5600
3024 x 2800
1512 x 1400
756 x 700
Table 2. Key point density (unit: points / 1000pixels) for the 108 test images on different level of image pyramid
Figure 8. Key point density on each pyramid level (unit: points /1000 pixels)
To investigate the operational efficiency of the method, twelve test cases are also done, and the results are briefly shown in Table 4. In Table 4, Cases I, II and III denote the operation with only QF, with only AFTP, with both QF and AFTP, respectively. The cases 1,2,3 and 4 denote the operation with the distance ratio of 0.20, 0.25, 0.30 and 0.35, respectively. The number of skipped points denotes the number of image points eliminated in the free network adjustment of AT. Thus, the ratio of the number of skipped points divided by the number of matched points, denoted as the skip rate, describes the goodness of matching in each case. As shown in Figure 12, when distance ratio is set to the threshold less than 0.3, Case III, namely operation with both QF and AFTP, maintains better matching efficiency and best matching with lowest rate of skipped points. In general, the larger the distance ratio is, more points are matched per second, but the more the skipped points become. Moreover, Table 4 shows apparently that the calculation time is almost the same for the same case (I, II, or III).
Figure 9. Extracted key points (bottom) from two original images (top) 10123 (left) and 60185 (right)
Figure 10. Location of key points after QF
Number of key points
Density (key points / 1000pixels) Level 0 After QF Level 0 After QF
AVG 186939 27751 1.38 0.20
MAX 368206 53042 2.72 0.39
MIN 55269 7344 0.41 0.05
RMSD 82744 12186 0.61 0.09
Table 3. Number and density of key points without and with QF International Archives of the Photogrammetry, Remote Sensing and Spatial Information Sciences, Volume XXXIX-B3, 2012
Figure 11. Location of key points without QF (top) and with QF (bottom) for the image 10123 (left) and 60185 (right)
Case
Number of Matched
Points
Matching Time (Unit: Seconds)
Number of Skipped
Points
Skip Rate (Unit:
%)
˧.1 2716 5915 19 0.70
˨.1 37505 11621 512 1.37
˩.1 7924 307 45 0.57
˧.2 5767 5920 60 1.04
˨.2 77426 11623 1198 1.55
˩.2 15085 303 145 0.96
˧.3 10026 5933 94 0.94
˨.3 129161 11626 2293 1.78
˩.3 23650 303 218 0.92
˧.4 15214 5968 156 1.03
˨.4 187295 11632 3867 2.06
˩.4 32787 304 422 1.29
Table 4. Computational efficiency of AFTP and QF
Figure 12. Average matching speed and skip rate for the cases I, II and III denoted by blue, yellowgreen and orange colour; solid and dashed lines denote average matching speed and skip rate,
respectively
3.2 Bundle Block Adjustment
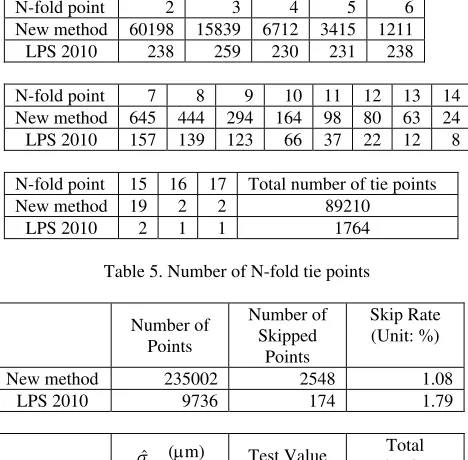
Now, all 108 RMK DX images and 71 known high precision ground points are used for quality validation. The efficiency of the new method is also relatively compared to the commercial software LPS/ERDAS Imagine 2010. The latter provides automatic tie point measurement based on least-squared image matching and a default density of 5 x 5 standard tie points per image. Table 5 shows the number of N-fold tie points determined by the new method of SIFT-supported dense point cloud matching and by the LPS/ERDAS Imagine 2010. Apparently, the new method can provide denser cloud of tie points than the default density of LPS/ERDAS Imagine 2010.
N-fold point 2 3 4 5 6
New method 60198 15839 6712 3415 1211
LPS 2010 238 259 230 231 238
N-fold point 7 8 9 10 11 12 13 14
New method 645 444 294 164 98 80 63 24
LPS 2010 157 139 123 66 37 22 12 8
N-fold point 15 16 17 Total number of tie points
New method 19 2 2 89210
LPS 2010 2 1 1 1764
Table 5. Number of N-fold tie points
Number of Points
Number of Skipped
Points
Skip Rate (Unit: %)
New method 235002 2548 1.08
LPS 2010 9736 174 1.79
xy
σˆ (µm) Test Value Total Redundancy
New method 1.5 1.05 193965
LPS 2010 2.1 1.00 14371
Table 6. Results of free network adjustments done by the new method and LPS2010
These tie points are also first checked by means of free network adjustment, and the results are shown in Table 6, where the test value is the ratio of the a priori accuracy divided by posteriori accuracy. It shows that the new method provides the denser tie points with the photo coordinate accuracy
xy
σˆ = ±1.5µm =
±0.21pixel. The skip rate is 1.08%.
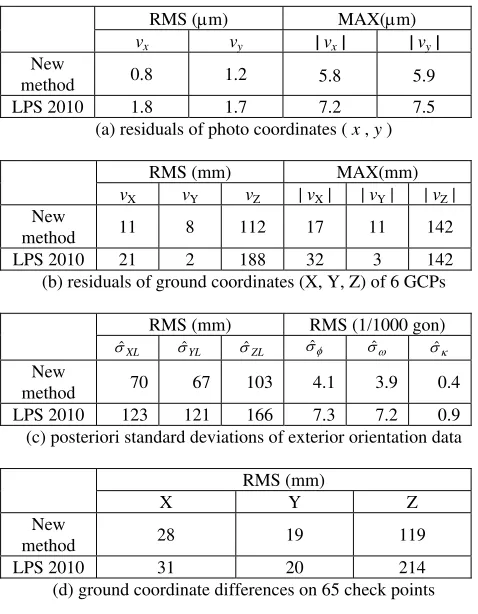
Then the bundle block adjustment with control data is performed, where 6 full control points and 65 independent check points shown in Figure 6 are used. The statistic figures of both bundle block adjustments using the tie points measured by the new method proposed in this paper and by the commercial software LPS 2010 are listed in Table 7. The root mean square value of ground coordinate differences on all 65 check points shows that the points determined by the new method have the horizontal accuracy ±3.4cm and the vertical accuracy ±11.9cm.
Moreover, they show that the new method is available to aerial triangulation with high precision and good efficiency. Especially, the new method don’t need any information on image overlap. In other word, the new method don’t need the well-known input data of block parameters and strip parameters which are often adopted by general commercial AT softwares. International Archives of the Photogrammetry, Remote Sensing and Spatial Information Sciences, Volume XXXIX-B3, 2012
RMS (µm) MAX(µm)
(b) residuals of ground coordinates (X, Y, Z) of 6 GCPs
RMS (mm) RMS (1/1000 gon)
(c) posteriori standard deviations of exterior orientation data
RMS (mm)
X Y Z
New
method 28 19 119
LPS 2010 31 20 214
(d) ground coordinate differences on 65 check points
Table 7. Results of bundle block adjustments done by the new method and LPS2010
4. CONCLUSION
Although the commercial solutions (e.g. Bundler, pix4d.com. acute3d.com) are out there which do almost exactly what is proposed in this paper, namely they use SIFT or an equivalent detector/descriptor scheme to match an unorganized set of images in unknown configuration, and orient them, this paper was developed in the work of a master thesis in NCKU, and proposes an alternative method for dense point cloud matching and aero triangulation based on the well-known scale invariant feature transform (SIFT) technique. Test results verify some advantages of this method. The proposed QF operation reserves those key points with best image quality, e.g. in the top 16% of all key points. This method uses AFTP to estimate the overlap area, and to predict the location of searching window. In order to increase the computational efficiency, image pyramid with a top level image of about 700 x 700 pixels is adopted. The automatic extraction, selection and measurement of corresponding tie points is done efficiently, especially without the need on block parameters and strip parameters for providing priori knowledge on image overlap information. Moreover, the density of key points depends not only on the distance ratio threshold of SIFT but also on the amount of image information as well as image quality.
Tests are done by using 108 aerial images. They show that operation with both QF and AFTP provides better matching efficiency and best matching with lowest rate of skipped points, when distance ratio is set to the threshold less than 0.3. In general, the larger the distance ratio is, more points are matched per second, but the more the skipped points become. Due to the robustness of bundle block adjustment with data snooping operation, the skipped, namely inaccurate, points can be detected and eliminated. Furthermore, the accuracy of photo
coordinates of image points extracted and matched by the proposed new method reaches a subpixel level and the accuracy of aerial triangulation is ±1.5µm ≈±0.21 pixels. The skip rate is 1.08%.
Also, the efficiency and benefit of AFTP and QF processing have been verified. These two pre-process procedures still can be further improved on efficiency and feasibility, especially the quality indicator for QF. Moreover, some extension versions of the semiglobal matching (SGM) will be further developed in the future to perform a robust pixelwise matching with quality figures. Their applications such as on high resolution true ortho image generation, high resolution and high precision digital surface model generation as well as 3D cyber city modelling with a good LOD (level of detail) will also be studied and developed.
5. REFERENCE
Baarda, W., 1968. A Testing Procedure for Use in Geodetic Networks. Netherlands Geodetic Commission, Vol. 2, No. 5., Delft.
Computerworld, 2012. Microsoft combines Photosynth, Virtual Earth. Downloaded on April 22, 2012 from http://www. computerworld.com/s/article/9132675/Microsoft_combines_Ph otosynth_Virtual_Earth.
Heipke, C., 1997. Special issue: Automatic image orientation - Preface. ISPRS Journal of Photogrammetry and Remote Sensing, 52(3), 101-102.
Hirschmueller, H., 2008. Stereo Processing by Semiglobal Matching and Mutual Information. IEEE Transactions on Pattern Analysis and Machine Intelligence, 30(2), pp. 328-341.
Hirschmueller, H., 2011. Semi-Global Matching – Motivation, Developments and Applications, 53rd Photogrammetric Week, pp. 173-184, University of Stuttgart, Germany.
Kruck, E., 1984. Ordering and Solution of Large Normal Equation Systems for Simultaneous Geodetic and Photogrammetric Adjustment. 15th ISPRS Congress, 17-29 June, 1984, Rio de Janeiro, BRASIL.
Lowe, D. G., 2004. Distinctive image features from scale-invariant keypoints. International Journal of Computer Vision, 60(2), pp. 91-110.
RealityMaps, 2012. 3D RealityMaps - Faszinierende Landschaften in der dritten Dimension, downloaded on April 22, 2012 from http://www.reality-maps.de/.
Scharstein, D. and Szeliski, R., 2011. Middlebury Stereo Evaluation. http://vision.middlebury.edu/stereo.
Siegert, F., 2011. Very Advanced 3D Landscape Models, 53rd Photogrammetric Week, pp. 295-303, University of Stuttgart, Germany, September 5-9, 2011.