MULTIPLE-MODEL BASED UPDATE OF BELGIAN REFERENCE ROAD DATA
M. Ziemsa, J. Beyenb, S. Muellera, S. Rooversb, C. Heipkea
a
IPI – Institute of Photogrammetry and GeoInformation, Leibniz Universität Hannover,
Nienburger Str. 1, 30167 Hannover, Germany, [email protected]
b
NGI – National Geographical Institute,
Abdij Ter Kameren 13, B-1000 Brussels, Belgium, {jbe,str}@ngi.be
KEY WORDS: Road database, Quality, Updating, Aerial, DEM/DTM, Classification, Model, Change detection
ABSTRACT:
This paper describes a semi-automatic system for road update based on high resolution orthophotos and 3D surface models. Potential update regions are identified by an object-wise verification of all existing database records, followed by a scene-wide detection of redevelopment regions. The proposed system combines several road detection and road verification approaches from current literature to form a more general solution. Each road detection / verification approach is realized as an independent module representing a unique road model combined with a corresponding processing strategy. The object-wise verification result of each module is formulated as a binary decision between the classes “correct road” and “incorrect road”. These individual decisions are combined by Dempster-Shafer fusion, which provides tools for dealing with uncertain and incomplete knowledge about the statistical properties of the data. For each road detection / verification module a confidence function for the result is introduced that reflects the degree of correspondence of an actual test situation with an optimal situation according to the underlying road model of that module. Experimental results achieved with data from the national Belgian road database in a test site of about 134 km² demonstrate the potential of the method.
1. INTRODUCTION
1.1 Motivation
From 1990 till 2007, the National Geographical Institute (NGI), the Belgian national mapping agency, performed their first collection of midscale digital topographical data by stereoplotting and field attribution. Since 2008, the NGI have been updating the main objects of their reference database in a 3-years cycle. While, the process of quality control concerning the geometric, semantic and topologic coherence of the updated data has been automated recently with perfect satisfaction, the update mainly exists in visually comparing the data with new aerial photographs. Starting from the second update in 2011, the lower average age of the data causes a smaller number of changes per km², so that it becomes less efficient to visually scan the complete images for changes. The effort of visually scanning the images for changes thus become very time-consuming compared to the total amount of real work. Thus, there exists a considerable potential of cost-saving for the production line by automatically comparing the new images with the three year old data before updating, so that the human operator can be guided to the spots where updating is needed.
In the following we present a method for updating the road layer of the Belgian large scale topographic reference database on the basis of RGB orthophotos, a normalized Digital Surface Model (nDSM) and 1:100.000 landcover data. The orthophotos are generated from aerial images with 30 cm ground sampling distance. The nDSM with 1.5 m point spacing was generated by dense matching using the same aerial images. The presented experiments investigate the reliability and efficiency of the method.
1.2 Related Work
A large number of road detection approaches where developed in the last two decades. Already in (Mena, 2003) more than 250 different references were listed, while a more recent overview is given in (Poullis and You, 2009). However, only a minor part of these works deals with updating databases, which can be seen as a natural application for road detection methods. The subsequent overview concentrates on those applications to identify the most relevant works for our basic strategy.
partly changed, changed, disappeared and created. As their focus is on map conflation they assume the existence of a perfectly detected road network as a basis. Poulain et al. (2010) describe a method that applies high resolution SAR and optical images for an automatic update of a road database in urban context. In this work, for each database object features are extracted within a region around the position, indicated by the database. The features reflect different properties of a road but also those of typical urban context objects, i.e. buildings and vegetation. In a first step each road object is verified using the extracted features, where the features are combined by Dempster-Shafer theory. In a second step, road candidates are extracted from all over the image and verified by their proximity to the road network, verified in the first step.
The work, described in the present paper is a part of the WiPKA project that was initiated in 2000 by the federal mapping agency of Germany for the task of quality control of topographic data (Busch et al. 2004). Within the project framework Gerke and Heipke (2008) presented a method for road verification on the basis of aerial or satellite imagery for rural areas. They extract linear objects within a region around the position, indicated by the database. Then, the extracted lines are compared with the database and only if an object is not covered by appropriate linear objects it has to be inspected by a human operator. In (Ziems et al., 2010), this strategy is adapted to urban areas by introducing additional road models that were explicitly designed for the urban context. Similar to (Poulain et al., 2010) buildings and vegetation are explicitly considered as context objects and were combined by Dempster-Shafer theory.
1.3 Basic Strategy
In accordance with conclusions from a review of the related work, we carry out an object-wise test for each database object on geometry, attributes and its topologic relations with other objects. Thus, we solve the task locally and introduce prior knowledge from the database to be updated. In order to achieve a high generality for the method, the test itself is based on several independent road models. This method is further called
Multiple Model Verification (MMV) and will be introduced in
Section 2. As such a strategy is not necessarily able to detect omission errors, we introduce a second method in Section 3, the
Redevelopment Detection, which is applied to all regions that
are indicated as undeveloped in the database. This method assumes the majority of the missing roads to be located within redeveloped regions. Finally, the revised objects from the MMV and the update regions indicated by Redevelopment Detection are forwarded to a standard GIS environment for a manual analysis. For implementation we use the open-source library CNES-OrfeoToolbox (www.orfeo-toolbox.org) providing various image analysis subroutines and the open-source library GeoAIDA (www.geoaida.berlios.de), which allows the knowledge based combination and the parallelization of different image analysis processes.
2. MULTIPLE MODEL VERIFICATION
It is the basic idea of the method to combine powerful approaches from current research in the field of road extraction to create a more general solution for the verification of road data. Our method relies on a set of existing object extraction algorithms realized as so called verification modules. Every road object in the database is checked by every available verification module. These modules are based on different models e.g., describing roads as lines, as homogeneous areas with parallel edges, by their spectral and structural differences
with respect to their surroundings or by their relations to context objects such as buildings. Each algorithm can deal with a subset of these characteristics and its success is finally connected to the compliance of the model assumptions to the actual appearance of the roads in the image. In addition to its decision about the correctness of the road object each module delivers a confidence value C with 0≤C≤1 that reflects the degree to which the situation encountered for the road object corresponds to the optimal situation according to the module’s underlying object model. The decisions from all modules are combined in a decision level fusion process in which the confidence values control the impact of a single decision on the final result.
2.1 Dempster-Shafer Fusion Framework
The fusion of the results from the different verification modules is based on the theory of Dempster-Shafer (Dempster, 1968 and Shafer, 1976). Our approach distinguishes the two classes road (R) and non-road (N). Consequently, the hypothesis space, which is called frame of discernment Θ in the terminology of Dempster-Shafer, contains only of two elements: Θ={R,N}. The power set of Θ, denoted by 2Θ, is 2Θ={Ø, R,N,R∪N} whereØ is the empty set. A probability mass m is assigned to each of the three classes by a “sensor” (verification module) such that 0≤m(x)≤1 and m(R), m(N) and m(R∪N) sum up to 1 and thus Ø=0. The sum of all probability masses assigned directly to a class AŒ2Θ is called support sp(A) of A. If p sensors are available, probability masses mi have to be defined for all these sensors i with 1≤i≤p. The Dempster-Shafer theory allows the combination of the probability masses from several sensors to compute a combined probability mass for each class A Œ 2Θ:
In our model for the original probability masses we assume that each verification module p delivers a binary decision for or against a road, i.e., either Rp or Np, and a confidence value
Cp∈{0, 1} measuring the trust into this decision. Its negation
CpN=1-Cp corresponds to the degree to which no decision can be taken by the module given the data. This can be modelled by assigning a probability mass of 1-Cp to Θ, thus
mp(Rp∪Np)=1-Cp. If the module’s decision is Rp, we set
mp(Rp)=Cp and mp(Np)=0; otherwise, we set mp(Rp)=0 and mp(Np)=Cp. Thus, the decision is weighted by Cp in the Dempster-Shafer framework. If the confidence value Cp is low for all modules p, the support for R and N will be relatively low, too, so that these cases can be found by applying a threshold to the support.
with BjŒ 2Θ (1)
2.2 The Verification Modules
In the following we give an overview of the eight modules that where applied for the experiments shown in section 4. As the main contribution of this work is the definition of the model specific confidence functions this aspect is explained in more detail. Further information concerning the algorithms can be found in the denoted references and in (Ziems et al., 2010).
underlying line extractor is introduced in (Steger, 1998). The parameters for the line extraction are adjusted for each database object individually by taking into account the positional and attribute information from the database to be verified. Then, the extracted lines are compared to the original database by explicitly checking geometry, shape and line width of each road object. If a major part of the road is covered by appropriate line segments the database object is decided to be correct, otherwise no decision is taken. A more comprehensive description of the verification approach is given in (Gerke and Heipke, 2008). As for the underlying line model a homogeneous surrounding of the road is a precondition, the algorithm leads to less confident results in heterogeneous surroundings. Hence, the confidence of the module’s decision is calculated from the image entropy E:
( ) log
( )
g GE
H g
H
∈
= −
∑
⋅
g
where H(g) is the histogram of the image region next to the road (see Figure 1). While the entropy is low for homogeneous context, the possible maximum entropy is defined by the radiometric resolution, e.g. 8.0 for 8 bit images.
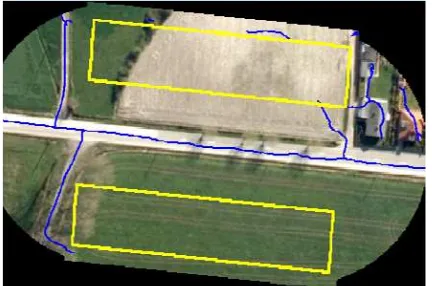
Figure 1: 2D line extraction result (blue) and region mask (yellow) for computing entropy E
Thus, we consider a high confidence value C2D-line=0.9 for E=0 and a low confidence value C2D-line=0.1 for the maximum entropy (E=8). Based on these two fixed values a sigmoid function is defined by the two parameters a and b:
Thus, for increasing E we obtain a monotonically decreasing function for the confidence.
Figure 2: Left: RGB image with database roads. Right: nDSM with 3D-line extraction result (cyan) and region mask for computing entropy (yellow)
3D-line detection: This module is based on (Hinz and Baumgartner, 2003), where roads are detected as “valleys” in the nDSM. Analogously to the 2D-line detector the resulting lines are compared with the database objects to provide a decision about the correctness of a road object. The algorithm is designed for densely built-up areas, while less densely built-up areas show many linear structures in the nDSM that may lead to false alarms. However, the confidence is not affected in flat terrain at all. Thus, the confidence of the module is formulated by the entropy E in the nDSM next to the road (see Figure 2). Analogously, to the 2D-line detection a sigmoid function (Equation 2) is chosen for C3D-line=0.9 if E is minimal and C3D-line=0.1 if E is maximal.
Parallel Edge Analysis: A frequently used characteristic of roads are parallel edge pairs to represent road borders in an edge image. In our system, this information is extracted by the method described in (Baumgartner et al., 1999). Only if a major part of the database object with length ldb is covered by extracted edge pairs of length lH+ with appropriate geometry, shape and spacing the object is considered as correct, otherwise no decision is taken and thus the confidence is set to zero. In case of high coverage the confidence of the module’s decision is determined by analyzing alternative hypotheses in the local surrounding that may result from buildings or tracks on crop fields. To achieve this aim, the projected length lH- of extracted edge pairs with contradictory geometry and shape is computed with respect to the database object with length ldb. The confidence is defined as follows:
H H
Figure 3: Input image superimposed by one road region (blue) and 24 non-road regions (yellow). Lower left: the computed SSH scores over the profile index. Lower right: and an optimal SSH configuration.
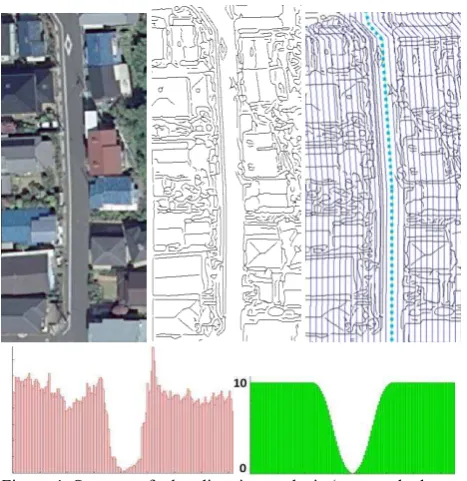
Edge Direction Analysis: This module is based on the method developed by Youn et al. (2008) for the task of road extraction in urban areas, where the buildings form regular grids. The underlying model is based on the structural differences between a road and a row of buildings. Several lines are defined, which are parallel to the database object (see Figure 4). Then the number of intersections of these lines with edges extracted from the image is counted. The lower part of Figure 4 shows the distribution of this count for the lines. The small values in the centre indicate the true position of the road, whereas greater values indicate buildings. The minimum of the histogram is assumed to correspond to the road centre line. If the distance between the position of this minimum and the position of the centre line indicated by the database is below the maximum allowable error according to the specifications of the database the road is decided to be correct.
Figure 4: Strategy of edge direction analysis (extracted edges = black, expected road centre line = dotted cyan, parallel profiles = blue). Lower left: the computed histogram of the intersection counts over the profile index. Lower right: an optimal model configuration.
For urban areas containing a lot of small houses, the model is robust. However, more homogeneous context such as grassland, paddy fields or huge industry halls, is not covered by the model. Therefore, the confidence value is modelled as a function of the surrounding structure elements. The actual histogram is compared with a histogram based on the optimal situationfor that model, exemplarily depicted in the lower right of Figure 4. This optimal situation is an absolute free passage through the expected road and a number of intersections on each side of the road, which occur if a row of buildings of standard size is situated next to the road with a specific width. The confidence Cdir for the edge direction analysis is calculated as the area ratio of the actual histogram H and an optimal histogram Hmodel:
1
1 1
2
1
( ) ( )
( )
A N
n n A d ir
N
m o d e l n
n n
C =
H n
−
= = +
=
Δ ⋅ Δ
⎛ ⎞
⎜ ⎟
⎜ ⎟
⎝ ⎠
∑
∑
∑
where n is the profile index and A is the index of the centre line profile. Δ(n) = Hmodel(n) - H(n) if Hmodel(n)≥H(n) and Δ(n) = 0 otherwise. As the neighbouring areas may be fairly different on both road sides, the area to the left and the area to the right of the road are considered by different terms.
Colour Classification: An image region belonging to a road has specific radiometric properties that can be defined in advance. Analogously to the approach described in (Fujimura et al., 2008), we use a Support Vector Machine (SVM) classifier, introduced by Vapnik (1998), in the implementation of the open-source library LIBSVM (Chang & Lin, 2001). The object-wise classification is realized in the RGB feature space for the two classes road and non-road. As the radiometric properties for both classes depend on local characteristics, e.g. road surfaces, sun-angle, presence of shadowed areas or roof colours, a training step is required for each scene. The underlying model is appropriate if the colour contrast between the road and its local surrounding is high and if the training data represent the tested object but unreliable otherwise. Both aspects are considered for the definition of the confidence function. The contrast is determined based on the feature space distances
d(z,xl) and d(z,xr) between the feature vector of the road
candidate z and the two feature vectors xl and xr from both sides of the road. The latter are computed from the regions next to the road that have similar shape and area, comparable to the SSH strategy, see Figure 3. Furthermore, the feature space distance d(z,υ) between the training dataset, represented by a Support Vector Domain Description (SVDD) (Tax and Druin, 2004), and the feature vector of the road candidate z is computed. The confidence Ccol is defined as follows:
( ( , ) )
( , )
( ,
)
1
1
l r
col a d z b
d z x
d z x
C
e
d
d
− ⋅ υ+=
⋅
⋅
−
(3)where d¯ is the average distance of the feature vectors, used for training, to the SVDD surface. Thus, the value reflects the density of the training data. The parameters a and b for the sigmoid function are selected so that the term becomes 0.9 for d(z,υ)=0 and 0.1 for d(z,υ)= d¯. A more comprehensive description is given in (Ziems et al., 2011).
simple. Firstly, a 3m threshold in the nDSM is applied; secondly the trees are removed by introducing a vegetation mask, which is computed on the basis of the hue in HSI colour space. A road object is decided to be wrong if its centre line intersects an extracted building (see Figure 5). However, the nDSM is unreliable for regions that are not visible in at least two aerial images, used for the nDSM generation. Due to occlusions such situations occur frequently close to high buildings. As the raw data of the matching process and the camera orientations are not available for the task, the confidence function is only based on the height h of the intersecting building and the road width w, stored in the database. The confidence Cbuild is defined as follows:
( )
1
1
build w
a b
h
C
e
− +=
−
where the parameters a and b for the sigmoid are selected so that Cbuild=0.9 for w/h =1.0 and Cbuild=0.1 for w/h =0.1.
Figure 5: Building detection strategy. Top: RGB image superimposed with database roads containing one incorrect road object. Bottom: nDSM superimposed with extracted buildings (cyan) and evaluation result (rejected road = red, no decision = yellow)
Grassland Detection: In (Zhang, 2004) and (Youn et al., 2008) grassland was considered as a hint against the existence of a road. As changes concerning the road network are frequently connected with a redevelopment of grassland areas it is usually a good indicator for changes, exemplarily shown in Figure 6. Thus, we use a ground vegetation mask to detect intersections between grassland area and the road centrelines. The ground vegetation mask containing all green image regions is computed from hue in HSI colour space and from the nDSM heights. The confidence of the decision relies on the quality of the ground vegetation mask. As the vegetation areas of interest have usually a small size only, local radiometric properties can significantly affect the result and lead to misclassifications, e.g. within dark road surfaces or shadowed road areas. Thus, the brightness of the intersecting image region is considered for the confidence Cveg:
( )
1
1
veg ai b
C
e
− +=
−
where i¯ is the mean intensity value of the intersecting pixels in the green band. The parameters a and b for the sigmoid function are selected so that Cveg=0.9 for i¯ =I¯ and Cveg=0.1 fori¯ =0.0, where I¯denotes the mean intensity value of the whole scene in the green band.
Figure 6: Redeveloped traffic circle identified by grassland detection (rejected roads = red, no decision = yellow)
2.3 Combination
All results provided by the verification modules are combined by Dempster's rule (see Equation 1). As short road objects are not necessarily covered by one of the models introduced so far, a subsequent topologic analysis is applied on short objects. The basic idea is that short roads can be additionally evaluated by junctions, exemplarily shown in Figure 7. This is realized by initially evaluating all the junctions in a scene through the longer roads connecting them. Therefore, the roads are interpreted as “sensors”, providing probability masses for both classes: junction and non-junction. Then the classified junctions are applied as additional modules for short roads.
Figure 7: Topologic Analysis: A short road object is not decided by one of the verification modules. According to the topologic analysis it will be additionally evaluated by the two connected junctions and thus, decided as correct (correct = green, undecided = yellow).
Finally, both sp(R) and sp(N) can be computed for each road object. The normal case is that the class obtaining maximum support will be accepted. However, we know that we will not find a solution for all objects. Therefore, we consider explicitly the case of high uncertainty where we have small support for both classes R and N. If it is most important to ensure that all errors in the database are detected, each road for which the automatic analysis supports weakly the correctness has to be inspected by a human operator. In contrast, if the amount of manual post processing has to be minimized only roads for which the automatic analysis supports clearly the incorrectness have to be inspected manually. The outcome of both strategies will be investigated in Section 4, by applying two different setups:
3. REDEVELOPMENT DETECTION
The method, presented in Section 2, is able to detect omission errors in the database if these are associated with a rearrangement of existing roads. Such an assumption is meaningful for built-up areas but less so for other landcover classes. Thus, it is the basic idea of the method described in this section to check all the regions that are denoted as undeveloped in the database. To achieve this aim, an SVM based classifier is applied to separate the three classes: impervious surface, forest
and ground vegetation. The feature vector is defined for each
pixel by spectral mean and variance of the gradient image within a 15m neighbourhood. In addition to the three RGB channels the nDSM is used for the feature computation. As the roads of the database and the 1:100.000 landcover data for our test region have approximately the same update status we combine them to achieve a single class for impervious surface, which includes settlement, industry and the buffered roads. The resulting label image is compared to the area-wide classification result. Then, all contradicting regions that are classified as
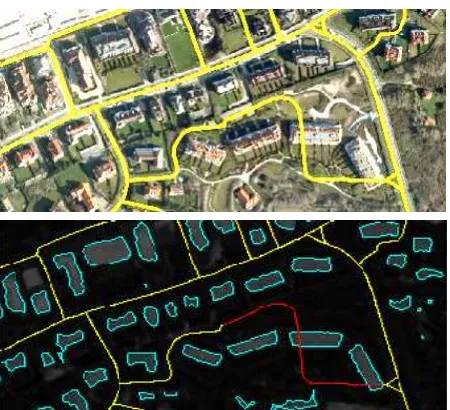
impervious surface are computed (see Figure 8, left). In order to
filter out irrelevant objects, we apply a minimum threshold of 500 m2 for the region size. The resulting regions are vectorized and introduced in a GIS environment as areal hints for new roads (see red enclosed area on the right in Figure 8).
Figure 8: Redevelopment detection; Left: no contradictions to the database = green, irrelevant contradictions = blue, contradicting regions denoting impervious surface = red; Right: current road data = yellow, roads required to be updated = blue, methods outcome = red
4. EXPERIMENTS
In order to evaluate the proposed method, a test area of 134 km² around the Belgian city Zeebrugge was investigated. The reference data were generated on the basis of the latest manual update in 2008. The update was carried out on road data from 1991 and thus includes many changes. We consider unchanged,
new and disappeared as a possible status of a road in the
reference. The status was computed from the differences between both datasets, changed roads are marked as
disappeared and new. The 1991-dataset contains 5898 road
objects of which 359 have disappeared. In the 2008-dataset 909 new objects were added. Furthermore, the 1991-dataset contains 769 dirt roads of which 111 have disappeared. In the 2008-dataset 99 dirt roads are new.
In the following efficiency and reliability of the proposed method are investigated. As all the generated update hints have to be inspected by a human operator, the amount of the relevant hints compared to the absolute number of hints is used to denote efficiency, while the reliability is described by the percentage of the disappeared and new roads that are actually marked for manual analysis. The results are presented for two different setups concerning the MMV (see Section 2.3.), where Setup 1 was defined to achieve a high reliability, while Setup 2 aims at
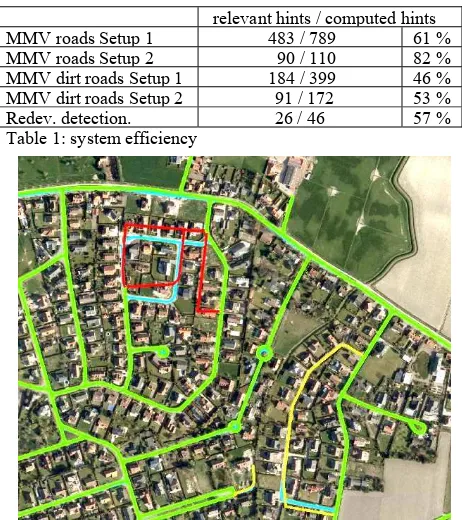
a high efficiency. Table 1 displays the system efficiency of the MMV and the Redevelopment detection for the two setups. A hint is denoted as relevant, if the hint intersects at least one new or disappeared road. For the first setup the MMV marks 789 (13%) of the roads and 399 (52%) of the dirt roads for manual post processing, of which 61% were relevant for roads and 46% for dirt roads; the numbers for setup 2 can be found in Table 1. The computed hints in the first setup include a number of objects for which the MMV contains no appropriate model and thus, produces more false alarms than for the second setup. Figure 9 and Figure 10 show the effects of the two setups by means of colours: Setup 1 considers yellow and red objects, while Setup 2 considers only red objects.
relevant hints / computed hints
MMV roads Setup 1 483 / 789 61 %
MMV roads Setup 2 90 / 110 82 %
MMV dirt roads Setup 1 184 / 399 46 % MMV dirt roads Setup 2 91 / 172 53 %
Redev. detection. 26 / 46 57 %
Table 1: system efficiency
Figure 9: MMV successfully detects changed roads within a residential area (MMV outcome: correct = green, incorrect = red, undecided = yellow, reference = blue)
Figure 10: MMV does not contain an appropriate harbour (left) and the sea front model (right) (MMV outcome: correct = green, incorrect = red, undecided = yellow)
RedevD MMV detection ratio
roads Setup 1
254 662 697 / 909 77 %
roads Setup 2 420 508 / 909 56 %
dirt roads Setup 1
12 84 84 / 99 85 %
dirt roads Setup 2 63 64/ 99 65 %
REFERENCES
RedevD MMV detection ratio
roads Setup 1
9 327 327 / 359 91 %
roads Setup 2 134 141 / 359 40 %
dirt roads Setup 1
8 104 104 / 111 94 %
dirt roads Setup 2 67 70 / 111 63 %
Baumgartner, A., Steger, C., Mayer, H., Eckstein, W., Ebner, H., 1999. Automatic road extraction based on multi-scale, grouping, and context. PE&RS 65(7):777-785.
Busch, A., Gerke, M., Grünreich, D., Heipke, C., Liedtke, C. E., Müller, S., 2004: Automated Verification of a Topographic Reference Dataset: System Design and Practical Results.
IntArchPhotogramRemSens SpatialInformSci 35/B2: 735-740.
Table 3: disappeared roads
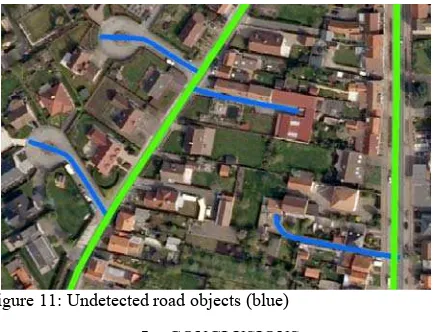
With respect to system reliability Table 2 and Table 3 display the detection ratios for new and disappeared roads. The second column of Table 2 displays the new objects that intersect detected redevelopment regions. The third column displays the new objects that intersect revised or undecided objects, computed by the MMV method. If a group of new objects is connected to each other and obviously belongs to the same redevelopment project, the whole group is considered as detected, if at least a single object of that group intersects a hint. The last column displays the overall detected new objects compared to the absolute value given in the reference. As can be seen in Table 2 the method fails to detect 100% of the new objects, even for Setup 1. This is caused by the fact that not only new objects are part of the update but also objects that were simply forgotten during the first data collection (see Figure 11). Furthermore, numerous undetected objects are situated in small redeveloped regions near old built-up areas. Due to generalisation effects of the small scale landcover data some redeveloped regions were already denoted as built-up area and thus not detectable by the proposed strategy.
Chang, C.-C., Lin, C.-J., 2001: LIBSVM: a library for support vector machines: ACM Trans. on Intel. Sys. and Techn..
Dempster A. P., 1968. A generalization of Bayesian inference.
-Journal of the Royal Statistical Society (30) 205-247.
Gerke, M., Heipke, C., 2008. Image based quality assessment of road databases. IJGIS 22 (8): 871-894
Fortier, M. A., Ziou, D., Armenakis, C. & Wang, S., 2001: Automated correction and updating of road databases from high-resolution imagery. – Can. J. of Rem. Sens. 27 (1): 76–89.
Fujimura, H., Ziems, M., Heipke, C., 2008. De-generalization of Japanese road data using satellite imagery. PFG 5: 363-373.
Hinz, S., Baumgartner, A., 2003. Automatic extraction of urban roads from multi-view aerial imagery. IJPRS 58(1-2): 83-98.
Klang, D., 1998: Automatic detection of changes in road databases using satellite imagery. IntArchPhotogramRemSens
SpatialInformSci 32/4: 293-298.
The detection ratios of the disappeared roads are shown in Table 3. As each database object is checked explicitly by the MMV method nearly all changes can be detected in the first setup. It can also be seen that the amount of the undecided objects contains a high number of disappeared roads that would be ignored by a human operator, if the second setup was applied. As the redevelopment detection was designed to detect new roads it is less surprising that nearly no additional information could be generated here.
Mena, J., B., 2003: State of the art on automatic road extraction for GIS update: a novel classification. - Journal Pattern
Recognition Letters archive 24 (16), 3037-3058.
Poulain, V., Inglada, J., Spigai, M., Tourneret, J.,Y., Marthon, P., 2010: High resolution optical and sar image fusion for road database updating. IGARSS 2010: 2747-2750.
Poullis, C. and You, S., 2010: Delineation and geometric modelling of road networks. IJPRS 65(2), 165-181.
Figure 11: Undetected road objects (blue)
Shafer, G., 1976: The Mathematical Theory of Evidence, Princeton University Press.
Steger, C., 1998. An Unbiased Detector of Curvilinear Structures, IEEE T-PAMI 20(2): 311{326.
Tax, D.M.J., Duin, R.P.W., 2004: Support vector data description. Machine Learning 54(1) 45–66
Vapnik, V. N., 1998: Statistical Learning Theory. Wiley, N.Y.
Wiedemann, C., Ebner, H., 2000. Automatic completion and evaluation of road networks. IntArchPhotogramRemSens
SpatialInformSci 33(B3/2): 979-986
Youn, J., Bethel, J. S., Mikhail, E. M., Lee, C., 2008: Extracting urban road networks from high-resolution true orthoimage and Lidar, PE&RS 74(2): 227-238.
5. CONCLUSIONS
Zhang, C., 2004: Towards an operational system for automated updating of road databases by integration of imagery and geodata. IJPRS 58 (3/4): 166-186.
The results presented in this paper show that a human operator can concentrate on a relatively small part of a scene if the proposed method is applied. In such a case he would still detect more than 90% of the changed roads and nearly 80% of the new roads. However, for practical applications the detection ratios should be increased beyond 90%. Therefore, it is planed to introduce additional data, e.g. an infrared channel and a building database instead of the small scale landcover data. Furthermore, a system test is scheduled for the next update circle 2008-2011, which directly compares the temporal efforts, with and without the proposed method, to quantify the time that can potentially be saved.
Zhang, Q., Couloigner, I., 2004: A framework for road change detection and map updating, - IntArchPhotogramRemSens
SpatialInformSci 35(Part B2): 720-734.
Ziems, M., Fujimura, H., Heipke, C., Rottensteiner, F., 2010: Multiple-model based verification of japanese road data.
IntArchPhotogramRemSensSpatialInformSci (9) 13-19.