ON-LINE CHANGE MONITORING WITH TRANSFORMED MULTI-SPECTRAL TIME
SERIES, A STUDY CASE IN TROPICAL FOREST
Meng Lua,∗
, Eliakim Hamunyelab a
Institute for Geoinformatics, Westf¨alische Wilhelms-Universitt M¨unster (WWU), Heisenbergstraße 2, 48149 M¨unster, Germany - [email protected]
b
Laboratory of Geo-Information Science and Remote Sensing, Wageningen University, Droevendaalsesteeg 3, Wageningen 6708 PB, The Netherlands
KEY WORDS: Multi-Spectral, BFAST, Dimension Reduction, Deforestation Monitor
ABSTRACT:
In recent years, the methods for detecting structural changes in time series have been adapted for forest disturbance monitoring using satellite data. The BFAST (Breaks For Additive Season and Trend) Monitor framework, which detects forest cover disturbances from satellite image time series based on empirical fluctuation tests, is particularly used for near real-time deforestation monitoring, and it has been shown to be robust in detecting forest disturbances. Typically, a vegetation index that is transformed from spectral bands into feature space (e.g. normalised difference vegetation index (NDVI)) is used as input for BFAST Monitor. However, using a vegetation index for deforestation monitoring is a major limitation because it is difficult to separate deforestation from multiple seasonality effects, noise, and other forest disturbance. In this study, we address such limitation by exploiting the multi-spectral band of satellite data. To demonstrate our approach, we carried out a case study in a deciduous tropical forest in Bolivia, South America. We reduce the dimensionality from spectral bands, space and time with projective methods particularly the Principal Component Analysis (PCA), resulting in a new index that is more suitable for change monitoring. Our results show significantly improved temporal delay in deforestation detection. With our approach, we achieved a median temporal lag of 6 observations, which was significantly shorter than the temporal lags from conventional approaches (14 to 21 observations).
1. INTRODUCTION
Near real-time change monitoring has important application in forest management. Open access to satellite data (e.g Landsat and Sentinels) enables for near real-time detection of forest dis-turbance using advanced time series analysis methods (Banskota et al., 2014; Forkel et al., 2013; Kuan and Hornik, 1995). Most of the recent studies on near real-time forest disturbance monitor-ing have applied BFAST Monitor (Verbesselt et al., 2012), which detects forest disturbances by identifying a historical period, fit a linear regression model for historical time series, and monitor change in newly acquired observation either with a cumulative sum (CUSUM) or moving sums (MOSUM) process of the differ-ences between new data and model predictions. Studies applying BFAST monitor mostly use normalised difference vegetation in-dex (NDVI), normalised difference moisture inin-dex (NDMI), and enhanced vegetation index (EVI). These indices contrast the ab-sorption and reflection properties of vegetation between near or short-wave infrared bands and visible bands.
Monitoring deforestation on single vegetation index has several limitations: 1) the harmonic model might not be sufficient to cap-ture the complex seasonality in tropical forest, 2) one model is not sufficient for spatially heterogeneous tree species. 3) defor-estation can be hard to separate from drought, other disturbances, and noise, 4) training data is required to identify if the detected change is deforestation. Recent studies attempted to solve the limitation (3) by integrating data from two sensors and introduc-ing a climate variable (Dutrieux et al., 2015), or attempted to re-duce the effect of multiple seasonality with a vegetation index that is normalized to spatially neighboring pixels (Hamunyela et al., 2016).
∗
Corresponding author
In this study we integrate the spectral information in BFAST Mon-itor change monMon-itoring framework and show the potential of in-tegrating multidimensional information to improve the change monitoring process. The exploration is based on the assump-tion that the original variables can be seen as the composite of independent variables, with one of them containing deforestation information.
2. STUDY AREA AND DATA PREPROCESSING
We carried out a case study in a deciduous tropical forest in Bo-livia, South America (18.49◦
S, 62.36◦
W,10,000km2). The dataset consists of all available Landsat TM5 and Landsat ETM+7 L1T imagery before 2015. All the sample points were collected manually with high and medium spatial resolution satellite data. We masked the snow, shadow and water and cloud with FMask (Zhu and Woodcock, 2012). Low extreme values are filtered and interpolated, and Band values that are out of the range (1-10000) are filtered.
3. METHOD
3.1 Multi-spectral bands transformation
We use Principal Component Analysis (PCA) to find a project-ing vectoraon the original variables matrixX, so that the new variables inaX are orthogonal. This means to diagonalize the co-variance matrix ofX(var(X)),
var(aX) =a′
Σa, (1)
The International Archives of the Photogrammetry, Remote Sensing and Spatial Information Sciences, Volume XLI-B7, 2016 XXIII ISPRS Congress, 12–19 July 2016, Prague, Czech Republic
This contribution has been peer-reviewed.
Σa=λa, (2)
whereais the projecting matrix, andλis the diagonalized covari-ance matrix that is sorted from the largest value of the varicovari-ance. This lead to the eigen-vector based analysis, wherea contains eigenvector or the PC loadings, andλcontains eigenvalue. The new variable matrix is then obtained as the weighted combination of original variables, which is the PC score.
PC loadings are trained on matrixX contains the spectral time series of Landsat image band 1-5, and band 7 for spectral time se-ries of each location,X=
Xij
(m×6), with the gray scale value
at timei(i= 1, ..., m), for each spectral bandj(j= 1, ...,6).X
is centered to zero mean and standardized to unit variance.
The input matrixXis all available data, with this method we see the original spectral bands as mixing variables, and expect to find the independent data source that compose to this variable:
X=AS, (3)
where X denotes the original data, A denotes a mixing matrix, and S denotes the independent components.
The goal then is to estimate a separation matrix to separate the independent sources from the mixture.
Y =W X, (4)
where Y denotes the independent data source, W denotes the sep-aration matrix, and X denotes the original data.
3.2 Deforestation Monitoring
We applied BFAST monitor on the scores of PC components to monitor deforestation. To model the temporal behaviour of the forest, we only fit a mean model to the time series because the seasonality effects have been removed. Data covering the period of 1984 - 2005 were used as initial stable history. Then the algo-rithms sequentially monitor for change in the monitoring period. If the monitoring period becomes longer than 2 years, and no change is detected, the data that have been monitored are then moved into stable historical period. The algorithms stops moni-toring when change is detected or the test reach to the last obser-vation. The results were validated considering spatial accuracy and temporal accuracy. The spatial accuracy consists of omis-sion error, commisomis-sion error, and overall accuracy. The tempo-ral accuracy is measured by the number of observations between BFAST detected change date and real change date. This is to cope with the irregularity of Landsat data. We compared our re-sults to the rere-sults achieved from NDMI. NDMI has been recom-mended in recent studies because it achieve best results. NDMI is calculated as (SWIF-NIR)/(SWIF+NIR). We fitted a 1st order harmonic model om NDMI time series when monitoring defor-estation using BFAST Monitor.
4. RESULT
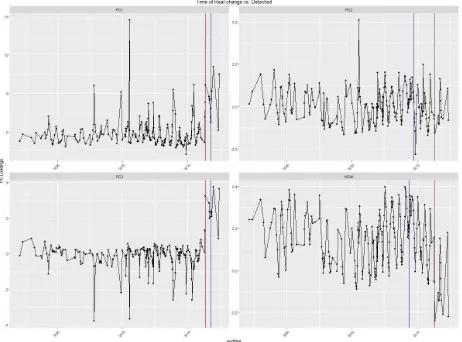
Our results show that using the score of PC3 has resulted in sig-nificantly improved overall accuracy and a shorter temporal delay than when monitoring deforestation using NDMI index(Table 1). Time series of different indices and the results of disturbance de-tection can be observed from (Figure 1. Using NDMI has resulted
in many false positives (change detected before real change). The score of PC3 successfully extracted the signal of the disturbance, and thus resulted in a more suitable index for deforestation mon-itoring.
Table 1: validation result
overall spatial accuracy temporal delay
PC1 0.813 13
PC2 0.692 22
PC3 0.900 7
NDMI 0.331 22
Table 2: confusion matrix. Temporal detection delay is by count-ing the number of observation. PCA3 is the score of the 3rd PC that is applied on all the available data. PCA3 history is to com-pute PCA on history period only.
Figure 1: time of real change (red line) vs. time of detected change (blue line) using the PCA scores as index and NDMI as index
5. DISCUSSION
5.1 The PCA integrated BFAST
In this study we still used the BFAST framework for deforesta-tion monitor. The methodology is different from the original idea of monitoring an vegetation index that fluctuate with the change of vegetation, which is subject to drought and seasonality effects. The proposed method is to find the source variables of mixing variable, which the source variables can be estimated with dif-ferent ways. Such as a variety of models in factor analysis. In the situation where the distribution of original variables variables are not Gaussian, and the non-Gaussian change is of interest, ICA (independent component analysis) might be used. This PCA inte-grated method detects the change of relationship between multi-spectral bands, which is free from the modeling or removing of seasonality, and other short-term climatic effects.
5.2 limitation
The limitation of this method is that the PC components are or-dered by eigenvalues (correlation), which does not contain physi-cal meanings. For example, the pattern of the eigenvectors of the 2nd PC component of one time series could show the same pat-tern to the eigenvectors of the 1st PC component of another time
The International Archives of the Photogrammetry, Remote Sensing and Spatial Information Sciences, Volume XLI-B7, 2016 XXIII ISPRS Congress, 12–19 July 2016, Prague, Czech Republic
This contribution has been peer-reviewed.
series. The method is successful here because forest is spatially homogeneous (consists only vegetation), so that for most of the time series the order of PC components would be consistent.
6. CONCLUSION
In this paper we firstly explored the transformation of spectral time series into new variables that include a clearer change sig-nal. We distinguish this method between the previously feature space transformation methods (e.g. NDMI), which does not use the previous time series information. Secondly we explored a way to remove seasonality effect. Both results indicate improved deforestation monitor in temporal delay. With increased spatial and temporal resolution of satellite data in future, combining di-mensional reduction methods and sequential test of time series structural change has promising application in realizing near real-time deforestation monitor and contribute greatly to forest man-agement and ecosystem conservation.
References
Banskota, A., Kayastha, N., Falkowski, M. J., Wulder, M. A., Froese, R. E. and White, J. C., 2014. Forest monitoring us-ing landsat time series data: A review. Canadian Journal of Remote Sensing 40(5), pp. 362–384.
Dutrieux, L. P., Verbesselt, J., Kooistra, L. and Herold, M., 2015. Monitoring forest cover loss using multiple data streams, a case study of a tropical dry forest in bolivia. ISPRS Journal of Photogrammetry and Remote Sensing 107, pp. 112–125.
Forkel, M., Carvalhais, N., Verbesselt, J., Mahecha, M. D., Neigh, C. S. and Reichstein, M., 2013. Trend change detec-tion in NDVI time series: Effects of inter-annual variability and methodology. Remote Sensing 5(5), pp. 2113–2144.
Hamunyela, E., Verbesselt, J. and Herold, M., 2016. Using spatial context to improve early detection of deforestation from land-sat time series. Remote Sensing of Environment 172, pp. 126– 138.
Kuan, C.-M. and Hornik, K., 1995. The generalized fluctuation test: A unifying view. Econometric Reviews 14(2), pp. 135– 161.
Verbesselt, J., Zeileis, A. and Herold, M., 2012. Near real-time disturbance detection using satellite image time series. Remote Sensing of Environment 123, pp. 98–108.
Zhu, Z. and Woodcock, C. E., 2012. Object-based cloud and cloud shadow detection in landsat imagery. Remote Sensing of Environment 118, pp. 83 – 94.
The International Archives of the Photogrammetry, Remote Sensing and Spatial Information Sciences, Volume XLI-B7, 2016 XXIII ISPRS Congress, 12–19 July 2016, Prague, Czech Republic
This contribution has been peer-reviewed.