1
THE LASER SCAN DATA AS A KEY ELEMENT IN THE HYDRAULIC FLOOD
MODELLING IN URBAN AREAS
A. Sole a, L. Giosa a, R. Albano a, A. Cantisani a
a University of Basilicata, Engineering School, 85100 Potenza, Italy - [email protected], [email protected], [email protected], [email protected]
KEY WORDS: Airborne Laser Scanning (ALS), GIS, Flood Risk, DTM, Urban Areas.
ABSTRACT:
This paper is intended to highlight the need to use data at high spatial resolution, such as those obtained through the use of Airborne Laser Scanning (ALS) techniques, to support hydraulic models for the assessment of flood hazards in urban territory. In fact, the significant structural features (houses, walls, roads, etc.) in the city are important in relation to both the volume of the floodplain that can be occupied by the flow and the direction that the flow takes across the floodplain. ALS data can range up to several terabytes in size and is a function of the geographic scale of the mission. Also, this data is typically irregular with uneven point density. Therefore, a quick method is described to ride out the difficulties to handle the large datasets with uneven point densities and to improve the extracting of feature information for further use in Geographic Information System (GIS) analysis. Finally, a comparison is made between the maximum inundated area obtained from ALS data and that one calculated using a traditional topographic map. The results show that the high-resolution data obtained from airborne remote sensing can increase the opportunities for representation of small-scale structural elements in complex systems using two-dimensional models of flood inundation.
1. INTRODUCTION
1.1 General Instructions
Urban flooding is one of the most important problems of hydraulic protection for the enormous number of people potentially involved, the value of the elements exposed to risk and the complexity of the territory in question. An analysis of global statistics showed that inland floods (river floods, flash floods and drainage floods) caused 175,000 fatalities and affected more than 2.2 billion people between 1975 and 2002 (Jonkman, 2005). In Italy, by analyzing the historical data from 1918 to 1994, the National Research Council (CNR) and the National Group for Hydro-Geological Disaster Prevention (GNDCI) (2000) have verified that the hydrogeological instability (landslides and floods) affects 68% of its territory and, in this range as much as 42.8 % is affected by floods. Due the extreme importance of the problem, the DIRECTIVE 2007/60/EC on the assessment and management of flood risks, aims as its primary objective to reduce the negative consequences for human health, the environment, cultural heritage and economic activity associated. In most countries that are usually exposed to the risk of flooding, the study of flooded areas is regulated by special rules that identify the general criteria by which the studies and the maps of hydraulic hazard and risk must be undertaken and prepared. In the area of study, local regulation for flood defense requires the delineation of flooding maps with return periods of 30, 200 and 500 years (Basin Autority of Basilicata, 2011). The return period expresses the probability that events such as floods occur. Today, the study of flood hazards is made using mono (1D) and bi-dimensional (2D) hydraulic models and the choice depends on the morphological characteristics of the study area. Some of the most popular inundation software are: HEC-RAS by Hydrologic Engineering Center of the United States Army Corps of Engineers, MIKE11 by Danish Hydraulic Institute or InfoWorks RS by HR Wallingford for 1D modelling. A 2D approach in numerical simulation of flood propagation is more
widely used in inundation studies affecting areas with a complex geometry like the city zones: Flo-2D by J. O’Brien., MIKE21 by the Danish Hydraulic Institute, Telemac2D by National Hydraulics and Environment Laboratory of the Research and Development Directorate of the French Electricity Board in collaboration with other research institutes, CCHE2D by the National Center for Computational Hydroscience and Engineering of the University of Mississippi. Many 2D models to solve shallow water equations have been developed and they applied: the method of characteristics (Cappelaere, 1997), the method of finite differences (Fennema & Chaudhry, 1990), the method of finite elements (Berger & Stockstill, 1995) and, finally, the method of finite volumes (Zhao et al.,1994). In hydraulic modelling, the most critical factor is the topography of river channels and floodplains which can influence the extent of the flooded area built by the simulation model (Nicholas & Walling, 1997; Horritt & Bates, 2001). Generally, good Digital Terrain Models (DTM) must contain an accurate description of micro-topography (e.g. banks, roads, buildings) to create a computational domain in which all the elements, that support or oppose flow and flood propagation, are included. The detail of DTM is expressed by its resolution that can be defined as the distance between the grid points of the models, equivalent to the pixel size of the raster file of the DTM. The latter can be constructed from traditional land surveys or modern survey data. The advances in remote sensing techniques is made possible to generate high resolution DTMs for whole watersheds at reasonable costs (ten thousand euro and more depending of the extension and morphology of the area). The cost trend is in decreasing due to the development of new and more modern technologies. A public authorities, like a municipality can amortize the cost of remote sensing data using them throughout the entire process of delineation of City Plan. In the last years the technology of Airborne Laser Scanning (ALS) has emerged, which allows to produce high-quality DTMs with vertical accuracies less than ±25 cm, depending on the land cover, slope, flight parameters and environmental
conditions. The vertical accuracy of the DTM is very highly recommended because any error in the ground level will cause error in the flooded area calculations (Smith et al., 2006). According to others authors (Horritt & Bates, 2002), this paper highlights the potential of the ALS data and ease of use in the construction of the computational domain. Galy & Sanders (2000), developed a method based upon airborne Synthetic Aperture Radar (SAR) data using GIS and image processing tools (ERDAS) without verifies and optimize the data before created the DTM. Marks K. et al 2000 and Wise S.. 2000, describe the advantage and the methodology to use laser scan data for hydrological or hydraulic studies but they didn't explain a detailed and easy methodology to improve and make more quick the creation of a DTM. By understanding the characteristics of LAS data and storing in a geo-database, you can take advantage of geo-processing tools in GIS to effectively manage LiDAR data and to prepare it for analysis. Storing LiDAR datasets in a geo-database improves efficiency, data retrieval, and spatial analysis in GIS projects.
After this introduction (Sec.1), Sec. 2 describes the analysis of the significant features of the study area and the choosing of the cell size of the computational domain with grid format for the inundation modelling, construction of the grid by ALS survey and comparison with that one obtained from traditional survey. The last section shows the comparison between maximum extend of flooding designed from traditional and modern survey techniques.
2. FLOOD HAZARD IN POTENZA CITY
In this work, the riverine flood hazard maps has been realized in the urban area of Potenza, Southern Italy. It is the capital city of Basilicata Region (96,000 inhabitants) and it is crossed by rivers and streams. The hydraulic simulation involved only a stream called Gallitello with a basin of 26 km2 and a length of about 9.3 km. Recently a building development has affected the areas around the Gallitello stream. In fact, a number of both commercial and residential buildings and roads have been built and.
A urban flood occurs due to a complex interaction of natural and engineered processes. These processes determines discharges exceeding the drainage capacity of the river but insufficient maintenance of the river or inadequate hydraulic structures may increase the disastrous effects of the flood. Frequently urban expansion is achieved without putting the necessary attention to the complexity and specificity of the different areas that compose it. It has therefore come to build, even intensely, river areas.
In the hydraulic model the river, the hydraulic structures and the urbanized area with roads, squares and buildings should be adequately represented. The river and its hydraulic structures are usually described using cross sections measured on site and roads, walls, squares and buildings can be extracted by DTM built by land survey systems. Anthropic elements of the city can greatly influence the distribution of the flood: so, the roads can facilitate movement of volumes of water to areas also significantly far from the river, while the buildings act as real obstructions to the propagation of the flood.
The river system considered is already in crisis for flows with a small return period. Recently, floods with a return period less than 10 years have occurred in January 2005 and February 2005 and 2006. That events are not exceptional and therefore, did not cause significant damage to people, roads and buildings. However, they have highlighted some critical issues that could be dangerous in the case of more severe floods. These problems can be summarized as: small bridges that act as obstacles to the
flow of the floods, inadequate levees, poor cleaning of the the last 4.2 km of Gallitello river. It is carried out using MIKE FLOOD because its simulation time is reasonable even at high resolutions (Sole et al., 2011). The hydraulic simulations are carried out by reference to synthetic hydrographs, the software of the DHI Water Environment Health, that integrates two of the most widely used hydrodynamic models namely MIKE 11 (1D model) and MIKE 21 (2D model). The 1D model of MIKE FLOOD, MIKE 11, is used to simulate flood wave propagation between the left and right banks of the Gallitello river. It is implemented with 90 cross sections derived from ground survey. The 2D model of MIKE FLOOD, MIKE21, instead, is used to simulate the propagation of flood volume on the urbanized areas adjacent to Gallitello, having topped its banks. The hydrograph has been evaluated from the curves of reduction of peak discharge (NERC, 1975) where, the peak discharge, is referred to return time of 200 years.
The first step of this work has been defining the hydraulically most important elements. This to choose a computational domain’s resolution more suitable to realize a good characterization of the study area. The hydraulically most important elements in the urbanized area of Potenza are: the river reach, the buildings and the streets. The river reach has been implemented in the 1D model with 90 cross sections derived from ground survey, the buildings have been delimited and the polygons that describe them have been eliminated from the 2D hydraulic calculation. Consequently, the only road network that is about 5m wide was to be represented in detail in the 2D model. So a squared mesh of 2m resolution has been
The Airborne Laser scanner System is an active remote sensing sensor, that coupled laser fastened on an aircraft with precise kinematic positioning provided by a differential global positioning system (DGPS) to produce accurate elevation measurements (Carter, 2007).
Acquisition data from Potenza city is formulated by a “Topeye MKII” system . This system works in Full waveform in order to give a better description of all ground elements. In fact, it is able to record multiple echoes besides the first and the last pulse (Casella, 1999; Casas 2006). In the urbanized area a flight (November, 2009) is made at 600m on height with a orthophotos resolution of 5cm and a laser density of 40pt/m2. Then the data of the ALS were analyzed and corrected, using specific software and different classification algorithms, to extract the LAS data that are classified into: default, ground, low vegetation, medium vegetation, high vegetation, buildings. Only the ground points are considered in the study. The elevation of buildings and vegetation are not considered as significant data. As mentioned earlier, in the numerical model, buildings are excluded from the hydraulic calculation because they are evaluated by abrupt elevations. Besides, vegetated
areas are considered as bare-earth ones (ground points) but with a roughness coefficient corresponding to the plant species. Building the computational domain from the laser-scan data can be relatively simple using a GIS tool and few actions which are described below. The ALS point cloud data can include time, return number, and intensity values, in addition to the three dimensional positional information (i.e., X, Y, Z) that represents latitude, longitude, elevation. It is delivered as a collection of files in LAS (binary) format that store more data, including richer headers that contain information about the data, in smaller sizes than ASC files. This means that the files can be read more quickly. Therefore, a quick method is described to ride out the difficulties to handle the large datasets with uneven point densities and to improve the extracting of feature information.
The LiDAR data are managed before importing to the geo-database as described in following workflow:
1. ORGANIZE: calculate basic statistics and organize data by spatial proximity
2. SUBSET: create a subset of the data based on the area of interest
3. GROUP: determinate LiDAR point in the area of interest to group as multipoint features
4. EVALUATE: evaluate the point density to ensure it is sufficient in the area of interest.
To extract only the indispensable data, the extent and point spacing of the LiDAR dataset must be evaluated. Then a feature class that will define the area of interest must be created. The spacing of the LiDAR dataset is evaluated by the average point spacing is the average distance separating sample points in the LiDAR dataset. The point spacing is a rough estimate that simply compares the area of the file's bounding box with the point count. It is more accurate when its rectangular extent is filled with points. In this work, in fact, a square area of interest has been considered. Therefore, these data can be stored in the geo-database file.
The new output feature class containing statistical information about the LiDAR dataset is created with a GIS tool that supports both LAS and ASC formats. However, it works more quickly on LAS files because it only needs to scan the header portion of the binary file to obtain the necessary information. Multipoint features have been created by a tool that imports one or more files in LAS format into a new multipoint feature class, which is supported by the geo-database. Multipoints are useful for storing thousands of points in one database row thereby reducing the number of rows in a feature class table. This characteristic of multipoints is very beneficial because many points can be handled at the same time, and the storage retrieval costs are immensely reduced. Than you can filter data by return number, class code, or both. Therefore the multipoint features are filtered by class code and was classified as non-ground and bare-earth based.
As discuss before, LiDAR data is typically irregular with uneven point density that is the number of points in a given area. Knowing the point density helps you understand the discontinuities and completeness of the LiDAR data. While denser data captures the surface better and helps in information extraction, the time and resource requirements for analysis associated with denser data are also higher. To calculate the
Finally the data is imported into the geo-database corresponding to generate the terrain data. It is imported into flood modeling software as grid format with a cell of 2mX2m but also a TIN format may be used. A raster DTM from the TIN has been created and not directly the raster to have advantage in the accuracy by the triangular interpolation (Sole & Valanzano,1996). The buildings are inserted after the procedure than the generation of the DTM because in this way we obtain the buildings as obstacles and not a interpolation of the elevations and therefore a gradually increment of the pendency.
4. RESULTS
Performing numerical simulations of flooding in urban areas very often poses the question of how detailed the analysis needs to be in order to give a realistic figure of the expected scenario. Consequently, defining the most important elements (roads, squares, buildings) in the flow propagation that must be accurately represented in the computational domain is very important. The traditional and modern elevation data have been considered to characterize the significant elements on the urbanized area of Potenza. There are only few points/m2 in the first case; whereas, there are about 40 points/m2 in each square meter of the second data set. Two different grids in the simulation model have been created as presented in Figure 1: the top image is one constructed from the ALS data and the bottom image is a DTM obtained from the traditional topographic data . In each image, the urban road line shapefile is superimposed to highlight the differences of the two DTMs. The first DTM has the best characterization of the study area. The transformation of the ALS data in the DTM is relatively simple applying GIS tools if the initial data is very accurate like those considered in this study. In fact, it has a vertical and horizontal accuracy of 10-15 cm with a density of 40 points per square meter (Figure 1).
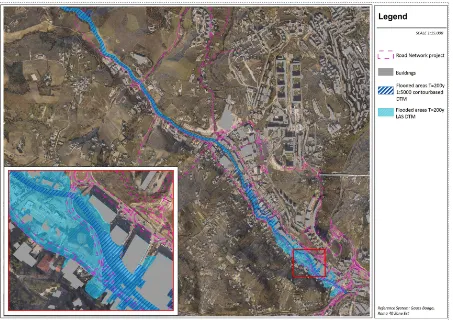
The hydraulic calculations with MIKEFLOOD software have led to estimate the maximum flood area for 200 years return period flow. Two maps of flooded area have been constructed as presented in Figure 2: the first obtained on the topographic map and the second realized using the ALS data. In both cases, floods are caused by insufficient river banks and by the rise in the water level in the river reach immediately upstream some bridges. Also some roads are inundated. The two areas are almost comparable upstream and the maximum differences between the two cases are downstream where there is more urbanization. Overall, the maximum flooded area of the first case is different from that of the second case and it is 0.06 km2 and 0.08 km2 respectively. The choice of which of the two areas is the right one is difficult if a comparison with a real flood event cannot be done. However, highlighting the differences in the results is important to understand that the choice of the elevation data appreciably influences the final result of the hydraulic modelling (Figure 2).
Figure 1. Comparison between the DTM realized from ALS data (top) and the DTM built with 1:5000 contour-based (bottom)
Figure 2. Maximum inundated area for the 200 years return period flow near the Gallitello River
5. CONCLUSION
In complex areas, such as urban areas, a detailed digital model is an important tool to build accurate scenarios of flooding. The maximum inundated area of Potenza city is calculated using an 1D hydraulic model integrated with a 2D model. The 2D computational domain is a squared mesh of 2m and it is built using an ALS elevation dataset with an accuracy of 10-15 cm (horizontal and vertical). Cell size must be smaller than that of the elements hydraulically important in the area of study. Here, for example, the grid resolution is 2 meters to ensure a good representation of the road network with a width of about 5-6 m. High-resolution computational domain requires an extremely detailed digital terrain model as demonstrated comparing the mesh built using LAS data and one built with 1:5000 contour-based. Probably the same details obtained using ALS data could be created from traditional topographic maps but integrating this information with the significantly hydraulic elements of site surveys. Of course, this integration introduces an increase in costs of the traditional relief.
By analysing the time–cost ratio and the accuracy obtained by DTM to estimate the hydraulic modelling results, some selection criteria can be set up for determining the type of DTM to be used. The 1:5000 contour-based DTM has a low cost; however, it alone fails to represent the micro-morphology of the city. Laser-scanner data is more expensive but it gives very detailed results in the flooding models, even when its resolution and accuracy are high. This implies that the hydraulic computational domain can be created with simple and fast actions in GIS. This opportunity is also very important when you consider that the definition of the computational domain is the more laborious step in flood modelling.
The maximum inundated area is also affected by initial elevation data, especially, in an urbanized area. Therefore, an accurate representation of the hydraulically significant elements is recommended.
6. . REFERENCES
Basin Autority of Basilicata, 2011. Plan for the Hydrogeological Risk Defense.
Berger R.C. & Stockstill R.L., 1995. Finite-Element Model for High-velocity Channels. Journal of Hydraulic Engineering, ASCE, 121 (10): 710-716.
Cappellaere B., 1997. Accurate diffusive wave routing. Journal of Hydraulic Engineering, ASCE, 123 (3): 174-181.
Carter, W. E., Shrestha, R. L., & Slatton, C. K., 2007. Geodetic laser scanning, Physics Today by American Institute of Phisics, 41-47.
Casella, V., 1999. Introduction to airborne laser scanning, a GPS-INS based technique. Reports on Geodesy n. 3 (44), 1999, Warsaw University of Technology, ISBN 83-85287-43-4, 249-254.
Casas, A., Benito, G., Thorndycraft, V.R., Rico, M., 2006. The topographic data source of digital terrain models as a key element in the accuracy of hydraulic flood modeling. Earth Surface Processes and Landforms, 31, 444-456.
Fennema R.J. & Chaudhry M.H., 1990. Explicit methods for 2-D transient free surface flows. Journal of Hydraulic Engineering, ASCE, 116 (11): 1013-1034.
Galy H.M & Sanders R.A., 2000. Using SAR Imagery for Flood Modelling. January 4th – 7th 2000 RGS-IBG Annual Conference, University of Sussex, Willis, London, UK.
Horritt, MS. & Bates, PD., 2001. Effects of spatial resolution on a raster based model of flood flow. Journal of Hydrology, 253: 239–249.
Horritt, MS. & Bates, PD., 2002. Evaluation of 1D and 2D numerical models for predicting river flood inundation. Journal of Hydrology, 268: 87–99.
Jonkman, S.N., 2005. Global perspectives of loss of human life caused by floods. Natural Hazards 34:151–175.
Marks K. & Bates P., 2000. Integration of high resolution topographic data with floodplain flow models. Hydrological Processes 14: 2109– 2122.
National Research Council (CNR), 2000. AVI Project, Census of Italian areas historically affected by landslides and floods. Nicholas, A.P. & Walling, D.E., 1997. Modelling flood hydraulics and overbank deposition on river floodplains. Earth Surface Processes and Landforms, 22: 59-77.
Smith, M.J., Edwards, E.P., Priestnall, G. and Bates, P.D., 2006. Exploitation of new data types to create Digital Surface Models for flood inundation modelling. FRMRC Research Report UR3, June 2006. 78pp.
Sole, A. & Valanzano, A. 1996. Digital terrain modeling. Singh V. P. and Fiorentino M. eds., GIS in Hydrology, Water Science and Technology Library , Kluwer Academic Publishers, Dordrecht (NL),pp. 175-194.
Sole, A., Giosa, L., Cantisani, A., Statuto, D., Nolè, L., 2011. Analisi di sensibilità nella modellazione delle inondazioni di aree pianeggianti. Italian Journal of Engeneering Geology and
Environment, Special Issue, pp. 157-167, DOI:
10.4408/IERGE. 2011-01.S-12.
Wise S., 2000. Assessing the quality for hydrological applications of digital elevation models derived from contours. Hydrological Process 14, 1909-1929.
Zhao D.H., Shen H.W., Tabios III G.Q., Lai J.S. & Tan W.Y., 1994. Finite volume two-Dimensional un-steady-flow model for river basin. Journal of Hydraulic Engineering, ASCE, 120 (7): 863-883.
7. . ACKNOWLEDGEMENTS
Authors acknowledge the Municipality of Potenza that has provided the to realize this study.
8. APPENDIX
INTENSITY
The amount of light received by the receiver is referred to as LiDAR intensity. Target- emitter distance, peak pulse power, beam divergence, target reflectivity, surface roughness, interpolation technique and the selected output cell size are some of the factors determining the LiDAR intensity.
POINT DENSITY
Point density refers to the number of points in a given area. The greater the number of points, the denser the dataset.
ASCII
Acronym for American Standard Code for Information Interchange. The de facto standard for the format of text files containing x, y, and z positional values for elevation points and header lines. Values can be space or comma delimited. Spaces are recommended to avoid confusion with localization or internal numeric formats. The first line encountered where the
first three tokens are numeric will be considered the beginning of the point records
LAS
The standard industry format for exchanging LiDAR data is the ASPRS LiDAR LAS format. LAS is the file extension of a binary file. A LAS file contains information for each point, including the number of returns, intensity, x, y, z positional values, scan direction, and GPS time. LAS files are also quicker to read or load and are best for large LiDAR datasets