DETECTION OF COASTLINE DEFORMATION
USING REMOTE SENSING AND GEODETIC SURVEYS
A.Sabuncu, A.Dogru, H.Ozener, B.Turgut
Bogazici University, Kandilli Observatory and Earthquake Research Institute Geodesy Department, Istanbul Turkey (asli.turgutalp, asli.dogru, ozener, turgut)@boun.edu.tr
Commission VI, WG VI/4
KEYWORDS: Landsat 5, Landsat 7, Geodetic Survey, GPS, Shoreline, Remote Sensing
ABSTRACT:
The coastal areas are being destroyed due to the usage that effect the natural balance. Unconsciously sand mining from the sea for nearshore nourishment and construction uses are the main ones. Physical interferences for mining of sand cause an ecologic threat to the coastal environment. However, use of marine sand is inevitable because of economic reasons or unobtainable land-based sand resources. The most convenient solution in such a protection–usage dilemma is to reduce negative impacts of sand production from marine. This depends on the accurate determination of criteriaon production place, style, and amount of sand. With this motivation, nearshore geodedic surveying studies performed on Kilyos Campus of Bogazici University located on the Black Sea coast, north of Istanbul, Turkey between 2001-2002. The study area extends 1 km in the longshore. Geodetic survey was carried out in the summer of 2001 to detect the initial condition for the shoreline. Long-term seasonal changes in shoreline positions were determined biannually. The coast was measured with post-processed kinematic GPS.
Besides, shoreline change has studied using Landsat imagery between the years 1986-2015. The data set of Landsat 5 imageries were dated 05.08.1986 and 31.08.2007 and Landsat 7 imageries were dated 21.07.2001 and 28.07.2015. Landcover types in the study area were analyzed on the basis of pixel based classification method. Firstly, unsupervised classification based on ISODATA (Iterative Self Organizing Data Analysis Technique) has been applied and spectral clusters have been determined that gives prior knowledge about the study area. In the second step, supervised classification was carried out by using the three different approaches which are minimum-distance, parallelepiped and maximum-likelihood. All pixel based classification processes were performed with ENVI 4.8 image processing software. Results of geodetic studies and classification outputs will be presented in this paper.
1. INTRODUCTION
The coast is a unique natural environment between the sea and the land surface. Coastlines and seas are the most fragile ecosystems in the world (Winarso, et al.,2001). The coastal areas are destroyed due to improper usage which effects the balance of nature adversely. Shorelines are changing rapidly on the Earth’s surface due to the different natural factors and human activities. Human activities are the main causes of the shoreline changes than natural factors. Settling, tourism, industry nourishing and sourcing are the main factors that affect the shorelines adversely.
The total length of Turkish shoreline with the islands is 8,333 kilometres, of which 1,067 kilometres are island shores. The distribution of the length of the coasts or the seas are: the Black Sea: 1,701 kilometres (20.4%), the Sea of Marmara: 1,441 kilometres (17.3%), the Aegean Sea: 3,484 kilometres (41.8%), and the Mediterranean: 1,707 kilometres (20.5%) (Gunay, 1987).
In many countries, populations in coastal areas are higher than those in other regions. Many major cities are located near harbors and ports. The landuse changes are the evidence of the impact of human activities on shoreline change. During the construction of buildings and roads, sand and gravel have been used for years all around the world. The world’s beaches are being destroyed to get more sand. Sand mining is used for different purposes such as aggregate in concrete, filling, beach nourishment. These practices are always very dangerous and irrevocable for the shorelines. The results are always damaging the fauna and flora of the coasts.
2. DATA SETS & STUDY AREA 2.1 Datasets
1986 and 31 August 2007 for Landsat 5; 21 July 2001 and 28 July 2015 for Landsat 7 (Figure1).
Landsat Thematic Mapper (TM) 5 was launched on 1 March 1984 and operational imaging ended in November 2011. It worked at an orbital altitude of 705 km. The scene size was 170km*185km. Landsat 5 TM image data files consisted of seven spectral bands which resolution was 30 meters for bands 1 to 7 (URL 1).
Landsat 7 was launched on 15 April 1999 and also worked at an orbital altitude of 705 km. Landsat 7Enhanced Thematic Mapper Plus (ETM+) images consists of 8 spectral bands with spatial resolution 30 m to Band 1 to band 7 and band 8 provides 15 m resolution in panchromatic mode. The scene size is also 170km*185km (URL 2).
Landsat 5 and Landsat 7 satellite imageries were downloaded from the US Geological Survey web site (http://earthexplorer.usgs.gov/). Before the downloading imageries, some important criteria have been defined. If possible, all images have been obtained at same season and with low cloud coverage in order to eliminate errors due to the radiometric and atmospheric conditions. The satellite data specifications used in this study was summarised in Table 1.
a b
c d
Figure 1: Landsat 7 ETM a) 21 July 2001 and b) 28 July 2015. Landsat 5 TM c) 05/08/1986 d) 31/08/2007. All the images are displayed as true colour composition (RGB= 321).
Table 1: The specification of Landsat 5 and Landsat 7 satellite imagery
2.2. Study Area
The study area is situated in Marmara region of Turkey, the border of Bogazici University Saritepe Campus near Kilyos on the Black Sea in Istanbul. The coordinates of the study area is 41o14’44.29’’N - 41o14’47.99’’N North Latitudes and 29o0’51.41’’E - 29o0’20.74’’E East Longitudes. The study area is 50 kilometers west of the straight of Istanbul. The image used in this study was
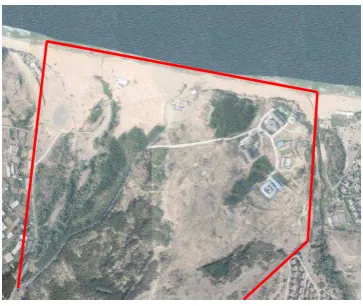
http://sehirharitasi.ibb.gov.tr/ acquisition which displays the Saritepe Campus of Bogazici University at Kilyos in Istanbul (Figure 2).
Figure 2: The Saritepe Campus in Kilyos, Istanbul Satellite Date Radiometric
Resolution
3. METHODS
In this study, two different surveying techniques were used to map the shoreline and determine the change. These techniques are post-processed kinematic GPS and pixel based classification method with remote sensing imageries.
3.1 Post-Processed Kinematic GPS
Reconnaissance is the most significant step which is used to get detail information about the study area and its vicinity. Three geodetic survey campaigns were performed in order to determine shoreline and bathymetric changes in Saritepe Campus coast. Both terrestrial and space geodetic techniques were used in this study.
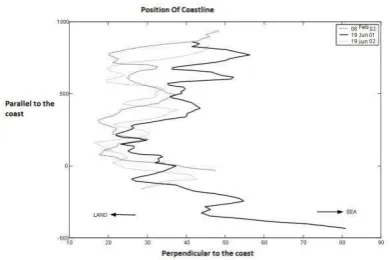
In those days, there was no CORS-TR and RTK GPS equipment. Therefore post-processed GPS technique were carried out in June 2001, February 2002 and June displays in Figure 3 (Ozener, 2004).
Figure 3: The measured shoreline between June 2001 and June 2002
3.2 Image Classification
Remote sensing imageries are the most significant component of landuse landcover (LULC) studies. The algorithms selected for landcover classification were pixel based classification which consisted of unsupervised and supervised. In unsupervised classification ISODATA (Iterative Self Organizing Data Analysis Technique) method was used. In supervised classification, minimum distance, parallelpiped and maximum likelihood classification algorithms were performed respectively. Before the pixel based
classification procedure, all Landsat data were subset the size 500*500 pixels. This is the best way to reduce misclassification and the percentage of the classification results.
Unsupervised classification is useful for imageries in which landuse/landcover are not well-known or undefined. ISODATA is an iterative and self-organizing algorithm which begins with a specified number of arbitrary clusters and repeat the process. In the minimum distance classification, the mean vector of each ROI uses and calculates the Euclidean distance from each unknown pixel to the mean vector for each class. All pixels are classified to the closest ROI class. In parallelpiped algorithm, a decision boundaries use an n-dimensional parallelpiped in the image data space. The dimensions of the parallelpiped are defined based upon a standard deviation threshold from the mean of each selected class. In supervised classification, maximum likelihood algorithm is the most commonly used one which is based on the assumption the training data statistics in each band are normally distributed (Oruc, 2007).
In the first step, unsupervised classification method was performed. ISODATA algorithm had been applied the data. As a result of the ISODATA process 5 main classes have been used as training areas for the classification procedure (Figure 4). These classes are Sea, Road & Bareearth, Urban, Coast and Vegetation.
a b
c d
Figure 4: Landsat 5 TM a) 05/08/1986 b) 31/08/2007. Landsat 7 ETM c) 21 July 2001 and d) 28 July 2015. All images are displayed as ISODATA composition.
classification display in the figures respectively. Besides, in these processes, same classes were used for the classification. However, parallelpiped classification results and accuracy assessment of this type of classification can not compansate the enough accuracy and precision. Therefore, we subtracted parallelpiped classification outputs. Figure 5, 6, 7, 8 display Landsat 5 TM (05/08/1986), Landsat 7 (21/07/2001), Landsat 5 TM (31/08/2007) and Landsat 7 (28/07/2015) imageries classification results respectively.
a b
Figure 5: Landsat 5 TM (05/08/1986) a) minimum distance classification b) maximum likelihood classification
a b
Figure 6: Landsat 7 TM (21/07/2001) a) minimum distance classification b) maximum likelihood classification
a b
Figure 7: Landsat 5 TM (31/08/2007) a) minimum distance classification b) maximum likelihood classification
a b
Figure 8: Landsat 7 TM (28/07/2015) a) minimum distance classification b) maximum likelihood classification.
3.3. Accuracy Assessment of the Classification Results In remote sensing, classification accuracy is the important way to determine the agreement between the selected reference materials and the classified data. A common method to assess accuracy is the error matrices. Error matrices compare pixels or polygons in a classified image against ground reference data (Jensen 2005). Error matrices have been used in many land classification studies. In this study, all pixel based classification methods were completed, then accuracy assessment was performed as a final stage of this research.
The method of maximum likelihood classification (MLC) is the most accurate and reliable methods of classification of satellite imagery. In Table 2, all overall accuracy and kappa coefficient was displayed.
Image/Date
Overall Accuracy
Kappa Coeffient 05.08.1986 91,4202% 0,8842
21.07.2001 73,5670% 0,6496
31.08.2007 73,3844% 0,6506
28.07.2015 78,6783% 0,7184
Table 2: All data and their overall accuracy with kappa coeffient.
Vegetation areas in which forested land and all types of vegetation make up the largest percent of the study area with 21%, 24%, 28%, 27% area in 1986, 2001, 2007 and vice versa in 2015 after the sea/water class. Vegetation area increased (15.2829 km2) slightly between 1986-2007, however, then decrease (0.6885 km2) between 2007-2015. Especially, in 2015, the third Bosphorous brigde, connecting roads and all constructions, can be observed easily on the satellite image which are associated with these changes in vegetation class.
Table 3: The area diferences for the coast between 1986-2015
Besides, coastal deformation in 1986, the total area of urban was equaled to 6.8877 km2 while in 2007 the total area of the same class was equaled to 20.5227km2. In Table 4, all classes producer and user accuracies are displayed for the MLC.
Maximum Likelihood Classification
1986 2001 2007 2015
Accuracy Accuracy Accuracy Accuracy
Class Prod User Prod User Prod User Prod User
In the supervised classification procedure, some difficulties encountered. The first one is about the spectral features of the landcover types. Some landcover types such as coast and bare earth have spectral similarities which cause a big poblem. Besides spectral similarities, shadows can cause another problem for the misclassification results. In some findings, the class of urban and coast also had similar spectral reflectance so the results lead us wrong classification.
4. CONCLUSION & DISCUSSION Coastal areas are the significant natural resources around the world. Satellite data and space geodetic techniques are powerful tools to detect the deformation in the shoreline at Saritepe Campus in Kilyos, Istanbul.
During the GPS observations, about 800 points were measured June 2001, February 2002 and June 2002 respectively. Landward movement up to 10 m is observed at shoreline from geodetic surveys. These findings are consistent with the results inferred from remote sensing image processing.
Remote sensing is the best way to reduce the cost of labor and time to develop the assessments of in which some cases are difficult to measure. Besides, satellite imageries are relatively cheap or freely available. These imageries have frequently used to detect deformation analysis. On the other hand, in the low spatial resolution images the shoreline change is difficult to be identified. Since the study area is not so large, high resolution images can be studied as next step for more precise results.
REFERENCES
Oruc, M., A.M. Marangoz, S. Karakus (2007), ‘Comparison of pixel- based and object oriented classification approaches using pan-sharped Landsat 7 ETM images’TMMOB Harita ve Kadastro Mühendileri Odası 11. Türkiye Harita Bilimsel ve Teknik Kurultayı 2 -6 Nisan 2007, Ankara (in Turkish).
Ozener, H. (2004). ‘Detection of Shoreline and Bathymetric Changes”, Sea Technology, Volume 45, Number 9, September 2004, pp. 19-22.
Gunay, T. (1987),“The Management of coastal areas. Development Perspectives, Turkey”, United Nations
Economic Commission for Europe, 14 th Session, Portugal, November 1987.
Winarso, G., Budhiman, S., (2001). The potential applicationof remote sensing data for coastal study, Proc. 22nd.Asian Conference on Remote Sensing, Singapore. Available on: http://www.crisp.nus.edu.sg/~acrs2001.
URL1: http://landsat.usgs.gov/about_landsat5.php
URL 2: http://landsat.usgs.gov/science_L7_cpf.php
URL 3: http://earthexplorer.usgs.gov/