INTER-SEASONAL DYNAMICS OF VEGETATION COVER AND SURFACE
TEMPERATURE DISTRIBUTION: A CASE STUDY OF ONDO STATE, NIGERIA.
H. A. Ibitolu1*, K. O. Ogunjobi2 1
Onidex Geospatial Solutions, No. 23, Road 2, Orita-Obele Estate, Akure, Ondo State, Nigeria.- [email protected] 2
Department of Meteorology and Climate Science, Federal University of Technology, Akure, P.M.B 704, Akure, Nigeria. – [email protected]
Commission VIII, WG VIII/8
KEY WORDS: Vegetation Cover, Ondo State, Surface Temperature, Seasonal Dynamics, LST, NDVI
ABSTRACT:
This study employs Landsat ETM+ satellite imagery to access the inter-seasonal variations of Surface Temperature and Vegetation cover in Ondo State in 2013. Also, air temperature data for year 2013 acquired from 3 synoptic meteorological stations across the state were analyzed. The Single-channel Algorithm was used to extract the surface temperature maps from the digital number embedded within the individual pixel. To understand the spatio-temporal distribution of LST and vegetation across the various landuse types, 200 sample points were randomly chosen, so that each land-use covers 40 points. Imagery for the raining season where unavailable because of the intense cloud cover. Result showed that the lowest air temperature of 20.9OC was in January, while the highest air temperature of 34OC occurred in January and March. There was a significant shift in the vegetation greenness over Ondo State, as average NDVI tend to increase from a weak positive value (0.189) to a moderate value (0.419). The LULC map revealed that vegetation cover occupied the largest are a (65%) followed by Built-up(26%), Swampy land(4%), Rock outcrop(3%) and water bodies(2%). The surface temperature maps revealed that January has the lowest temperature of 10OC experienced in the coastal riverine areas of Ilaje and Igbokoda, while the highest temperature of 39OC observed in September is experienced on the rocky grounds. The study also showed the existence of pockets of Urban Heat Islands (UHI) that are well scattered all over the state. This finding proves the capability and reliability of Satellite remote sensing for environmental studies.
1. INTRODUCTION
Temperature plays a vital role in determining the conditions in which living organisms can exist. The issue of climate change due to consistent global warming has increasingly become a major social, economic and environmental concern to most countries of the world, especially those within the tropical region, where the impact is likely to be felt mostly. Recent estimates indicate that over 45% of the world’s human population now lives in urban areas, with over 60% projected by 2030 (United Nations, 1997). The global rate of urbanization is expected to continue to accelerate in the near future, with the emergence of large urban agglomerations in developing countries (Berry, 1990).However, (Xu and Cheng (2004), defined urbanization as the removal of natural land cover and the introduction of urban materials in form of clearance of natural vegetation; reclamation of swampy areas; construction of buildings, roads, and other concrete surfaces like parks and pools.
According to the Intergovernmental Panel on Climate Change Third Assessment Report (IPCC, 2001) global average surface temperature is projected to increase by 1.4 to 5.8°C over the period 1990 to 2100. Urban microclimate studies of tropical regions are still rare, the few research done in Nigeria have used mean monthly climatological data or 2 to 3 hourly interval short term manual measurements (Adebayo, 1991; Balogun et al., 2009a). However, most of the research works related to how _________________________
*Corresponding author
temperature changes seasonally in Nigeria have been based on ambient air temperature analysis and not on Near Surface Temperature analysis. The use of ambient air temperature data is expensive, time consuming and leads to problems in spatial interpolation. Whereas, the use of satellite thermal infrared remotely sensed data provides a synoptic and uniform means of studying Surface Temperature and vegetation at regional scales.
Land surface temperature (LST) is an indicator for measuring urban heat islands (UHIs) (Voogt and Oke, 2003). The surface temperature of an urban area is influenced by many factors like the length of day, season, wind, ocean currents, clouds, topography, location, rural surroundings, land use, building material and city geometry (Valsson, 2009 and Lo, 2003). Approaches to urban thermal environment range from gathering data through fixed locations, mobile sampling of air through vehicles and much recently, the application of various remote sensing platforms (Yue et al., 2007; Stone et al., 2001; Hung et al., 2006).
and found that differences in NDVI and satellite-based surface temperature accounted for 40% of the variation in urban–rural temperature differences.
In recent time the integration of latest techniques of Remote Sensing coupled with Geographic Information System (GIS) has proven to be an extremely useful approach for the study of seasonal variation of surface temperature, due to the synoptic and repetitive data coverage, high resolution, multispectral database and its cost effectiveness in comparison with conventional techniques. The present study which is motivated by the above statement aims to employ multi-temporal satellite images of Landsat 7 ETM+ to investigate the inter-seasonal variation of vegetation cover and Land Surface Temperature (LST) across the various Land-use/Land-cover types in Ondo State, Nigeria during the year 2013.
1.1 Study Area
The area lies in the south-western region of Nigeria, on the Atlantic coast in the Gulf of guinea. It is located between latitudes 5° 50' 5.128''N and 7°47' 34.141''N and longitudes 4°20' 34.82''E and 6° 4' 6.421''E. (Figure 1). It has a land mass of approximately 15,500 square kilometers. The Climate falls under the tropical savanna climate (koppen climate classification) that is similar to that of the rest of southern Nigeria. Its seasons are governed majorly by the movement of the Intertropical discontinuity (ITD). There are two rainy seasons, with the heaviest rains falling from March to July and a weaker rainy season in September to November. There is a brief relatively dry spell in July/August and a longer dry season from December to February. Monthly rainfall between May and July over 400mm, while in August and September it is down to 200mm and in December as low as 25mm. The main dry season is accompanied by Harmattan winds from the Sahara Desert, which between and early February can be quite strong. It comprises of three ecological zones namely: Mangrove, Swamp Forest and Tropical forest.
Figure 1. Study site location (red polygon) in the south-west of Nigeria (black polygon in the map). In the right map, the Administrative boundary of the study area on a mosaicked Landsat 7 ETM+ (path/row-189/055, 190/055, 190/056, composition RGB-543
2. METHODOLOGY
2.1 Dataset Used
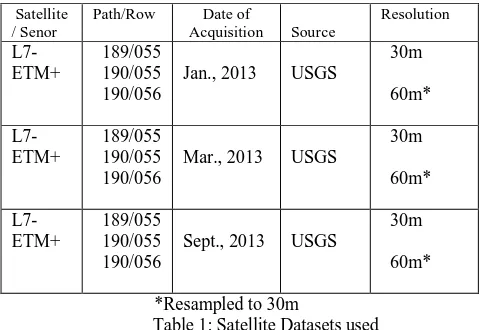
The dataset used for this study were derived from two different datasets namely: Satellite (Landsat) datasets and Ground-based dataset. Landsat 7 ETM+ satellite images across the different seasons of Ondo state were acquired for 2013. However, it should be noted that wet season (summer) months for Landsat 7 ETM+ were unavailable; this is because of the intense cloud cover which hinders accurate measurement of the satellite sensor. All Landsat images used were made available and downloaded freely from the United State Geological Survey (USGS), Earth-explorer website (earthexplorer.usgs.gov). It overpasses Nigeria at local time of approximately 09:40 am. Table 1 shows the summary of all satellite data used.
Landsat 7 satellite series has a swath width of about 185 km x 185km. The study area covers more than one Instantaneous Field of View (IFOV) of Landsat scene. Hence, three different paths and rows were required for each season observed (Figure 2). It is also important to state that Ondo State and its environs was carved out using the local government boundary map and Nigerian Administrative map shape-file which were collected from the Nigerian National Space Research and Development
Agency (NASRDA). These were brought to UTM Projection in Zone 32.
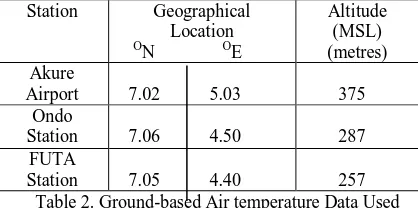
were used for this study. Scarcity of adequate meteorological station in the Nigeria is one of the challenges faced by researchers in Nigeria. However, the data for Ondo town and Akure airport were both acquired from the Nigerian Meteorological Agency (NIMET), while that of FUTA was collected from the Department of meteorology, Federal University of Technology, Akure. (Table 2).
Station Geographical Table 2. Ground-based Air temperature Data Used
Consequently, ArcGIS 10 and ERDAS Imagine were used for this study. ArcMap was used for the Vectorization and also for performing mosaicking of all the different seasonal images. While Arc-Catalogue was used in creating a personal geo-database and shape-files used in performing the overlay. In order to extract LST from the Thermal Infrared (TIR) sensor of ETM+, the atmospheric transmittance, downwelling radiance and upwelling radiance parameters were taking into account. Also, the focal Analysis functionality of ERDAS Imagine was used in removing (de-striping) the strips on the Imageries which is as a result of the failure of the SLC (Scan Line Corrector). The filters were applied six times to each image and filled the gaps using the information of the neighboring pixels.
2.2 Data Process and analysis
The Normalized Difference Vegetation Index (NDVI) for each seasonal image used was generated using ERDAS Imagine, relating the Near-Infrared Band (Band 4) and Red Band (Band 3) of ETM+ (Teillet et al., 2001)
(1)
More so, the selected images underwent a supervised classification of Land Use Land CoverLULC using the operator maximum likelihood to differentiate five categories:
*Vegetation – grasses, shrubs *Water Bodies – rivers, streams
*Built-up Lands – houses, tarred roads, settlements *Swamp Areas numbers (DN) using standard NASA equations to correct gain and offset at the detector. In TM and ETM+, band 6 captures DN = Quantized calibrated pixel value (Qcal)
QCALMIN = Minimum quantized calibrated pixel value corresponding to LMIN [DN] = 1
QCALMAX = Maximum quantized calibrated pixel value corresponding to LMAX [DN] = 255
LMIN= Spectral at-sensor radiance that is scaled to Qcalmin (W/m2* sr * m) variable. This is the effectiveness at-satellite (Top-of-Atmosphere) temperatures of the viewed Earth-atmosphere. However, with the help of the ACPC- Atmospheric Correction Parameter Calculator (freely accessible web-based MODTRAN interface), the atmospheric transmittance, and upwelling radiance and downwelling radiance were acquired. Assuming surface emissivity = 1 (USGS, 2011), the
Table 3: Landsat TM and ETM+ thermal band calibration constants. Source: USGS, 2011.
2.2.3 Conversion of Temperature in Kelvin to Temperature in Celsius: The temperature in Celsius was calculated as the following equation:
T ( oC ) = T – 273.13 (4)
2.3 Analysis of spatio-temporal variation of LST across different
LULC
Figure 3: The Location of sample sites for the analysis of surface temperature across various LULC over Ondo State in the different
In order to establish the relationship between LST and corresponding land use/cover type, 200 sample points were selected randomly from different land use/cover types in the study area (Figure 3). Based on the Land use map generated earlier 40 samples were selected from each land use/cover types. The average temperature of each land use/cover category for each season was calculated using the formula of simple arithmetic mean. The range of temperature was also estimated by calculating the difference of highest and lowest temperature of respective land use land.
3. RESULTS AND DISCUSSIONS
3.1 Seasonal Air Temperature Distribution
The Daily Air Temperature acquired from NIMET averaged into monthly minimum, maximum and mean temperature were shown in table 4. From table 4, it can be seen that the lowest air temperature observed (20.9OC) was in January, while the highest air temperature of 34OC was observed in both January and March. However, the lowest averaged temperature (25.5OC) was experienced in September, while the month of March experienced the warmest air temperature (28.6OC).Furthermore, the cool average temperature experienced in September could be attributed to the abundant of rainfall during this time of the year.
Months Air Temperature (OC) Min Mean Max January 20.9 27.4 34.0
March 23.4 28.6 34.0 September 21.9 25.5 29.1
Table 4. Summary of Air Temperature Analysis for the different Months
3.2 Land Use / Land Cover Distribution
Figure 4. Land Use / Land Cover Map of Ondo State in 2013.
Based on the result of the supervised classification carried out, Fig 4 shows the Land Use Land Cover map for Ondo State in 2013The general understanding of land use/cover information has been derived from visual inspection of tone and color of satellite image of study area (Figure 4) and Google Earth. It can be observed that majority of the land mass is covered with vegetation, however, there exist some noticeable pockets of settlements scattered throughout the state. Also noticeable are the existence of some rock outcrop. These Rocky bodies are sometimes weathered in quarries into smaller particle and are used as gravel in building of houses, bridges etc. In addition, the Atlantic Ocean boarding Ondo state to the south contribute to the existence of large water body and swampy land in the riverine Ilaje and Igbokoda local government area of the state. However, this serve as the source of livelihood for the locals, since the river serve as fishing ground while the swampy area is used for planting agricultural product.
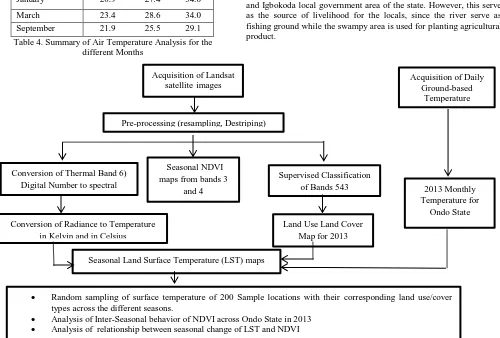
Figure 5: Methodology Framework for the Research Acquisition of Landsat
satellite images
Pre-processing (resampling, Destriping)
Conversion of Thermal Band 6) Digital Number to spectral
Seasonal Land Surface Temperature (LST) maps Conversion of Radiance to Temperature
in Kelvin and in Celsius
2013 Monthly Temperature for
Ondo State Acquisition of Daily
Ground-based Temperature
Seasonal NDVI
maps from bands 3and 4
Supervised Classification of Bands 543
Land Use Land Cover Map for 2013
Random sampling of surface temperature of 200 Sample locations with their corresponding land use/cover types across the different seasons.
3.3 Seasonal Characteristics of Normalized Difference Vegetative Index (NDVI)
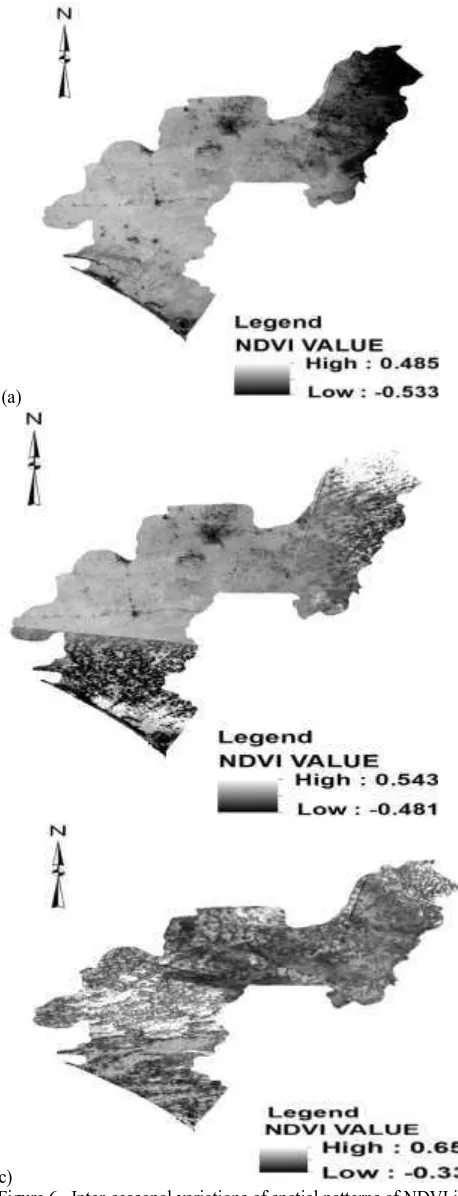
The Normalized Difference Vegetative Index (NDVI) is commonly used as a measure of land surface greenness based on the assumption that NDVI value is positively proportional to the amount of green vegetation in an image pixel area. Figures 6(a, b and c) shows the inter-seasonal variation of spatial pattern of NDVI in Ondo State.
From Figures 7 and Table 5 which shows a summary of the NDVI values measured over Ondo State across the different seasons. The overall trend shows a significant increase in the mean NDVI values from 0.189 to 0.419, as we move across the seasons. However, this could be attributed to the change in the weather pattern from a relatively dry month (January) to the rainy month (September). Since the greenness of vegetation is dependent on the availability of rainfall. The strong negative NDVI (-0.533) observed in January is as a result of the dryness experienced during that period.
January March September
Min -0.533 -0.481 -0.338
Max 0.485 0.543 0.651
Mean 0.189 0.213 0.419 Std.
Dev.
0.138 0.076 0.132
Table 5: Summary of NDVI during the three months observed
Figure 7: Bar Chart Distribution of NDVI during January, March and September 2013.
(a)
(b)
(c)
Figure 6. Inter-seasonal variations of spatial patterns of NDVI in Ondo state: (a) January; (b) March; and (c) September.
-0.6
-0.4
-0.2
0
0.2
0.4
0.6
0.8
N
D
V
I
V
a
lu
e
s
Months
MIN
MEAN
3.4 Seasonal Characteristics of Surface Temperature across various Land Use Types
The season wise changes of spatial patterns of surface temperature are researched in relation to various land use/cover patterns through the surface temperature maps (Figure 8) extracted from the thermal band (Band 6) of Landsat ETM+ 7 images for the seasons studied.
The season-wise spatial distribution of surface temperature suggests that January been a representative of the Harmattan season and the coldest month of the year, registered the lowest surface temperature. The highest and lowest temperatures observed in Harmattan (January) are 10 °C and 34 °C, respectively. The lowest temperature 10°C has been observed in the southern region of the study area, which is boarded with
the Atlantic Ocean. The Intertropical Discontinuity (ITD) modulates the seasons of Nigeria. However, by January the ITD is at its southernmost position (7ON) which then allows the influx of cold and dry air that then influences the surface temperature. The highest temperatures (34 °C) of the season are seen in the Rocky parts of Ondo State. This is because of the low heat capacity of rocks that allows heat from the sun to be given off as soon as the sunrise heats the surface (Figure 8a).
More so, by March, the lowest temperatures recorded has increased to 13°C while the highest temperature remained the same as 34 °C (Figure 8b). The details of highest and lowest temperatures associated with each land use/cover types are mentioned in Table 6.
By June/July, the ITD would have retired to its northernmost position (21°N). Hence by September, there would be the influx of warm and moist air from the Atlantic Ocean thereby causing sufficient rainfall.
Land use/cover
Area (%)
Samples (No)
January Min Max
March Min Max
September Min Max
Water Bodies 1.40 40 10 21 13 21 15 26
Vegetation 65.28 40 15 25 18 29 20 30
Built-up Land 26.12 40 20 31 23 33 25 35
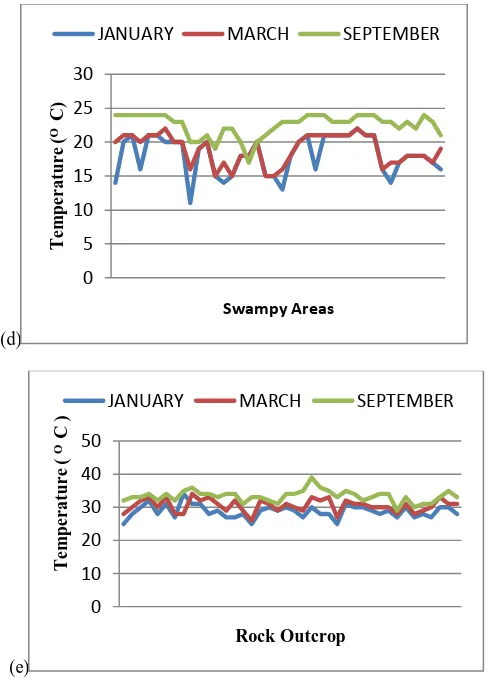
Swampy Area 3.90 40 11 22 15 22 17 24
Rock Outcrop 3.30 40 25 34 26 34 29 39
Table 6: Details of Land use/cover, number of temperature samples taken from land use/cover and season wise maximum and minimum average temperature (OC).
(a) (b)
(c)
On the basis of analysis of 200 samples points selected for all the seasons, it is found that the overall average surface temperature is lowest in January and highest in September (Table 7). During Harmattan, the lowest average temperature is observed for water bodies and swamp land, moderate temperature for vegetation, built-up and rock. More so, in March, a relatively higher average temperature is recorded for all land use categories. However, analysis of average
Figure 9: Inter-seasonal variation of surface temperature across land use/cover categories: (a) water bodies (b) vegetation; (c) built-up land;
(d) swampy area; (e) rock outcrop.
Land use/cover January March September Water Bodies 16 19 24
Vegetation 22 24 26 Built-up Land 28 30 31 Swampy Area 18 20 23 Rock Outcrop 29 30 34
Table 7: Season-wise average temperature across the land use/cover types.
3.5 Relationship between changes in surface temperature and vegetation
From the result of the analysis of NDVI and LST carried out, it was observed that, as the NDVI values increases from negative towards the positive region, there tends to be a significant increase in the overall average surface temperature as one move from a cooler and dry weather into a warmer and wetter weather system.
4. CONCLUSION
The result revealed that the lowest air temperature observed (20.9OC) occurred in January, while the highest air temperature (34OC) occurred in January and March. September experienced average temperature of about 25.5OC. More so, there was a significant shift in the vegetation greenness of Ondo State as average NDVI values tend to increase from a weak positive value (0.189) to a moderate value (0.419). This is largely due to the gradual shift from a relatively dry Harmattan season to wet season which is accompanied by abundant rainfall. Furthermore, the LULC map showed that vegetation cover occupied the largest area (about 65%) followed by Built-up area (26%), Swampy land (4%) the Rock outcrop (3%) and water bodies (2%). In addition, the surface temperature maps revealed that January has the lowest temperature of about 10OC which is experienced in the coastal riverine areas of Ilaje and Igbokoda, while the highest temperature ( 39OC ) which occurs in September is experienced on the rocky grounds that are scattered throughout the state. Also, showed are the Urban Heat Islands (UHI) that are well scattered all over the state in areas were built-up lands are significantly noticed.
The result of this finding has shown that satellite remote sensing could be a useful and appreciable tool that can be employed to the study of weather changes at global, regional and micro-scale level. This is because satellite Technology is usually accompanied with multi-resolution, multi-temporal and high spatial capabilities which make it relatively preferable to conventional method of weather study. However, the problem of intense cloud cover could pose serious problem to satellites with passive sensors like the Landsat series, although radar systems like RADARSAT could be employed in severe weather conditions.
ACKNOWLEDGEMENTS
The Authors would like to thank the United States Geological Survey (USGS) for the free distribution of the satellite data that was used in this study. Also we would like to appreciate the Nigerian Meteorological Agency (NIMET) and the Department of Meteorology of the Federal University of Technology, Akure (FUTA) for the provision of the air temperature data which was useful in this research.
REFERENCES
Adebayo YR (1991). Heat island in a humid tropical city and its relationship with potential evaporation. Theor. Appl. Climatol., 43(3): 17-30.
Balogun AA, Balogun IA, Adefisan AE, Abatan AA (2009a). Observed characteristics of the urban heat island during the harmattan and monsoon in Akure, Nigeria. Eight Conference on the Urban Environment. AMS 89th Annual Meeting, 11 – 15 January, 2009, Phoenix, AZ. Paper JP4.6, http://ams.confex.com/ams/pdf papers/152809.pdf
Berry, B.L., 1990, Urbanization. In The earth as transformed by human action, B.J. Turner II, W.C. Clark, R.W. Kates (eds), pp. 103– 119 (Cambridge: Cambridge University Press).
Gallo, K. P., McNab, A. L., Karl, T. R., Brown, J. F., Hood, J. J., & Tarpley, J. D. (1993). The use of NOAA AVHRR data for assessment of the urban heat island effect. Journal of Applied Meteorology, 32, 899– 908.
Gallo, K. P., & Owen, T. W. (1998). Assessment of urban heat island: A multi-sensor perspective for the Dallas-Ft. Worth, USA region. Geocarto International, 13, 35– 41.
Hung, T.; Uchihama, D.; Ochi, S.; Yasuoka, Y. Assessment with satellite data of the urban heat island effects in Asian mega cities. Int. J. Appl. Earth Obs. Geoinf. 2006, 8, 34–48.
Owen, T. W., Carlson, T. N., & Gillies, R. R. (1998). An assessment of satellite remotely-sensed landcover parameters in quantitatively describing the climatic effect of urbanization. International Journal of Remote Sensing, 19, 1663–1681.
Stone, B.; Rodgers, M.O. Urban form and thermal efficiency: How the design of cities influences the urban heat island effect. J. Am. Plan. Assoc. 2001, 67, 186–198.
Teillet, P., Barker, J., Markham, B., Irish, R., Fedosejevs, G., Storey, J., 2001. Radiometric cross calibration of the Landsat-7 ETM+ and Landsatt-5 TM sensors based on tandem data sets. Remote Sensing of Environment, 78, 39–54.
United Nations, 1997, Prospects for urbanization. ST/ESA/SER.A/166, Sales No. E.97.XIII.3.
USGS., 2011. Landsat 7 Science Data User’s Handbook. http://landsathandbook.gsfc.nasa.gov/data_prod/prog_sect11_3.html. (accessed on 11 /10/2013).
Valsson, S.; Bharat, A. Urban Heat Island: Cause for Microclimate Variations. Architecture-Time Space & People, April 2009, 21–25.