Journal of Experimental Marine Biology and Ecology 250 (2000) 169–205
www.elsevier.nl / locate / jembe
Overview of the physiological ecology of carbon metabolism
in seagrasses
*
Brant W. Touchette , JoAnn M. Burkholder
Department of Botany Box7510, North Carolina State University, Raleigh, NC 27695-7510, USA
Abstract
The small but diverse group of angiosperms known as seagrasses form submersed meadow communities that are among the most productive on earth. Seagrasses are frequently light-limited and, despite access to carbon-rich seawaters, they may also sustain periodic internal carbon limitation. They have been regarded as C3 plants, but many species appear to be C3–C4 intermediates and / or have various carbon-concentrating mechanisms to aid the Rubisco enzyme in carbon acquisition. Photorespiration can occur as a C loss process that may protect photosynthetic electron transport during periods of low CO availability and high light intensity. Seagrasses can2
22 21
also become photoinhibited in high light (generally.1000 mE m s ) as a protective mechanism that allows excessive light energy to be dissipated as heat. Many photosynthesis– irradiance curves have been developed to assess light levels needed for seagrass growth. However, most available data (e.g. compensation irradiance I ) do not account for belowground tissuec
respiration and, thus, are of limited use in assessing the whole-plant carbon balance across light gradients. Caution is recommended in use of I (saturating irradiance for photosynthesis), sincek
seagrass photosynthesis commonly increases under higher light intensities than I ; and ink estimating seagrass productivity from Hsat (duration of daily light period when light equals or exceeds I ) which varies considerably among species and sites, and which fails to account fork light-limited photosynthesis at light levels less than I . The dominant storage carbohydrate ink
seagrasses is sucrose (primarily stored in rhizomes), which generally forms more than 90% of the total soluble carbohydrate pool. Seagrasses with high I levels (suggesting lower efficiency in Cc
acquisition) have relatively low levels of leaf carbohydrates. Sucrose-P synthase (SPS, involved in sucrose synthesis) activity increases with leaf age, consistent with leaf maturation from carbon sink to source. Unlike terrestrial plants, SPS apparently is not light-activated, and is positively influenced by increasing temperature and salinity. This response may indicate an osmotic adjustment in marine angiosperms, analogous to increased SPS activity as a cryoprotectant response in terrestrial non-halophytic plants. Sucrose synthase (SS, involved in sucrose metabo-lism and degradation in sink tissues) of both above- and belowground tissues decreases with tissue age. In belowground tissues, SS activity increases under low oxygen availability and with increasing temperatures, likely indicating increased metabolic carbohydrate demand. Respiration
*Corresponding author. Tel.:11-919-515-2726; fax:11-919-513-3194. E-mail address: joann [email protected] (B.W. Touchette).]
170 B.W. Touchette, J.M. Burkholder / J. Exp. Mar. Biol. Ecol. 250 (2000) 169 –205
in seagrasses is primarily influenced by temperature and, in belowground tissues, by oxygen availability. Aboveground tissues (involved in C assimilation and other energy-costly processes) generally have higher respiration rates than belowground (mostly storage) tissues. Respiration rates increase with increasing temperature (in excess of 408C) and increasing water-column nitrate enrichment (Z. marina), which may help to supply the energy and carbon needed to assimilate and reduce nitrate. Seagrasses translocate oxygen from photosynthesizing leaves to belowground tissues for aerobic respiration. During darkness or extended periods of low light, belowground tissues can sustain extended anerobiosis. Documented alternate fermentation pathways have yielded high alanine, a metabolic ‘strategy’ that would depress production of the more toxic product ethanol, while conserving carbon skeletons and assimilated nitrogen. In comparison to the wealth of information available for terrestrial plants, little is known about the physiological ecology of seagrasses in carbon acquisition and metabolism. Many aspects of their carbon metabolism — controls by interactive environmental factors; and the role of carbon metabolism in salt tolerance, growth under resource-limited conditions, and survival through periods of dormancy — remain to be resolved as directions in future research. Such research will strengthen the understanding needed to improve management and protection of these environmentally important marine angiosperms. 2000 Elsevier Science B.V. All rights reserved.
Keywords: Carbon; Light; Photosynthesis; Respiration; Seagrass; Temperature
1. Introduction
Seagrasses are a small but diverse group of mostly submersed marine angiosperms which inhabit environments that are characterized by periodic light limitation. These monocots are taxonomically restricted to two families, 12 genera, and 55 species (here, including the species Ruppia maritima), all of which have evolved from land pre-decessors that returned to the sea approximately 100 million years ago during the Cretaceous (McRoy and Helfferich, 1977; Larkum and den Hartog, 1989). Few angiosperms have evolved the osmoregulatory capacity to exist in marine waters. Nevertheless, the high productivity of seagrass meadows, sometimes exceeding 15 g C
22 21
m d , places them among the most productive of all marine ecosystems (Phillips and McRoy, 1980; Hillman et al., 1989). Seagrass meadows provide both habitat and a nutritional base for finfish, shellfish, waterfowl, and herbivorous mammals (Klumpp et
˜
al., 1989; Phillips and Menez, 1998). Seagrass meadows also function in stabilizing bottom sediments and clearing the water of suspended sediments and nutrients (Terrados and Duarte, 2000).
B.W. Touchette, J.M. Burkholder / J. Exp. Mar. Biol. Ecol. 250 (2000) 169 –205 171
Since the sediments typically provide high supplies of most nutrients, with the water column as a secondary source (Short and McRoy, 1984; Harlin, 1993), seagrasses generally are not primarily nutrient-limited (Zimmerman et al., 1987). However, seagrasses obtain their carbon supply from the water rather than the sediments (Sand-Jensen, 1977). Since carbon dioxide diffuses through water |10 000-fold more slowly
than through air (Stumm and Morgan, 1996), carbon acquisition is more difficult for submersed plants. Whereas there is a wealth of information about the ecology of seagrasses under varying light regimes, there has been no effort to present an overview and conceptual framework about carbon uptake and metabolism in seagrasses from physiological and ecological perspectives. Here, we synthesize available information on the interplay between carbon and light in the carbon metabolism of this ecologically important group of aquatic angiosperms.
2. Seagrass photosynthesis
2.1. Basic photosynthetic characteristics
Investigations into the basic photosynthetic processes in seagrasses (for example, photosystem II studies using pulsed amplitude-modulated [PAM] fluorometry) suggest that seagrasses have the basic photosynthetic biochemistry reported for other angios-perms (Goodwin and Mercer, 1983; Beer et al., 1998). The pigment composition in seagrasses is similar to that of most angiosperms and includes chlorophylls a and b which function directly in photosynthesis, and carotenoids which assist in ultraviolet light and excess oxygen absorption, and in other protective roles (Beer and Waisel, 1979; Beer, 1998). Within the chloroplast, the chlorophylls absorb light for photo-synthesis, with excitation energy transferred from one pigment molecule to another by a
¨
nonradiative process referred to as resonance or Forster transfer. The antenna system is highly varied among photosynthetic organisms, but the central reaction site (chloro-phyll–protein complex; P680 and P700) is highly conserved (Wales et al., 1989). Four independent protein complexes that reside within the thylakoid membrane carry out the majority of the chemical processes that occur in the light reactions, including photo-system II, cytochrome b6-f complex, photophoto-system I, and an ATP synthase (Taiz and Zeiger, 1991).
172 B.W. Touchette, J.M. Burkholder / J. Exp. Mar. Biol. Ecol. 250 (2000) 169 –205 21 21
Zostera marina (2.62 and 1.97mmol CO min2 mg chl, respectively) are comparable to those reported for submersed freshwater angiosperms (21 species; mean |2.3 mmol
21 21
CO min2 mg chl), and for marine green and brown macroalgae (six chlorophyte and
21 21
pheophyte species; mean |2.5 and 2.4 mmol CO2 min mg chl , respectively).
However, Rubisco activities in seagrasses are lower than those reported for marine red macroalgae and freshwater emergent angiosperms (three rhodophyte species and six
21 21
emergent angiosperm species; 8.6 and 7.4 mmol CO2 min mg chl ; Beer et al., 1991).
2.2. Photorespiration
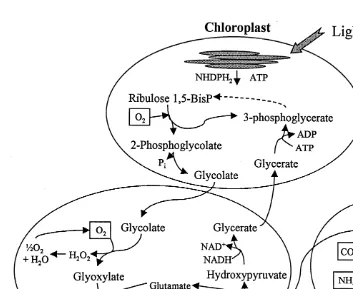
Rubisco can function as an oxygenase rather than a carboxylase, to oxygenate ribulose 1,5-bisphosphate in a carbon dioxide-releasing or carbon loss process that directly opposes photosynthesis (Lorimer, 1981). Photorespiration, also called the C2 cycle (wherein the products of oxygenation include one PGA molecule and one 2-carbon molecule, 2-phosphoglycolate), involves three types of organelles (chloroplasts, mito-chondria, and peroxisomes; Fig. 1). In this process, O2 is consumed and inorganic phosphate (P ) and COi 2 are released, as well as byproducts such as peroxide and ammonia. The oxygenase function of Rubisco is favored under increasing oxygen levels, increasing temperatures, and high light (Taiz and Zeiger, 1991). In the Cretaceous
˜
period when seagrasses first appeared in the fossil record (Phillips and Menez, 1988), C losses from photorespiration were likely to be minimal because atmospheric CO / O2 2
ratios were much higher (Ivany et al., 1991; Kuypers et al., 1999). For plants under present conditions, photorespiration is considered a wasteful process, and its functional benefits remain unclear. However, the process may benefit contemporary seagrasses as a mechanism to remove excess products of the light reactions (i.e., ATP and NADPH), and / or to protect photosynthetic electron transport from photoinactivation, thereby limiting damage to the photosynthetic apparatus during periods of low CO availability2
and high light intensity (Heber et al., 1996).
Rates of photorespiration activity are considerably lower in most submersed aquatic plants than in terrestrial plants (Abel and Drew, 1989; Beer et al., 1991; Frost-Christensen and Sand-Jensen, 1992), although the process is more difficult to measure accurately in aquatic plants because of confounding effects of gas accumulation in the lacunae, and other factors (Abel and Drew, 1989). Environmental conditions such as current velocity and reduced light intensity would tend to favor Rubisco as a carboxylase rather than as oxygenase because these conditions decrease the potential for oxygen accumulation during photosynthesis (Frost-Christensen and Sand-Jensen, 1992). More-over, in marine waters many photosynthetic organisms (including some seagrasses) use bicarbonate as an additional inorganic carbon (C ) source, and some also have developedi
various mechanisms to concentrate relatively high levels of CO around Rubisco active2
sites (somewhat analogous to C4 photosynthesis; Bidwell and McLachlan, 1985; Raven, 1985; Beer et al., 1990; Beer et al., 1991; Madsen et al., 1993). However, not all
2
seagrasses utilize HCO , and those that do are typically less efficient than macroalgae3
and cyanobacteria (blue-green algae; Beer et al., 1991).
B.W. Touchette, J.M. Burkholder / J. Exp. Mar. Biol. Ecol. 250 (2000) 169 –205 173
Fig. 1. Three organelles involved in photorespiration. This C2 process is initiated when the oxygenase component of Rubisco oxidizes ribulose-1,5-bisphosphate to produce 3-phosphoglycerate and a 2-carbon compound, 2-phosphoglycolate. The bulk of this pathway is dedicated to the energy-costly conservation of the 2C product, and requires both ATP and NADH (modified from Taiz and Zeiger, 1991).
and / or photosynthesis inhibition, under increasing oxygen regimes during light periods in seagrasses Cymodocearotundata, Halophila ovata, and Posidonia australis (Hough,
14
1976; Donton et al., 1976). Pulse-chase experiments with C showed increased labeling of photorespiratory intermediates glycolate, glycine, and serine during elevated oxygen conditions in seagrasses H. ovata and Thalassia hemprichii (Burris et al., 1976; Andrews and Abel, 1979). Studies using PAM fluorimetry to evaluate photosynthetic rates also have shown curvilinear relationships between estimated fluorometric photo-synthesis and O -evolving photophoto-synthesis. For example, in Halophila stipulacea and2
Zostera marina during high irradiance, the rate of O release decreased relative to the2
rate of electron transport in PSII (Beer et al., 1998). This deviation from linearity was believed to indicate photorespiration. A curivelinear response was not observed in
Cymodocea nodosa, however, suggesting that photorespiration did not occur under
174 B.W. Touchette, J.M. Burkholder / J. Exp. Mar. Biol. Ecol. 250 (2000) 169 –205
2.3. Carbon concentrating mechanisms
Many plants apparently have evolved mechanisms to increase the CO / O ratio near2 2
active C-fixation sites of the Rubisco enzyme. Such mechanisms would enhance carbon fixation in environments where CO diffusion is slow (e.g., submersed habitats), while2
also depressing wasteful photorespiration. Known carbon concentrating mechanisms include C4 photosynthesis (with Crassulacean acid metabolism [CAM] as a
modi-2 2
fication), CO / HCO2 3 pumps, and HCO3 dehydration (catalyzed by enzymes such as carbonic anhydrase; Eighmy et al., 1991; Funke et al., 1997).
C4 plants actually have C4 followed immediately by C3 metabolism; however, the initial product of carbon assimilation is a 4-C acid, oxaloacetate (OAA). Typically, the process of carbon fixation to a 4-C product is spatially separated from C3 metabolism. For example, in terrestrial plants possessing Kranz anatomy (e.g., corn), carbon fixation occurs in leaf mesophyll cells wherein phosphoenol pyruvate (PEP) is carboxylated by the enzyme PEP carboxylase (Goodwin and Mercer, 1983). The 4-C product, OAA, is converted to malate or aspartate, and then transported to bundle sheath cells where decarboxylation occurs, generating a 3-carbon product (alanine, pyruvate, or PEP, transported back to the mesophyll cells) and high concentrations of CO which depress2
the oxygenase (photorespiratory) function of Rubisco. The resulting CO2 is then reassimilated to form two 3-PGA molecules via typical Rubisco / C3 reactions.
In seagrasses as in other aquatic angiosperms, the distinction between C3 and C4 metabolism is not always clear, and some species behave as C3–C4 intermediates (Bowes et al., 1978; Beer et al., 1980; Beer and Wetzel, 1981; Waghmode and Joshi, 1983). For example, Frost-Christensen and Sand-Jensen (1992) determined the photo-synthetic quantum efficiency (fa, as O evolution per unit of absorbed photons under2
light-limited photosynthesis) for submersed angiosperms including the seagrass, Zostera
marina. They reported that thefa values more closely resembled those for terrestrial C4 than C3 plants. In other investigations, direct measurements of photosynthetic products
13
and / or d C values indicated that, Cymodocea nodosa and Thalassia testudinum were C4 plants, whereas Thalassia hemprichii, Thalassodendron ciliatum, Halophila
spinul-osa, Halodule uninervis and Syringodium isolifolium were C3 plants (Benedict and
Scott, 1976; Andrews and Abel, 1979; Beer and Waisel, 1979; Beer et al., 1980). This
13 13
d C-derived classification is based on studies involving terrestrial plants, whereind C values were typically ca.228 for C3 plants, and214 for C4 species. In seagrasses the
13
d C values are at ca. 211, suggesting that these plants more closely resemble C4 terrestrial species (Smith and Epstein, 1971; McMillan et al., 1980; but see Abel and
13
Drew, 1989). Interpretations about C4 status from d C data should be made with caution, since the values observed may reflect other features of the aquatic plants and their habitat (e.g., C limitation with slower diffusion from higher viscosity of water than air, thicker boundary layers, and lacunar oxygen storage) rather than an actual C4 carbon fixation system (Benedict and Scott, 1976; O’Leary, 1988; Abel and Drew, 1989; Durako, 1993).
14
Other investigations using C and / or less direct inferences have indicated contrasting C3 / C4 metabolism in seagrasses. For example, Benedict et al. (1980) concluded that T.
B.W. Touchette, J.M. Burkholder / J. Exp. Mar. Biol. Ecol. 250 (2000) 169 –205 175 14
contrast, in Cymodocea nodosa nearly 50% of added C label was found in malatei
after a 5-s pulse, indicating C4 metabolism (Beer et al., 1980). Zostera noltii may also have C4-like metabolism, based on lack of observable photorespiration as well as high
´
light saturation values (Raven, 1984; Jimenez et al., 1987). In Halophila stipulacea, an
14
initial increase of C-malate and other organic acids was reported following addition of
14
C label; but subsequent decline in labeled malate did not occur with increased chasei
time as would be expected in C4 plants, suggesting that this seagrass may be a C3–C4 intermediate (Beer et al., 1980). Based on the activities of C4 enzymes PEP-carboxylase
14
and aspartate aminotransferase, as well as C-labeled C4 products aspartate and alanine, Waghmode and Joshi (1983) concluded that Halophila beccaeii may also fix C via ai
C4-like pathway under certain conditions.
Although various investigations indicate that C4 metabolism may occur in some seagrasses, and that this process may be induced under certain environmental conditions, it has not been widely accepted. Those scientists who do not accept the premise of C4 metabolism in seagrasses cite the general uncertainty in interpreting unexpected results (as in C3–C4 intermediates), uncertainties as to whether assumptions about metabolic similarities hold between terrestrial plants and seagrasses, and / or uncertainties about the validity of interpretations from indirect approaches wherein assessment of C4 metabo-lism was not the original focus of the research (Abel and Drew, 1989; Frost-Christensen and Sand-Jensen, 1992).
The most detailed research on C4 metabolism in submersed aquatic angiosperms has emphasized the freshwater submersed angiosperm and invasive aquatic weed, Hydrilla
verticillata. Insights from carbon acquisition in this plant may provide insights about the
potential for C4-like metabolism in seagrasses. During periods of low dissolved C , H.i
verticillata switches from C3- to C4-like metabolism, depressing photorespiration
(Reiskind et al., 1997). The leaves of this plant are only two cells thick; thus, it lacks classic terrestrial plant C4 anatomical features of mesophyll and bundle sheath cells (Kranz anatomy). Nonetheless, it can separate carbon fixation processes in an analogous manner. From immunocytochemical gold labeling and fluorescence studies, Reiskind et al. (1989) demonstrated that PEP-carboxylase was primarily localized in the cytosol, physically separated from Rubisco. It was hypothesized that to reduce ‘futile’ cycling of CO through cytosolic PEP-carboxylase, the CO concentrating site in hydrilla is the2 2
chloroplast, rather than the entire cell as in terrestrial plants (Bowes and Salvucci, 1989; Reiskind et al., 1997). This mechanism is somewhat analogous to use of carboxysomes as CO concentrating cites in cyanobacteria, or chloroplasts in microalgae (Badger and2
Price, 1992; Reiskind et al., 1997). In H. verticillata, C -limited plants that were inducedi
to conduct C4 metabolism increased 5-fold in internal dissolved C (DICi .2000 mmol), relative to C3 plants that were not subjected to C limitation (Reiskind et al., 1997).i
176 B.W. Touchette, J.M. Burkholder / J. Exp. Mar. Biol. Ecol. 250 (2000) 169 –205
angiosperms in extremely C -limited softwater habitats (Beer and Wetzel, 1981; Keeley,i
1982) but has not been reported in seagrasses. In desert plants it apparently is used as a mechanism to minimize water loss; CO is taken in through open stomata at night and2
temporarily incorporated into C4 products (Goodwin and Mercer, 1983). C3 fixation subsequently is completed with energy generated from the light reactions of photo-synthesis, while the stomata are closed to prevent water loss during high-temperature light periods. Submersed freshwater angiosperms with CAM lack functional stomata, and fix carbon at night when CO levels are highest from ecosystem respiration (Beer2
and Wetzel, 1981; Keeley, 1982).
2
Use of CO / HCO2 3 pumps in concentrating C is confined to aquatic plants, mostlyi
algae (Taiz and Zeiger, 1991). The pumps occur on the plasma membrane and appear to be inducible during periods of low CO availability. The energy necessary to drive these2
pumps is believed to come from the light reactions of photosynthesis. Although many
2
seagrass species have been demonstrated to utilize HCO , they are not nearly as3
¨
efficient as marine macroalgae (Beer, 1994; Bjork et al., 1997). This reduced ability to
2
use HCO , together with consideration of certain properties of seawater (low free CO3 2 2
concentrations [|12 mM at 208C, |150-fold lower than HCO ], low CO3 2 diffusion 2
rates, and slow conversion rates between CO and HCO ) — and the low or negligible2 3 22
ability of seagrasses to utilize the common CO3 ion in marine waters as a C sourcei
(Steeman-Nielsen, 1960; Raven, 1970; Prins and Elzenga, 1989; Durako, 1993; Stumm and Morgan, 1996) — has led some researchers to regard submersed seagrasses as
¨
potentially C -limited for growth (Beer, 1996; Bjork et al., 1997; Zimmerman et al.,i
1997).
2
Some seagrasses have been shown to directly use HCO3 as a Ci source in photosynthesis (e.g., Halophila ovalis, Cymodocea rotundata, Syringodium isoetifolium,
Thalassia testudinum, Zostera marina — Sand-Jensen and Gordon, 1984; Durako, 1993;
2
¨
Beer and Rehnberg, 1997; Bjork et al., 1997). Moreover, in many plants this HCO3 2
¨ utilization is not restricted to dehydration of HCO3 via carbonic anhydrase (CA; Bjork
2
et al., 1997). These species may instead directly transport HCO3 into photosynthesizing cells in an active, energy-costly process — indicated, for example, by significantly depressed photosynthetic rates in Zostera marina following application of ATPase inhibitors (N,N9-dicyclohexylcarbodiimide and sodium orthovanadate; Beer and Re-hnberg, 1997).
2
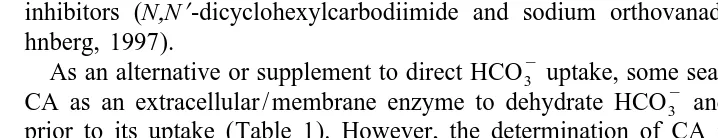
As an alternative or supplement to direct HCO3 uptake, some seagrass species utilize
2
CA as an extracellular / membrane enzyme to dehydrate HCO3 and liberate free CO2
prior to its uptake (Table 1). However, the determination of CA in these plants was
Table 1
1 21 21
Carbonic anhydrase (CA) activity (mequiv. H min mg chl) reported in seagrass species; values are based on direct enzymatic measurements
Species CA activity Source
Cymodocea nodosa No detection Beer et al. (1980) Halophila stipulacea 6 Beer et al. (1980) Syringodium isoetifolium 11 Beer et al. (1980) Thalassodendron ciliatum 8 Beer et al. (1980)
B.W. Touchette, J.M. Burkholder / J. Exp. Mar. Biol. Ecol. 250 (2000) 169 –205 177 Table 2
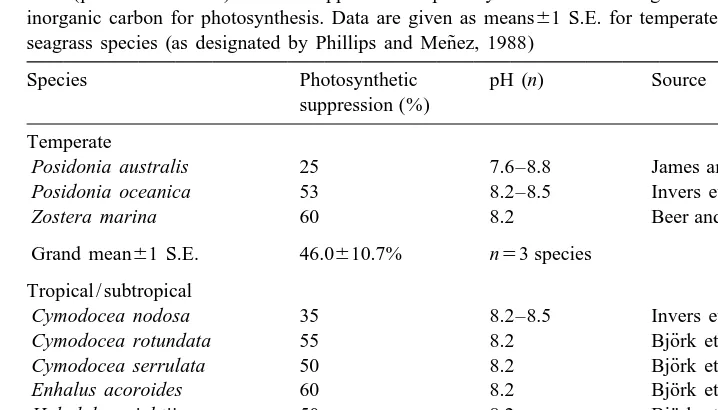
Photosynthetic suppression reported in seagrasses by a specific carbonic anhydrase (CA) inhibitor, acetazola-mide (pH also indicated). Greater suppression of photosynthesis indicates higher reliance on CA in acquiring inorganic carbon for photosynthesis. Data are given as means61 S.E. for temperate and tropical / subtropical
˜ seagrass species (as designated by Phillips and Menez, 1988)
Species Photosynthetic pH (n) Source
suppression (%) Temperate
Posidonia australis 25 7.6–8.8 James and Larkum (1996)
Posidonia oceanica 53 8.2–8.5 Invers et al. (1999)
Zostera marina 60 8.2 Beer and Rehnberg (1997)
Grand mean61 S.E. 46.0610.7% n53 species Tropical / subtropical
Cymodocea nodosa 35 8.2–8.5 Invers et al. (1999)
¨
Cymodocea rotundata 55 8.2 Bjork et al. (1997)
¨
Cymodocea serrulata 50 8.2 Bjork et al. (1997)
¨
Enhalus acoroides 60 8.2 Bjork et al. (1997)
¨
Halodule wrightii 50 8.2 Bjork et al. (1997)
¨
Halophila ovalis 25 8.2 Bjork et al. (1997)
¨
Syringodium ioetifolium 45 8.2 Bjork et al. (1997)
¨
Thalassia hemprichii 40 8.2 Bjork et al. (1997)
¨
Thalassodendron ciliatum 20 8.2 Bjork et al. (1997)
Grand mean61 S.E. 42.264.5% n59 species
made either through direct enzymatic measurements, or through indirect decline in photosynthesis following addition of a CA-specific inhibitor (acetazolamide). Decreases measured in photosynthesis following application of acetazolamide have ranged from 0
2
to as much as 75%, suggesting that the degree at which seagrasses utilize HCO3 via membrane-bound CA is highly variable (Table 2).
3. Photosynthesis–irradiance relationships
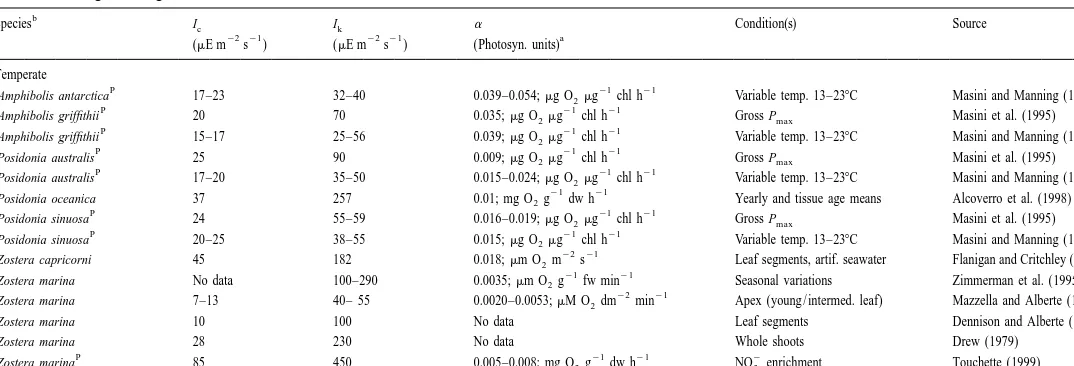
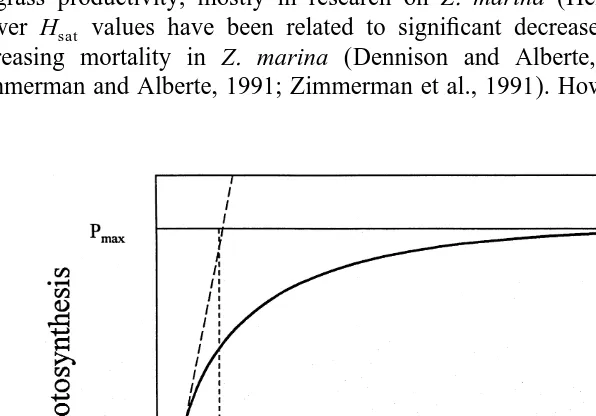
Most of the research that has been conducted on seagrass physiology has focused on photosynthesis–irradiance (P –I ) relationships (Fig. 2), in efforts to determine light levels needed to maintain healthy growth. Such curves have provided estimates for photosynthetic capacity (Pmax), photosynthetic quantum efficiency (a; moles of carbon fixed per mole of PAR absorbed), saturating irradiance for photosynthesis (Ik5Pmax/a), compensation irradiance (I ), and other variables (Tables 3 and 4). The parameter Ic c
represents the light intensity at which oxygen production is equivalent to oxygen demand during respiration in photosynthetic tissues. Whole-plant respiratory oxygen demand is higher than the respiratory demand of photosynthetic tissues only; thus, Icp
represents the (additional) light required for whole-plant compensation irradiance (Tomasko, 1993). Most of the available data (for I , rather than I ) do not considerc cp
178
Photosynthetic–irradiance parameters reported for seagrass species including I (compensation irradiance), I (saturating irradiance),c k a(light-limited slope or quantum efficiency; |a 5Pmax/I ), and growing and / or measurement conditions. Data are given as meansk 61 S.E. for temperate and tropical / subtropical species, or as ranges if means were not available. Grand means (confined to consideration of I and I values, since they were expressed with common units across studies) werec k calculated using midrange values for those cases
b
Species Ic Ik a Condition(s) Source
22 21 22 21 a
(mE m s ) (mE m s ) (Photosyn. units)
Temperate
P 21 21
Amphibolis antarctica 17–23 32–40 0.039–0.054;mg O2mg chl h Variable temp. 13–238C Masini and Manning (1997)
P 21 21
Amphibolis griffithii 20 70 0.035;mg O2mg chl h Gross Pmax Masini et al. (1995)
P 21 21
Amphibolis griffithii 15–17 25–56 0.039;mg O2mg chl h Variable temp. 13–238C Masini and Manning (1997)
P 21 21
Posidonia australis 25 90 0.009;mg O2mg chl h Gross Pmax Masini et al. (1995)
P 21 21
Posidonia australis 17–20 35–50 0.015–0.024;mg O2mg chl h Variable temp. 13–238C Masini and Manning (1997) 21 21
Posidonia oceanica 37 257 0.01; mg O g2 dw h Yearly and tissue age means Alcoverro et al. (1998)
P 21 21
Posidonia sinuosa 24 55–59 0.016–0.019;mg O2mg chl h Gross Pmax Masini et al. (1995)
P 21 21
Posidonia sinuosa 20–25 38–55 0.015;mg O2mg chl h Variable temp. 13–238C Masini and Manning (1997) 22 21
Zostera capricorni 45 182 0.018;mm O m2 s Leaf segments, artif. seawater Flanigan and Critchley (1996)
21 21
Zostera marina No data 100–290 0.0035;mm O g2 fw min Seasonal variations Zimmerman et al. (1995) 22 21
Zostera marina 7–13 40– 55 0.0020–0.0053;mM O dm2 min Apex (young / intermed. leaf) Mazzella and Alberte (1986)
Zostera marina 10 100 No data Leaf segments Dennison and Alberte (1982)
Zostera marina 28 230 No data Whole shoots Drew (1979)
P 21 21 2
B
Zostera marina 10– 15 65 0.002–0.004;mM O mg2 chl min Variable temp. 15–358C Marsh et al. (1986)
21 21 ´
Zostera marina 30– 35 250 0.008; mg C g dw h Young leaf segments Jimenez et al. (1987)
21 21
Zostera marina 12– 60 198–210 0.003;mm O mg2 chl min Variable soil sulfide Goodman et al. (1995)
P 21 21
Zostera noltii 98–300 222–390 0.23–0.63;mg O g2 AFD min Seasonal variations Vermatt and Verhagen (1996)
21 21 ´
Zostera noltii 30– 35 350 0.008; mg C g dw h Young leaf segments Jimenez et al. (1987)
Grand mean61 S.E. 28.563.3 146.0638.8 (n58 species)
Tropical / subtropical
21 21
Cymodocea nodosa |0.01–43 26–230 0.005–0.63; mg O g2 dw h Variable temp. 10–308C Terrados and Ros (1995) Halodule uninervis 20–40 50 No data Variable water depth Beer and Waisel (1982)
P 22 21
Halodule wrightii 85 319 0.5–2.4;mm O g2 dw h In situ Dunton and Tomasko (1994)
P 22 21
Halodule wrightii 81 319 0.5–2.4;mm O g2 dw h In situ, yearly means Dunton (1996)
Halophila engelmannii 10–60 430–500 No data Seasonal and salinity response Chan et al. (1987)
Halophila stipulacea 20–40 100 No data Variable water depth Beer and Waisel (1982)
Syringodium filiforme 10–60 430–500 No data Seasonal and salinity response Chan et al. (1987)
Thalassia testudinum 10–60 430–500 No data Seasonal and salinity response Chan et al. (1987)
22 ¨
Thalassodendron ciliatum No data 1.5–5 W m No data Plants from 0.5233 m depth Parnik et al. (1992)
Grand mean61 S.E. 38.567.6 284.6671.1 (n57 species)
a
Slope values (a) are ratios and, consequently, are dependent on units; therefore, units of photosynthesis are also provided (note that light units were standard
´ ¨
across studies). Light values from Zostera noltii (Jimenez et al., 1987) and Thalassodendron ciliatum (Parnik et al., 1992) were not used to calculate the grand mean,
22
due to use of extreme light levels and different units (Watts m ), respectively. Note that AFD5ash-free dry weight; chl5chlorophyll; and dw5dry weight. b
180
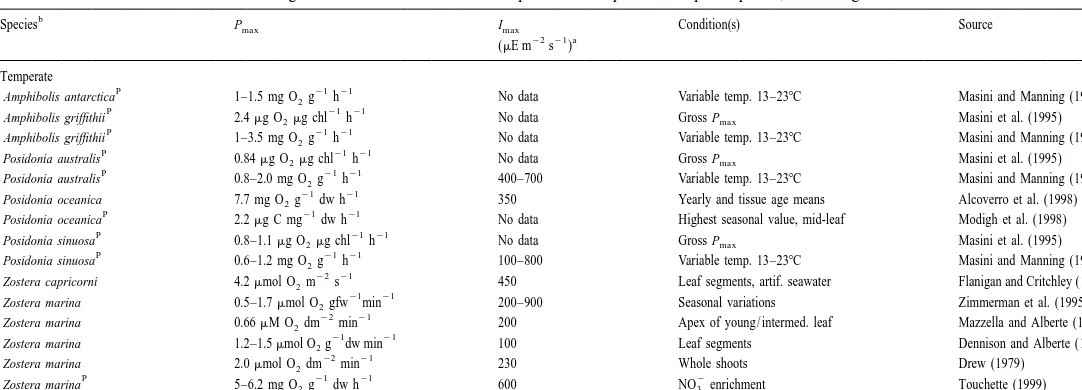
Photosynthetic parameters reported for seagrass species including Pmax(maximum photosynthesis), Imax(minimum light for maximum photosynthesis), and growing and / or measurement conditions. Data are given as means61 S.E. for temperate and tropical / subtropical species, or as ranges if means were not available
b
Species Pmax Imax Condition(s) Source
22 21 a
(mE m s )
Temperate
P 21 21
Amphibolis antarctica 1–1.5 mg O g2 h No data Variable temp. 13–238C Masini and Manning (1997)
P 21 21
Amphibolis griffithii 2.4mg O2mg chl h No data Gross Pmax Masini et al. (1995)
P 21 21
Amphibolis griffithii 1–3.5 mg O g2 h No data Variable temp. 13–238C Masini and Manning (1997)
P 21 21
Posidonia australis 0.84mg O2mg chl h No data Gross Pmax Masini et al. (1995)
P 21 21
Posidonia australis 0.8–2.0 mg O g2 h 400–700 Variable temp. 13–238C Masini and Manning (1997) 21 21
Posidonia oceanica 7.7 mg O g2 dw h 350 Yearly and tissue age means Alcoverro et al. (1998)
P 21 21
Posidonia oceanica 2.2mg C mg dw h No data Highest seasonal value, mid-leaf Modigh et al. (1998)
P 21 21
Posidonia sinuosa 0.8–1.1mg O2mg chl h No data Gross Pmax Masini et al. (1995)
P 21 21
Posidonia sinuosa 0.6–1.2 mg O g2 h 100–800 Variable temp. 13–238C Masini and Manning (1997) 22 21
Zostera capricorni 4.2mmol O m2 s 450 Leaf segments, artif. seawater Flanigan and Critchley (1996) 21 21
Zostera marina 0.5–1.7mmol O gfw2 min 200–900 Seasonal variations Zimmerman et al. (1995) 22 21
Zostera marina 0.66mM O dm2 min 200 Apex of young / intermed. leaf Mazzella and Alberte (1986) 21 21
Zostera marina 1.2–1.5mmol O g2 dw min 100 Leaf segments Dennison and Alberte (1982) 22 21
Zostera marina 2.0mmol O dm2 min 230 Whole shoots Drew (1979)
P 21 21 2
B
Zostera marina 0.40mM O mg2 chl min 75–150 Variable temp. 15–358C Marsh et al. (1986) 21 21
Zostera marina 0.5mmol O mg2 chl min 700–900 Variable soil sulfide Goodman et al. (1995)
P – 1 21
Zostera noltii 71–236mg O g2 AFD min 150–900 Seasonal variations Vermatt and Verhagen (1996)
21 21 ´
Zostera noltii 3–6.5 mg C g dw h 3600 Young leaf segments Jimenez et al. (1987)
a
Grand mean61 S.E. 452631.6 (n55 species)
Tropical / subtropical
21 21 21
Cymodocea nodosa 3.0 mg O g2 dw h No data Saturating light, flow.0.64 cm s Koch (1994) 21 21
Cymodocea nodosa 2.4–8 mg O g2 dw h 100–400 Variable temp. 10–308C Terrados and Ros (1995) 21 21
Halodule uninervis 0.12mmol O mg2 chl min No data Variable depth Beer and Waisel (1982)
P 21 21
Halodule wrightii 374mmol O g2 dw h 520 In situ Dunton and Tomasko (1994)
P 21 21
Halodule wrightii 422mmol O g2 dw h 400–800 In situ, yearly means Dunton (1996) 21 21
Halophila engelmannii 40–65 ppm O g2 dw h No data Seasonal and salinity response Chan et al. (1987) 21 21
Halophila stipulacea 40mmol O mg2 chl min No data Variable depth Beer and Waisel (1982)
Syringodium filiforme No data No data Seasonal and salinity response Chan et al. (1987)
21 21 21
Thalassia testudinum 3.2 mg O g2 dw h No data Artif. seawater; flow.0.25 cm s Kock (1994)
Thalassia testudinum No data No data Seasonal and salinity response Chan et al. (1987)
21 21 22 ¨
Thalassodendron ciliatum 30–50mmol CO kg2 dw s 20–80 W m Plants from 0.5–33 m depth Parnik et al. (1992)
a
Grand mean61 S.E. 4056155 (n52 species)
a
Grand means (confined to consideration of Imaxvalues since they were expressed in common units across studies) were calculated using the midrange values for
´ ¨
those cases. Light values from Zostera noltii (Jimenez et al., 1987) and Thalassodendron ciliatum (Parnik et al., 1992) were not used to calculate the grand mean, due
22
to use of extreme light levels and different units (Watts m ), respectively. Note that AFD5ash-free dry weight; chl5chlorophyll; and dw5dry weight. b
182 B.W. Touchette, J.M. Burkholder / J. Exp. Mar. Biol. Ecol. 250 (2000) 169 –205
Dunton, 2000). Caution should also be used in interpreting data on saturating irradiance for photosynthesis (I ), because seagrass photosynthesis has often been shown tok
increase under light intensities greater than I (Fig. 2; Tomasko, 1993).k
Geographic comparisons of seagrass photosynthesis are difficult because of inconsis-tencies in units used for photosynthetic rates. From the available data, temperate-zone seagrasses have lower I values than tropical / subtropical species (meansc 61 standard
22 21
error [S.E.] as 28.563.3 and 38.567.6 mE m s , respectively; Table 3), indicating that temperate seagrasses can utilize lower light levels for photosynthesis. Temperate-zone seagrasses also have been reported to have lower Ik values than tropical /
22 21
subtropical species (means61 S.E. as 146.0638.8 and 284.6671.1 mE m s , respectively; Table 3), which would be expected since available ambient light is lower in temperate regions.
In addition to the light intensity, the duration of the daily light period at which light equals or exceeds the photosynthetic light saturation point (H ) is important in seagrasssat
growth and survival, especially for plants at or near the maximum depth distribution for the species in a given location (Dennison and Alberte, 1982, 1985; Zimmerman et al., 1995a). A parameter taken from phytoplankton studies, H , has been used to estimatesat
seagrass productivity, mostly in research on Z. marina (Herzka and Dunton, 1998). Lower Hsat values have been related to significant decreases in productivity and / or increasing mortality in Z. marina (Dennison and Alberte, 1985; Dennison, 1987; Zimmerman and Alberte, 1991; Zimmerman et al., 1991). However, Hsatis site- as well
B.W. Touchette, J.M. Burkholder / J. Exp. Mar. Biol. Ecol. 250 (2000) 169 –205 183
as species-specific (range of 3–12 h reported for Z. marina), with this high variability likely resulting from differences in temperature, metabolic activity, and biomass distribution between C-sink and C-source tissues (Zimmerman and Alberte, 1991). Thus, use of Hsat to predict productivity should not be extrapolated to multiple sites (Dennison and Alberte, 1985; Zimmerman et al., 1989, 1991; Herzka and Dunton, 1998).
The Hsatmodel assumes that productivity does not occur at light levels below I , thusk
omitting light-limited photosynthesis from consideration (Herzka and Dunton, 1997, 1998). Although the model has been used successfully to estimate productivity of Z.
marina, Herzka and Dunton (1998) demonstrated that it is more limited in estimating
productivity of the subtropical seagrass, Thalassia testudinum. For example, during a period of low irradiance due to light attenuation, the Hsatmodel predicted 0–37% of the production that was calculated from numerical integration of empirical data (Herzka and Dunton, 1998). In this and other seagrass species with higher light requirements, the Hsat
model may not be applicable because of the potential for extended periods of light-limited photosynthesis.
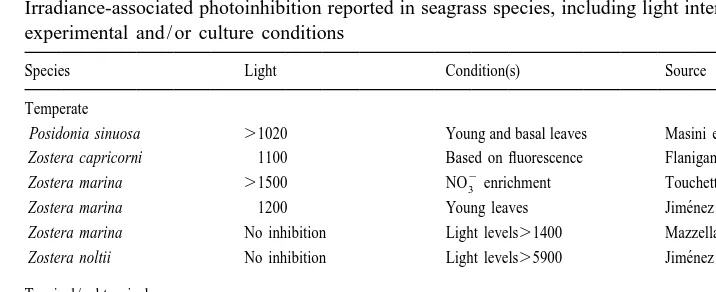
4. Photoinhibition and photosuppression
Although most seagrasses are regarded as shade- or low light-adapted (Ralph and Burchett, 1995), shallow-water or intertidal species may sustain photoinhibition from high photon flux densities during low tides (Ralph and Burchett, 1995). Photoinhibition is defined here as a reduction in photosynthetic rates in response to high light intensities, whereas photosuppression is defined as a reduction in photosynthetic rates due to other processes such as toxicological (e.g., herbicides, metals) or physiological effects (e.g., feedback inhibition). Photoinhibition is believed to be a photoprotective mechanism that depresses photosynthetic rates (PSII) and impairs both electron transport and photo-phosphorylation, thus allowing excessive light energy to be dissipated as heat (Krause and Weis, 1991; Hanelt et al., 1994). In seagrasses, this process appears to occur at light
22 21 22 21
intensities between 700 and 1600mE m s , most often at.1000mE m s , with maximal photoinhibition between 1200 and 1500 h (Table 5; Dawes et al., 1987; Hanelt et al., 1994).
The increased energy dissipation in photoinhibition is generally associated with an increase in zeaxanthin levels in plants, and / or with a decrease in the number of active PS II centers (Guenther and Melis, 1990; Adams and Demming-Adams, 1992; Hanelt et al., 1994). Zeaxanthin increases following de-epoxidation of violaxanthin in the xanthophyll cycle, providing the mechanism for the energy dissipation (Demming-Adams and (Demming-Adams, 1992; (Demming-Adams et al., 1995; Flanigan and Critchley, 1996). Energy dissipation may also be accomplished through turnover of the D1 protein in the reaction center of PSII. In high light, continuous D1 protein degradation / replacement is believed to occur; but in extremely high light, repair of the reaction center via D1 protein replacement occurs much more slowly than D1 protein degradation, thus producing a photoinhibitory response (Ohad et al., 1984; Guenther and Melis, 1990; Krause and Weis, 1991; Aro et al., 1993). However, in the seagrass Zostera capricorni, maximum
22 21
184 B.W. Touchette, J.M. Burkholder / J. Exp. Mar. Biol. Ecol. 250 (2000) 169 –205 Table 5
22 21 Irradiance-associated photoinhibition reported in seagrass species, including light intensities (mE m s ) and experimental and / or culture conditions
Species Light Condition(s) Source
Temperate
Posidonia sinuosa .1020 Young and basal leaves Masini et al. (1995)
Zostera capricorni 1100 Based on fluorescence Flanigan and Critchley (1996) 2
Zostera marina .1500 NO3 enrichment Touchette (1999) ´
Zostera marina 1200 Young leaves Jimenez et al. (1987)
Zostera marina No inhibition Light levels.1400 Mazzella and Alberte (1987) ´
Zostera noltii No inhibition Light levels.5900 Jimenez et al. (1987)
Tropical / subtropical
Halophila engelmannii 700 Culture bottles Dawes et al. (1987)
Halophila ovalis 1000 After 120 min Ralph and Burchett (1995)
Halophila stipulacea 1000 Based on chl response Drew (1979)
Thalassia hemprichii 1600 Low tide Hanelt et al. (1994)
22 21
levels considered to photoinhibit this species (1100mE m s ; Flanigan and Critchley, 1996). Moreover, D1 protein turnover was not proportional to irradiance, suggesting that the D1 protein levels in this plant may be more influenced by pH and ATP levels in the thylakoid lumen. If so, then — at least in this seagrass species — D1 protein turnover does not function in photoprotection via photoinhibition (Critchley and Russell, 1994; Flanigan and Critchley, 1996).
Chlorophyll fluorescence techniques (for example, PAM fluorimetry) have enabled non-intrusive study of the behavior of photosystem II and electron transport (Krause and Weis, 1991; Beer et al., 1998; Ralph et al., 1998). Under typical temperature regimes, most chlorophyll a fluorescence is attributed to PSII, and can be used to gain information about light conditioning, photosynthetic capacity, photosynthetic efficiency, and electron transport of PSII (Krause and Weis, 1991; Ralph et al., 1998). Variable fluorescence (F ) is related to maximum and initial fluorescence (F and F , respective-v m o
ly) as: Fv5Fm2F (Ralph et al., 1998). In ‘sun’ plants that are adapted to grow undero
high light, F remains relatively constant and Fo m fluctuates (Demmig and Bjorkman, 1987; Franklin et al., 1992; Ralph and Burchett, 1995). In contrast, ‘shade’ plants that are adapted for growth in low-light conditions tend to fluctuate substantially in F — ao
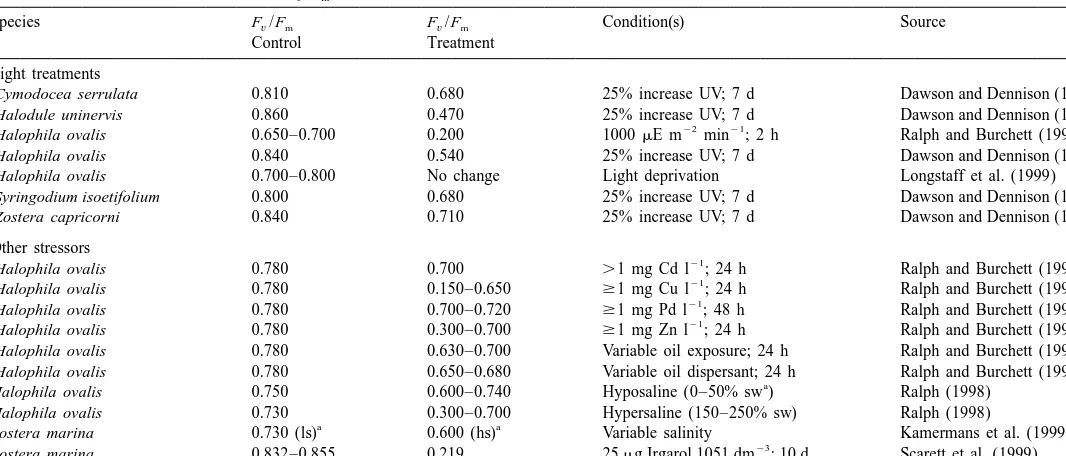
response that has been linked to photoinhibition and / or other adverse affects on the PSII reaction centers (Demmig and Bjorkman, 1987; Franklin et al., 1992; Ralph and Burchett, 1995; Dawson and Dennison, 1996). The F /Fv m ratio (photochemical efficiency) is used to evaluate the physiological state (including the extent of photo-inhibition) of the photosynthetic apparatus in various plants, including some seagrasses (Table 6). A decrease in this ratio may be associated with environmental stressors that directly affect PSII efficiency (Krause and Weis, 1991).
Seagrasses such as Halophila ovalis and Posidonia australis show variations in Fv
B Photochemical efficiencies (quantum yield, F /F ) reported in seagrass species as an indication of physiological stressv m
Species F /Fv m F /Fv m Condition(s) Source
Control Treatment
Light treatments
Cymodocea serrulata 0.810 0.680 25% increase UV; 7 d Dawson and Dennison (1996)
Halodule uninervis 0.860 0.470 25% increase UV; 7 d Dawson and Dennison (1996)
22 21
Halophila ovalis 0.650–0.700 0.200 1000mE m min ; 2 h Ralph and Burchett (1995)
Halophila ovalis 0.840 0.540 25% increase UV; 7 d Dawson and Dennison (1996)
Halophila ovalis 0.700–0.800 No change Light deprivation Longstaff et al. (1999)
Syringodium isoetifolium 0.800 0.680 25% increase UV; 7 d Dawson and Dennison (1996)
Zostera capricorni 0.840 0.710 25% increase UV; 7 d Dawson and Dennison (1996)
Other stressors
21
Halophila ovalis 0.780 0.700 .1 mg Cd l ; 24 h Ralph and Burchett (1998a)
21
Halophila ovalis 0.780 0.150–0.650 $1 mg Cu l ; 24 h Ralph and Burchett (1998a)
21
Halophila ovalis 0.780 0.700–0.720 $1 mg Pd l ; 48 h Ralph and Burchett (1998a)
21
Halophila ovalis 0.780 0.300–0.700 $1 mg Zn l ; 24 h Ralph and Burchett (1998a)
Halophila ovalis 0.780 0.630–0.700 Variable oil exposure; 24 h Ralph and Burchett (1998b)
Halophila ovalis 0.780 0.650–0.680 Variable oil dispersant; 24 h Ralph and Burchett (1998b) a
Halophila ovalis 0.750 0.600–0.740 Hyposaline (0–50% sw ) Ralph (1998)
Halophila ovalis 0.730 0.300–0.700 Hypersaline (150–250% sw) Ralph (1998)
a a
Zostera marina 0.730 (ls) 0.600 (hs) Variable salinity Kamermans et al. (1999)
23
Zostera marina 0.832–0.855 0.219 25mg Irgarol 1051 dm ; 10 d Scarett et al. (1999)
a
186 B.W. Touchette, J.M. Burkholder / J. Exp. Mar. Biol. Ecol. 250 (2000) 169 –205 1
P680 in PSII, including the primary donor of P680 (Z; reaction side of the D1 protein), which would prevent Q from being reduced (Larkum and Wood, 1993). Increases in F ,o
apparently result, as well, from UV damage to the PSII reaction centers in the seagrasses
Cymodocea serrulata, Halodule uninervis, Halophila ovalis, Syringodium isoetifolium
and Zostera capricorni (Dawson and Dennison, 1996). F /Fv m ratios have been used in seagrasses to demonstrate photosuppression and PSII responses to UV radiation, light deprivation, and other stressors (Table 6).
5. Carbohydrate metabolism
5.1. Major carbohydrate storage compounds
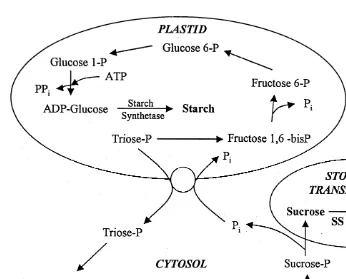
The processes by which starch or sucrose is biosynthesized in angiosperms (from C3 photosynthesis products triose-P, 3-PGA, and dehydroxyacetone) are based on competing reactions that are physically separated within the cell, with starch produced in plastids and sucrose produced in the cytosol (Fig. 3). The relative amount of starch or sucrose produced by plants dependents largely on the available P (Goodwin and Mercer, 1983).i
When high internal P levels are available, more triose-P can be exported into the cytosoli
to form sucrose; when P is low, triose-P export decreases with concomitant increase ini
starch production. Beyond this generalization from general plant biochemistry, however, many plant species have demonstrated preference for storage of one compound (starch, sucrose, or other complex carbohydrates such as rafinose or stachyose) over another (Brocklebank and Hendry, 1989). Furthermore, the primary storage compound can be influenced by growth status; for example, plants undergoing rapid growth tend to have higher levels of sucrose relative to starch (Taiz and Zeiger, 1991).
The dominant storage carbohydrate in most seagrasses is the soluble product, sucrose (Drew, 1983; Pirc, 1989; Vermatt and Verhagen, 1996; Touchette, 1999). In the species that have been examined (Enhalus acoroides, Halodule wrightii, Halophila decipiens,
Syringodium filiforme, Thalassia testudinum, Zostera marina), sucrose forms more than
90% of the total soluble carbohydrate pool. Other soluble carbohydrates have included glucose, fructose, and more complex polysaccharides (Drew, 1983). Although lower in abundance, additional soluble carbohydrates in seagrasses include apiose, arabinose, fucose, galactose, mannose, rhamnose, and xylose (Waldron et al., 1989; Webster and Stone, 1994).
On average (basis, 24 studies involving 18 seagrass species), total carbohydrates in
21
B.W. Touchette, J.M. Burkholder / J. Exp. Mar. Biol. Ecol. 250 (2000) 169 –205 187
Fig. 3. Sucrose and starch biosynthesis and catabolism in plant cells. Reactions of starch biosynthesis occur in plastids, wherein accumulation of triose-phosphate, especially during photosynthesis, initiates the process. Sucrose biosynthesis begins with an exchange of P and triose-phosphate at the P-translocator, so thati triose-phosphate levels begin to accumulate in the cytosol. Two triose-phosphate (dihydroxyacetone 3-phosphate and glyceraldehyde 3-3-phosphate) are then combined to form a single 6-C compound, fructose 1,6-bisphosphate (fructose 1,6-bisphosphate), which undergoes dephosphorylation to form fructose 6-phos-phate. This product can then undergo isomerization to form glucose 6-P, which eventually is converted to UDP-glucose. UDP-glucose combines with available fructose 6-P to form sucrose 6-P, via the enzyme sucrose-P synthase (SPS). Sucrose 6-phosphate is dephosphorylated to produce sucrose, which can be used directly in carbon storage, converted to more complex carbohydrates, or translocated to other tissues to aid in other metabolic processes or storage. To initiate sucrolysis, the enzyme sucrose synthase (SS) breaks down sucrose to UDP-glucose and fructose, thus liberating carbon for use in various metabolic pathways (developed from Taiz and Zeiger, 1991).
2
content typically accumulate more rhizome carbohydrates (r 50.54; Fig. 4A). There is
2
a similar though weaker correlation between root and rhizome tissues (r 50.35; Fig. 4B).
We note, as well, an interesting trend between light compensation point (I ) and leafc
soluble carbohydrate levels in seagrasses (Fig. 5). If I values represent the light level atc
which photosynthesis and respiration rates are equivalent, then plants with high I valuesc
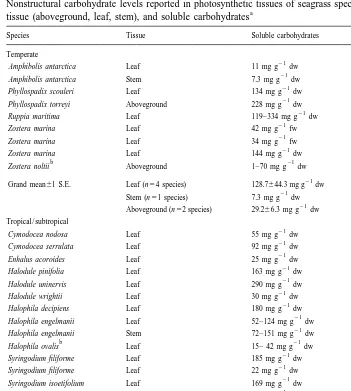
188 B.W. Touchette, J.M. Burkholder / J. Exp. Mar. Biol. Ecol. 250 (2000) 169 –205 Table 7
Nonstructural carbohydrate levels reported in photosynthetic tissues of seagrass species; data include species, a
tissue (aboveground, leaf, stem), and soluble carbohydrates
Species Tissue Soluble carbohydrates Source
Temperate
21
Amphibolis antarctica Leaf 11 mg g dw Drew (1982) 21
Amphibolis antarctica Stem 7.3 mg g dw Drew (1982) 21
Phyllospadix scouleri Leaf 134 mg g dw Neighbors and Horn (1991) 21
Phyllospadix torreyi Aboveground 228 mg g dw Drew (1982) 21
Ruppia maritima Leaf 119–334 mg g dw Lazer and Dawes (1991) 21
Zostera marina Leaf 42 mg g fw Zimmerman et al. (1995) 21
Zostera marina Leaf 34 mg g fw Zimmerman et al. (1997) 21
Zostera marina Leaf 144 mg g dw Drew (1982)
b 21
Zostera noltii Aboveground 1–70 mg g dw Vermatt and Verhagen (1996)
21
Cymodocea nodosa Leaf 55 mg g dw Drew (1982) 21
Cymodocea serrulata Leaf 92 mg g dw Tomasko (1993) 21
Enhalus acoroides Leaf 25 mg g dw Drew (1982) 21
Halodule pinifolia Leaf 163 mg g dw Tomasko (1993) 21
Halodule uninervis Leaf 290 mg g dw Tomasko (1993) 21
Halodule wrightii Leaf 30 mg g dw Drew (1982) 21
Halophila decipiens Leaf 180 mg g dw Drew (1982) 21
Halophila engelmanii Leaf 52–124 mg g dw Dawes et al. (1987) 21
Halophila engelmanii Stem 72–151 mg g dw Dawes et al. (1987)
b 21
Halophila ovalis Leaf 15– 42 mg g dw Longstaff et al. (1999) 21
Syringodium filiforme Leaf 185 mg g dw Ray and Stevens (1996) 21
Syringodium filiforme Leaf 22 mg g dw Drew (1982) 21
Syringodium isoetifolium Leaf 169 mg g dw Tomasko (1993) 21
Thalassia hemprichii Leaf 92 mg g dw Tomasko (1993) 21
Thalassia testudinum Leaf 99–161 mg g dw Durako and Moffler (1985) 21
Thalassia testudinum Leaf 50–70 mg C g dw Lee and Dunton (1996) 21
Thalassia testudinum Leaf 50 mg C g dw Lee and Dunton (1997) 21
Thalassia testudinum Leaf 60 mg g dw Drew (1982) 21
Thalassodendron ciliatum Leaf 24 mg g dw Drew (1982) 21
Thalassodendron ciliatum Stem 52 mg g dw Drew (1982)
21
Grand mean61 S.E. Leaf (n514 species) 102.5620.3 mg g dw 21
Stem (n52 species) 81.7629.2 mg g dw
a 21
Note that, where possible, values were converted from percent dry weight to mg g dry weight (dw). Other values are reported as fresh weight (fw). The data are given as means 61 S.E. for temperate and tropical / subtropical seagrasses, or as ranges if means were not available. Grand means (confined to
21
consideration of data reported with the most common unit representation, mg g dw), were calculated based on mid-range estimates for those cases.
b 21 21
Starch was also observed in these two species (0–20 mg g dw in Zostera noltii; 73–91 mg g dw for Halophila ovalis).
tend to have low leaf carbohydrates. Although this approach is simplistic considering the number of factors that can influence carbohydrate levels, nonetheless, seagrasses with Ic
22 21
B.W. Touchette, J.M. Burkholder / J. Exp. Mar. Biol. Ecol. 250 (2000) 169 –205 189 Table 8
Soluble carbohydrate levels reported in non-photosynthetic tissues of seagrass species. Data include species, a
tissues (belowground, rhizome, root), and soluble carbohydrates
Species Tissue Soluble carbohydrates Source
Temperate
21
Amphibolis antarctica Belowground 33 mg g dw Tomasko (1993) 21
Amphibolis antarctica Rhizome 11.4 mg g dw Drew (1982) 21
Amphibolis antarctica Root 19 mg g dw Drew (1982) 21
Phyllospadix torreyi Belowground 234 mg g dw Drew (1982) 21
Posidonia australis Rhizome 390 mg g dw Ralph et al. (1992) 21
Ruppia maritima Rhizome 118–520 mg g dw Lazar and Dawes (1991) 21
Ruppia maritima Root 95–236 mg g dw Lazar and Dawes (1991) 21
Zostera marina Root 5 mg g fw Zimmerman et al. (1997) 21
Zostera marina Root 3.5 mg g fw Zimmerman et al. (1995) 21
Zostera marina Rhizome 282 mg g dw Drew (1982) 21
Zostera marina Root 43 mg g dw Drew (1982)
b 21
Zostera noltii Belowground 20–150 mg g dw Vermatt and Verhagen (1996) 21
Grand mean6S.E. Root (n53 species) 75.6645.3 mg g dw 21
Rhizome (n54 species) 250.6682.8 mg g dw 21
Belowground (n53 species) 120.3662.8 mg g dw Tropical / subtropical
21
Cymodocea nodosa Rhizome 213 mg g dw Drew (1982) 21
Cymodocea nodosa Root 151 mg g dw Drew (1982) 21
Cymodocea serrulata Belowground 367 mg g dw Tomasko (1993) 21
Enhalus acoroides Rhizome 84 mg g dw Drew (1982) 21
Enhalus acoroides Root 227 mg g dw Drew (1982) 21
Halodule pinifolia Belowground 182 mg g dw Tomasko (1993) 21
Halodule uninervis Belowground 45 mg g dw Tomasko (1993) 21
Halodule wrightii Rhizome 210 mg g dw Drew (1982) 21
Halodule wrightii Root 168 mg g dw Drew (1982) 21
Halophila decipiens Rhizome 454 mg g dw Drew (1982) 21
Halophila decipiens Root 96 mg g dw Drew (1982) 21
Halophila engelmanii Rhizome 202–347 mg g dw Dawes et al. (1987)
b 21
Halophila ovalis Rhizome 40–126 mg g dw Longstaff et al. (1999)
b 21
Halophila ovalis Root 8–30 mg g dw Longstaff et al. (1999) 21
Syringodium filiforme Rhizome 280 mg g dw Rey and Stephens (1996) 21
Syringodium filiforme Rhizome 804 mg g dw Drew (1982) 21
Syringodium filiforme Root 473 mg g dw Drew (1982) 21
Thalassia hemprichii Belowground 45 mg g dw Tomasko (1993) 21
Thalassia testudinum Rhizome 194–318 mg g dw Durako and Moffler (1985) 21
Thalassia testudinum Rhizome 110–200 mg C g dw Lee and Dunton (1996) 21
Thalassia testudinum Rhizome 130 mg C g dw Lee and Dunton (1997) 21
Thalassia testudinum Root 94–151 mg g dw Durako and Moffler (1985) 21
Thalassia testudinum Root 65–100 mg C g dw Lee and Dunton (1996) 21
Thalassia testudinum Root 71 mg C g dw Lee and Dunton (1997) 21
Thalassia testudinum Rhizome 263 mg g dw Drew (1982) 21
Thalassia testudinum Root 200 mg g dw Drew (1982) 21
Thalassodendron ciliatum Rhizome 139 mg g dw Drew (1982) 21
Thalassodendron ciliatum Root 160 mg g dw Drew (1982)
Grand mean6S.E.
Belowground (n54 species) 159.7676.2 mg g dw
a 21
Some values were converted from percent dry weight to mg g dry weight [dw]. Data are given as means 61 S.E. for temperate and tropical / subtropical seagrasses, or as ranges if means were not available. Grand
21 means (confined to consideration of data reported with the most common unit representation, mg g dw) were calculated using mid-range values for those cases.
b 21
Starch was also observed in these species (10–40 mg g dw for Zostera noltii belowground tissues,
21 21
190 B.W. Touchette, J.M. Burkholder / J. Exp. Mar. Biol. Ecol. 250 (2000) 169 –205
Fig. 4. Relationship between rhizome soluble carbohydrate levels and (A) leaf soluble carbohydrates; or (B) root soluble carbohydrates. Correlations were derived from published literature values, and letters represent different species (see Table 8). In the leaf carbohydrate regression, the far right S.f. value was omitted from the analysis because of its extremely high rhizome carbon content (more than two-fold higher than all other values).
21
mg g dry weight, whereas plants with higher I values tend to have much lower leafc
carbohydrate content.
5.2. Sucrose metabolism
B.W. Touchette, J.M. Burkholder / J. Exp. Mar. Biol. Ecol. 250 (2000) 169 –205 191
Fig. 5. Relationship between compensation-level irradiance (I ) and leaf soluble carbohydrates, including 15c observations on nine seagrass species from the published literature. Letters represent different species (see
22 21
Tables 3 and 8). Note that plants with relatively high I values (.50c mE m s tend to have low soluble
21
carbohydrate content (,50 mg g dry weight), whereas species with lower I values have the potential toc accumulate more soluble carbohydrates. Plants with high I values likely have higher respiration-to-photo-c synthesis ratios and, thus, may have a higher carbon demand.
SPS activity has been used as an indicator for sucrose export from source tissues, exemplified by an increase in SPS activity in developing leaf tissue during the transition in function from a carbon sink to a carbon source (Giaquinta, 1979; Stitt, 1994; Zimmerman et al., 1995b). In Zostera marina, for example, SPS activity has been shown to increase with leaf age, which is consistent with leaf maturation from carbon sink to source (Zimmerman et al., 1995b).
In many terrestrial plants with sucrose as the major storage carbohydrate, SPS activity is strongly influenced by light activation and P inhibition; and soluble carbohydratei
levels appear to fluctuate between light and dark conditions (Huber et al., 1989a). However, the level of SPS activation by light may depend strongly on substrate availability (group I versus group II species; see Huber et al., 1989b). In contrast, SPS activity in starch-accumulating terrestrial plants appears to be unaffected by light or Pi
192 B.W. Touchette, J.M. Burkholder / J. Exp. Mar. Biol. Ecol. 250 (2000) 169 –205
Touchette, 1999). Moreover, SPS activity in Z. marina leaf tissues appears to be
22 21
unaffected by extended periods of light deprivation (up to 2 weeks at ,10mE m s Touchette et al., 1999), indicating lack of a SPS-light response in this seagrass.
Although SPS is highly regulated by physiological processes, certain environmental factors also can influence its activity. In Zostera marina, leaf SPS activities have been
1
correlated with changes in water-column NH , CO4 2 availability, photosynthesis, salinity, temperature, and grazing (Zimmerman et al., 1996, 1997; Touchette, 1999). In terrestrial plants, SPS activity and / or sucrose levels tend to increase with decreasing temperature (Kaurin et al., 1981; Guy et al., 1992; Hurry et al., 1994). By contrast, in Z.
marina a positive relationship has been observed between SPS activity and temperature,
and between SPS activity and salinity (Fig. 6).
Terrestrial plants that have shown an inverse relationship between SPS activity and temperature appear to increase sucrose accumulation as a cryoprotectant during cooler
B.W. Touchette, J.M. Burkholder / J. Exp. Mar. Biol. Ecol. 250 (2000) 169 –205 193
periods (Santarius, 1973; Carpenter et al., 1986), with sucrose functioning as an osmolyte in reducing water stress (Guy et al., 1992). However, halophytes in shallow marine systems sometimes encounter dynamic changes in environmental salinity (for example, during warm periods with increased evaporation), which can significantly alter the osmotic potential of their tissues (Reed and Stewart, 1985; Weimberg, 1987). Increased SPS activity (which has been observed, for example, in Z. marina with increased temperature or salinity) thus may indicate an osmotic adjustment response for marine angiosperms, analogous to increased SPS activity as a cryoprotectant response in terrestrial non-halophytic plants (Touchette, 1999).
Sucrose metabolism and degradation in sink tissues involve two key enzymes as invertase (which hydrolyzes sucrose into glucose) and sucrose synthase (SS, which can also carry out the initial step in sucrolysis but forms UDP-glucose and fructose as products; Fig. 3). Activities of these enzymes have been related to sucrose import into sink tissues and sucrose entry into metabolism (Claussen, 1983; Sung et al., 1988; Stitt, 1994; Koch and Nolte, 1995). Based on data from general plant physiology, invertase activity tends to be highest during active growth and declines following maturation (Sung et al., 1994; Koch and Nolte, 1995). In contrast, high SS activity can occur in sink / storage tissues of all ages, and SS appears to be the primary sucrose-metabolizing enzyme in mature storage tissues. SS activity and, thus, sucrose breakdown, may be linked to respiration, given its response to adenylate balance (toward conservation of ATP) and its lack of apparent light activation (Kalt-Torres and Huber, 1987; Koch and Nolte, 1995). Moreover, during periods of low carbon availability, localization of SS activity within specific cells and / or tissues may be a mechanism for providing sink priority to the most essential cells.
In seagrasses, research on sucrose metabolism has been limited mostly to studies of
Zostera marina, a species that stores most of its carbon reserves in belowground
(rhizomatous) tissues as mentioned. Root SS activity in Z. marina decreases with tissue age (SS activity in distal root tissues—for example, declined by two-fold in roots from the first to the eighth node; Kraemer et al., 1998). Nonetheless, increased SS activity has been observed in very old root systems (root bundle 10 and beyond; Kraemer et al., 1998). Based on this information, it has been hypothesized that there are two separate SS isozymes in Z. marina, one of which is highly sensitive to low sucrose levels; and that the elevated SS activity in the oldest root tissues may be in response to low sucrose levels (Kraemer et al., 1998). The activity of this SS isozyme may enhance plant survival under periods of carbon limitation by maximizing sucrose utilization during periods when concentrations are low, and during periods of replenishment (Kraemer et al., 1998). In aboveground (leaf) tissue, SS activity also has been reported to decrease with age, a trend that may reflect a change in function from carbon sink to source as would be expected (Kraemer et al., 1998). But even the oldest leaves maintain substantial SS activity, suggesting that high levels of carbon metabolism can still occur in these tissues.
194 B.W. Touchette, J.M. Burkholder / J. Exp. Mar. Biol. Ecol. 250 (2000) 169 –205
dissolved oxygen concentrations are low, indicating increased carbon metabolism in response to anoxic / hypoxic conditions (Sachs et al., 1996; Germain et al., 1997; Touchette, 1999). In contrast, a positive relationship has been shown between below-ground tissue SS activity and temperature in Z. marina (Touchette, 1999). This temperature-associated increase in SS activity and, thus, higher sucrolysis, may be associated with increased respiratory demand (Touchette, 1999).
5.3. Starch metabolism
Starch synthesis occurs in plastids and, like sucrose production, is activated by an accumulation of triose-P and yields fructose 1,6-bisP as an initial product (Godwin and Mercer, 1983; Fig. 3). It differs from sucrose synthesis in that an ADP-glucose (rather than UDP-glucose) is involved, from which starch is formed by the enzyme starch synthase.
The data on starch storage in seagrasses are highly variable. Low starch content has been reported in Thalassia testudinium (Jagels, 1983) and Zostera marina (,5% of the total carbohydrates, US Pacific Coast, Alcoverro et al., 1999; Touchette, 1999). In contrast, Burke et al. (1996) reported that starch could form more than 65% (up to 140
21
mg g dry weight) of the total nonstructural carbohydrate content in Z. marina from Chesapeake Bay. In Z. noltii, starch levels can approach one-third of the total nonstructural carbohydrates in belowground tissues (Pirc, 1989; Vermatt and Verhagen, 1996). Halophila ovalis has also been found to accumulate up to 90% of its total nonstructural carbohydrates as starch in leaf and root tissue (Longstaff et al., 1999). Moreover, in plants with low shoot and root-rhizome starch, there may be substantial starch accumulation in fruit tissues (e.g., in Halodule spp., Halophila ovalis,
Phyllos-padix iwatensis, P. japonicus, Thalassia hemprichii — Bragg and McMillan, 1986; Kuo
et al., 1990; Kuo et al., 1991; Kuo and Kirkman, 1992).
6. Respiration
Respiration is considered here as the controlled mobilization and oxidation of stored carbohydrates. During this process free energy is released and incorporated into NADH and ATP, which can then be utilized to support other metabolic processes (Taiz and Zeiger, 1991). Respiration in plants may be considered in three stages as glycolysis and fermentation; the tricarboxylic acid cycle (TCA cycle or Krebs cycle, in mitochondria); and the electron transport chain, yielding ATP in mitochondria. These processes are conserved among many organisms, including seagrasses. In glycolysis, carbohydrates are converted in the cytosol to produce NADH and a 3-carbon product, pyruvate. Under
1
aerobic conditions in glycolysis, two electrons are required to reduce the NAD to NADH, which can then be used as a means to store free energy. The NADH eventually drives the synthesis of ATP via the electron transport chain. However, during anaerobic conditions both the TCA cycle and electron transport do not function (Taiz and Zeiger, 1991).
B.W. Touchette, J.M. Burkholder / J. Exp. Mar. Biol. Ecol. 250 (2000) 169 –205 195
1 1 1
in NAD . Because NAD is a required cofactor for many enzymes, a deficit in NAD can significantly impair important metabolic processes (Taiz and Zeiger, 1991). To
1
alleviate NAD depletion, pyruvate may be further metabolized through fermentation. In plants, both lactic acid and alcohol fermentation have been described (Davies, 1980; Roberts et al., 1984; Smith et al., 1988). Alternatively, some plants (including seagrasses) may accumulate other compounds during fermentation such as organic acids (malate, shikimate) or amino acids (alanine,g-amino butyric acid; Smith and Ap Rees, 1979; Davies, 1980; Mendelssohn et al., 1981; Joly and Crawford, 1982; Pregnall et al., 1984).
To avoid anaerobic respiration in belowground tissues, seagrasses and many other aquatic angiosperms translocate and release O2 in the rhizosphere during periods of active photosynthesis (Sand-Jensen et al., 1982; Smith et al., 1984; Crawford, 1987; Caffrey and Kemp, 1991). However, during darkness or extended low light (for example, from sustained cloud cover or water turbidity), belowground tissues may undergo periods of anerobiosis (Crawford, 1987). High rates of ethanol synthesis have been shown in excised roots of Zostera marina during anaerobic conditions (from use of
14
C-sucrose; Smith et al., 1988). However, typically ethanol does not accumulate. For example, in the above laboratory study, more than 95% of the ethanol produced was released into the rhizosphere, indicating effective removal from belowground tissues. Field populations similarly yielded little or no accumulation of ethanol in root tissues, even during extended periods of sediment anoxia associated with long periods of low light (Penhale and Wetzel, 1983; Pregnall et al., 1984).
It is likely that the low ethanol content in belowground tissues reflects its release into the rhizosphere. Nonetheless, alternative fermentation pathways have been described with significant increases in alanine and g-amino butyric acid, and decreases in glutamate and glutamine within 2–4 h of anaerobiosis (Pregnall et al., 1984; Smith et al., 1988). It was hypothesized that in Z. marina, pyruvate undergoes transamination via glutamate and / or glutamine to form alanine (Pregnall et al., 1984; Smith et al., 1988). Thus, pyruvate from glycolysis would be converted to alanine, thereby lowering production of the more toxic end product, ethanol. This preference for alanine accumulation would further benefit the plant by conserving carbon skeletons and assimilated nitrogen (Pregnall et al., 1984).
The primary environmental factor believed to influence respiration rates in seagrasses is temperature (Marsh et al., 1986; Zimmerman et al., 1989; Terrados and Ros, 1995; Masini and Manning, 1997). Unlike photosynthesis which increases with temperature up to |5–108C above ambient, respiration rates continue to increase with increasing
temperatures in excess of 408C (Drew, 1978; Bulthius, 1983; Marsh et al., 1986). Light and other environmental factors can also significantly influence respiration. For example, seagrasses in deeper water tend to have lower respiration rates (Dennison and Alberte, 1982). Z. marina grown at 5.5 m had respiration rates that were |40% lower than rates