Seasonality of foliar respiration in two dominant plant
species from the Arctic tundra: response to long-term
warming and short-term temperature variability
Mary A. Heskel
A,B,E, Danielle Bitterman
A, Owen K. Atkin
B, Matthew H. Turnbull
Cand Kevin L. Grif
fi
n
A,DADepartment of Ecology, Evolution, and Environmental Biology, Columbia University, New York, NY 10027, USA.
BResearch School of Biology, The Australian National University, Canberra, ACT 0200, Australia.
CSchool of Biological Sciences, University of Canterbury, Private Bag 4800, Christchurch 8041, New Zealand.
DDepartment of Earth and Environmental Sciences, Lamont-Doherty Earth Observatory, Columbia University,
Palisades, NY 10964-8000, USA.
ECorresponding author. Email: [email protected]
Abstract. Direct measurements of foliar carbon exchange through the growing season in Arctic species are limited, despite the need for accurate estimates of photosynthesis and respiration to characterise carbon cycling in the tundra. We examined seasonal variation in foliar photosynthesis and respiration (measured at 20C) in twofield-grown tundra species,Betula nana
L. andEriophorum vaginatumL., under ambient and long-term warming (LTW) conditions (+5C), and the relationship of
these fluxes to intraseasonal temperature variability. Species and seasonal timing drove most of the variation in photosynthetic parameters (e.g. gross photosynthesis (Agross)), respiration in the dark (Rdark) and light (Rlight), and foliar
nitrogen concentration. LTW did not consistently influencefluxes through the season but reduced respiration in both species. Alongside theflatter respiratory response to measurement temperature in LTW leaves, this provided evidence of thermal acclimation. The inhibition of respiration by light increased by ~40%, withRlight:Rdarkvalues of ~0.8 at leaf out decreasing
to ~0.4 after 8 weeks. Though LTW had no effect on inhibition, the cross-taxa seasonal decline inRlight:Rdarkgreatly
reduced respiratory carbon loss. Values ofRlight:Agrossdecreased from ~0.3 in both species to ~0.15 (B. nana) and ~0.05
(E. vaginatum), driven by decreases in respiratory rates, as photosynthetic rates remained stable. The influence of short-term temperature variability did not exhibit predictive trends for leaf gas exchange at a common temperature. These results underscore the influence of temperature on foliar carbon cycling, and the importance of respiration in controlling seasonal carbon exchange.
Additional keywords: Betula nana,Eriophorum vaginatum, Kok effect, photosynthesis, seasonality.
Received 9 May 2013, accepted 22 September 2013, published online 31 October 2013
Introduction
Recent climate change in the Arctic tundra has resulted in a cascade of warming-mediated ecological changes (Post et al.
2009; Wookey et al. 2009), many of which directly and indirectly impact terrestrial carbon cycling in this carbon-rich region (Shaveret al.1992; Chapinet al.1995). Among these changes, warming is associated with the lengthening of the Arctic tundra growing season through the promotion of earlier spring snowmelt (Stoneet al.2002), which is often linked to increased woody shrub cover (Chapinet al.2005; Pomeroyet al.2006), and delayed snow cover in the autumn. The potentially two-tailed extension of the snow-free season and warmer ambient growth temperatures may alter the carbon balance of this system by increasing the duration of carbon assimilation via photosynthesis and carbon release through plant and soil respiration. However, the seasonal dynamics of many aspects of the terrestrial carbon
cycle, especially at the leaf level, remain unclear. This is especially true when considering the light inhibition of respiration, which may significantly control the amount of C respired by vegetation in Arctic species (Heskel et al.
2012,2013). As the tundra becomes increasingly modified via warming, it is important to understand the relationship of foliar gas exchange, photosynthesis and respiration to seasonal timing and temperature variability in order to strengthen predictive ability for understanding C dynamics in this landscape. Previous studies have examined growing season C exchange in Arctic tundra, primarily at the ecosystem scale using data from eddy covariance (Vourlitis and Oechel1999; Vourlitiset al.2000; Lorantyet al.2011; Rocha and Shaver2011) and large chamber methods (Oberbaueret al.1998; Oechelet al.2000; Welkeret al.
2004; Sullivan et al. 2008; Natali et al. 2011). Experimental warming can enhance both ecosystem respiration and gross CSIROPUBLISHING
Functional Plant Biology http://dx.doi.org/10.1071/FP13137
ecosystem productivity, creating little difference in seasonal net ecosystem exchange and maintaining a role as a C sink, though tundra type and variations in interannual environmental conditions, such as water availability and ambient light, can influence this effect (Welker et al. 2000, 2004; Oberbauer et al. 2007; Sullivan et al. 2008). Alternatively, other cases exhibit changes of net ecosystem exchange through an increase in ecosystem respiration, leading to a C source in both experimentally warmed sites (Natali et al. 2011) and non-manipulated sites with generally warmer soil and canopy temperatures (Cahoon et al. 2012). Given the difficulty of partitioning soil and autotrophic CO2 fluxes in tundra field
studies, few studies examine the effect of experimental warming on C exchange in vegetation alone (Chapin and Shaver1996; Shaveret al.1998; Starret al.2008).
Short-term intraseason temperature responses of photosynthesis and respiration must be considered in concert with long-term warming responses to mechanistically understand and robustly predict rates of foliar and ecosystem carbon cycling in the Arctic tundra, given the highlyfluctuating temperature environment during the growing season. Short-term ambient temperature conditions may drive significant change in both ecosystem and leaf carbon balance, in addition to the current and dramatic warming trend in this region (Serrezeet al.2000). For example, foliar respiration can be sensitive to small rapid shifts in temperature and can thermally acclimate over time (Atkin and Tjoelker2003; Atkin et al.2005). In both warm-grown and warm-treated leaves, this flexibility can lead to decreased respiration compared with grown and cold-treated leaves, when measured at a constant temperature (Atkin and Tjoelker 2003). This may be attributed to reorganisation of the mitochondrial alternative and cytochrome pathways (Armstrong et al.2006b,2008; Searleet al.2011). Many factors are at play in warming Arctic ecosystems–growth forms are likely to respond to an altered temperature regime in morphologically and physiologically different ways (Gough and Hobbie2003; Heskelet al.2013) and the duration of warming may strongly influence these changes (Elmendorfet al.2012). Kornfeldet al. (2013) recently reported a significant decrease in respiration in the two focal species of our current study,Betula nanaL. andEriophorum vaginatumL., grown under the same long-term warming treatment conditions, suggesting potential thermal acclimation at a longer timescale. Although the Kornfeld et al. (2013) study demonstrated the potential role of underlying mitochondrial mechanisms in response to long-term warming treatment, it is still unclear how this long-term warming will impact temperature sensitivity at shorter time scales through the growing season.
Many aspects of the seasonality of foliar C cycling, and the influence of long-term warming and shorter-term intraseasonal temperature variation on these processes, remain unknown in the C-rich tundra landscape. In our current study, we examine foliar photosynthesis, respiration and the associated leaf traits in two abundant species,B. nana, a woody shrub, andE. vaginatum, a tussock-forming graminoid, to acquire accurate estimates of the species’contributions to the ecosystem’s carbon balance during the growing season. This study also investigates the relationship of these mechanistic responses to seasonal timing, long-term warming treatment and short-term ambient temperature
variability. Additionally, a related objective of this study was to quantify the light inhibition of respiration through the growing season. As Arctic tundra plants experience near-complete or complete 24-h photoperiods during the growing season, estimates of respiration in the light (Rlight), which account for
the known inhibition of respiration in light (the‘Kok effect’), were quantified in addition to dark respiration (Rdark). In this
study, we focus on the less frequently measured but ecologically relevantflux ofRlight,and its relationship to the more commonly
measuredflux ofRdarkto tease apart controls of light inhibition
and emphasise the importance of light inhibition in the carbon cycling of Arctic plants. Respiration in the dark is an inaccurate estimate of actual plant carbon release in the nightless growing season, but it provides a point of comparison across Arctic and non-Arctic sites and serves as an assumed uninhibited rate. We hypothesise that the seasonal dynamics of gas exchange will correspond to the energy demand of the growing vegetation: (1) rates of photosynthesis should increase as leaves develop, though this trend may be stronger in the deciduous shrubB. nanathan the evergreen graminoidE. vaginatum; (2) respiration rates will be greatest in the early growing season when energy demand for growth is highest; and (3) the elevated energy demand for growth will be associated with relaxed levels of light inhibition of respiration, as shown in elevated CO2studies (Shapiroet al.
2004; Crouset al.2012). Further, we hypothesise that growth under long-term warming will suppress the respiratory response to temperature due to thermal acclimation (Atkin and Tjoelker
2003). To test these hypotheses in tundra vegetation, we utilised global change experimental plots that have been continuously maintained for nearly 30 years by the Arctic Long-term Ecological Research (ARC LTER) site at Toolik Lake, Alaska, and measured foliar gas exchange and related leaf traits at condensed intervals over 8 weeks during the 2010 growing season. Our study represents a high temporal resolution examination of the mechanisms controlling plant carbon balance through the tundra growing season, and is thefirst to quantify the seasonal response of the light inhibition of foliar respiration, maximum rates of ribulose-1,5-bisphosphate (RuBP) carboxylation and RuBP regeneration in these common tundra species.
Materials and methods Field site and species
The study took place over 8 weeks during the 2010 growing season (6 June–28 July) at the ARC LTERfield site near Toolik
Lake (68380N, 149360W) on Alaska’s North Slope, located
254 km north of the Arctic Circle. Air temperature, relative humidity, light and precipitation were all measured and recorded at this site by the Toolik Field Station Environmental Data Center (Environmental Data Center Team2011). All leaves were sampled from experimental plots in moist acidic tundra (MAT) established and maintained by the ARC LTER since 1989 (similar to an older experiment described by Chapinet al.(2005)). The MAT site consists of four randomised blocks of 520 m treatment plots separated by a 1-m buffer arrayed two-by-two on a slightly sloped and poorly drained hillside. Leaves were sampled from control plots and plots that have been warmed via greenhouses since 1989. These wood-framed greenhouses,
covered with transparent 0.15-mm plastic sheeting, passively increase the air temperature by ~5C during the growing season.
Data on thaw depth and soil moisture, though likely influenced by the passive warming treatment as well as to influence foliar gas exchange rates, were not available for this study. The focal species for our study are common and abundant at the MAT site: Eriophorum vaginatum L. (cottongrass), the tussock-forming sedge that is widely distributed over much of Alaska’s North Slope, northern Canada and northern Eurasia, andBetula nana nanaL. (dwarf birch), a deciduous woody shrub that is also abundant and often dominant over much of the entire Arctic region.
Foliar carbon exchange
CO2 fluxes of photosynthesis and respiration were measured
using an infrared gas analyser (IRGA; LI-6400XT Portable Photosynthesis System, LI-COR, Lincoln, NE, USA). All measurements were made on clipped leaves of E. vaginatum and small branches forB. nanacollected from the long-term MAT greenhouse and control plots, re-cut under water in thefield and transported in water to the laboratory, where they acclimated to measurement temperatures as in Heskelet al. (2012). Preliminary tests on these species showed no difference in the rates of gas exchange and stomatal conductance betweenfield-measured and laboratory-measured leaves (Griffin, unpublished), as has been shown previously in other species (Mitchellet al.1999; Turnbull et al.2003). This sampling technique was required to provide a greater degree of temperature control, maximise the number of replicates and minimise the time between replicates over the short growing season and during potentially rapidly changing environmental conditions in thefield. For each E. vaginatum sample, we collected approximately 10 leaves from a single tussock in order to provide sufficient leaf area in the leaf chamber (~6 cm2). For B. nana, the one or two measured
leaves from the sampled branch that were smaller than the 6 cm2 cuvette area were measured for leaf area after IRGA measurements and gas exchange values were corrected to that area for analysis. To obtain high-resolution seasonal monitoring of gas exchange, leaves of both species were sampled from each of the four control and greenhouse plots at the MAT site (n= 4) every ~4–5 days, comprising a measurement round. For 12 days in
mid-July, there was a gap in measurement, as the equipment was being used for another research project.
Prior to measurement in the laboratory, leaves were enclosed in the cuvette at high light conditions to activate photosynthesis, though this exposure was kept to a minimum time to reduce the potential for photoinhibition. CO2assimilation was measured
under ambient (400 parts per million (ppm)) CO2concentrations
under 26 levels of PAR: 1500mmol m–2s–1, 1200mmol m–2s–1,
800mmol m–2s–1, 400mmol m–2s–1, 200mmol m–2s–1,
100mmol m–2s–1 and every 5 PAR between 100 and 0mmol
m–2s–1. This range of light fully encompasses the light
environment experienced by the species in their growth environment. Following the light response curve, leaf samples were treated to 900mmol m–2s–1 PAR and 400 ppm CO
2 for
5–10 min before CO2assimilation was measured in response to 11
levels of increasing [CO2]: ~0 ppm, 50 ppm, 100 ppm, 150 ppm,
200 ppm, 300 ppm, 400 ppm, 600 ppm, 800 ppm, 1200 ppm and
1500 ppm. Following the CO2response curve measurement and
after 10 min in darkness at 400 ppm CO2, it was assumed that no
photosynthesis or photorespiration was taking place and all CO2
flux could be attributed to mitochondrial respiration in the dark (Rdark).
All measurements were taken at a relative humidity of ~40–60%, and potential diffusion in and out of the cuvette
was accounted for, as was diffusion through the gasket, according to corrections presented in the Li-Cor 6400 Instructional Manual. The average leaf vapour pressure deficit was 0.9420.32 kPa (s.e.) for the light response curves and 1.1420.29 for CO2response curves across both species and
treatments. The cuvette block temperature was set to 20C for
all measurements to control for leaf temperature, and is representative of temperatures experienced during the growing season (Fig.1); leaf temperaturesin situranged across 19–23C
in both species. Light-saturated net photosynthetic rate (Asat) was
0
140 150 160 170 180 190 200 210 220 230
5
Fig. 1. Environmental data from the moist acidic tundra experimental plots
at the Arctic Long-term Ecological Researchfield site at Toolik Lake, Alaska, including (a) growing season maximum and minimum air temperature, (b) daily total PAR, (c) relative humidity and (d) precipitation for ambient (control; solid lines) and passively warmed (dotted lines) tundra. The vapour pressure deficit, calculated from seasonal means of relative humidity and temperature, was 0.187 kPa in control plots and 0472 kPa in warmed plots. Photosynthesis and respiration measurements were made on leaves sampled between the dashed lines (Julian days 162–209, or 11 June–28 July 2010).
estimated by fitting data from the light response curve to a rectangular hyperbolic function (Excel Solver, Microsoft, Redmond, WA, USA). CO2response curves were analysed for
the maximum carboxylation velocity of Rubisco (Vcmax) and the
modelled maximum rate of electron transfer (referred to here asJ due to data inconsistency at high CO2 levels) using the net
photosynthetic rate– internal CO2 (ci)curvefitting utility (ver.
2007.1) provided and detailed in Sharkeyet al. (2007). Examples of light and CO2response curves can be seen in Fig. S1 (available
as Supplementary Material to this paper). A portion of the replicate measurements gave inaccurate readings of CO2
saturated photosynthesis at the highest levels of CO2, limiting
statistical comparison of maximal photosynthesis. Values of photosynthesis and respiration are expressed on an area, mass and nitrogen basis.
Quantifying respiration in the light using the Kok method
To estimateRlight, we used the Kok method, which is convenient
for field measurements and can be used under ambient atmospheric conditions. This method is based on the observation that the quantum yield of photosynthesis usually decreases abruptly above a certain level of light intensity–often near the light compensation point, where carbonflux is zero (Kok
1948). This leads to a noticeable nonlinearity or‘bend’in the otherwise linear lower range of the light response curve, which is interpreted as the saturation point of light inhibition of respiration (explained in detail in Shapiroet al.2004). Since respiration is assumed to be constant above this point, an extrapolation to 0mmol m–2s–1PAR of the linear portion of the curve above this
point is assumed to giveRlight. Here, the irradiance range we used
to calculateRlightspanned 25–90mmol m–
2s–1(Fig. S1b).
The Kok method assumes that the CO2 assimilation rate
responds only to light; thus corrections must be made to account for changes in ci. As rates of photosynthesis slow
under decreasing light intensity, CO2 tends to accumulate
within the leaf, increasingci, which, in turn, affect the shape
of the light curve by decreasing the rate of photorespiration at lower light levels. We corrected all measurements to a constant ci to account for these effects according to Kirschbaum and
Farquhar (1987), as described in Ayub et al. (2011), to achieve a more accurate extrapolation ofRlight.
Short-termin situtemperature response of respiration
To estimate respiratoryfluxes underfield conditions that vary daily, we need descriptive, high-resolution thermal response curves to extend our interpretation of measurements at 20C. Following methods similar to those described by Hüve
et al.(2012) and O’Sullivanet al.(2013), we sampled leaves of both species (similar to the sampling method described above) to quantify the short-term respiratory response of leaves to measurement temperature. Data presented in this study represent replicates measured in late June on fully expanded leaves. Leaves were kept in darkness for ~30 min before measurement and then placed in a 15.511.06.5 cm water-jacketed, glass-topped aluminium chamber that was then covered by a dark fabric. Two fans mixed air within the chamber, and chamber temperature was controlled via a connected, programmable circulating waterbath (MRC300,
Melcor, Trenton, NJ, USA) that warmed from 5C to 35C
over ~45 min. Leaf temperature in the chamber was measured with a small gauge wire copper-constantan thermocouple pressed against the lower surface of the leaf and recorded via a data-logger (CR1000, Campbell Scientific, Logan, UT, USA). Dry air was passed through the cuvette at a rate of 0.45 L h–1and exited the
cuvette via tubing connected to an IRGA (LI-840A, LI-COR), which measured the flux of CO2 from the leaf. Values of
respiratoryflux were corrected for the leaf area and mass of the measured replicate. The standard equations used to calculate the temperature sensitivity of respiration (Q10), the basal
respiration rate at 10C (R
10) and a variable related to the
energy of activation calculated from values of respiration at 20C andR
10(Eo)are presented in the Supplementary Material
(Eqns S1–2).
Physical leaf traits and foliar nutrients
All leaf samples used for gas exchange measurements were measured for leaf area using a rotating-belt leaf area meter (LI-3100C Area Meter, LI-COR). Samples were then dried in an oven at 60C for a minimum of 2 days before mass was determined.
After transport to Columbia University in New York, all samples were ground, weighed and packaged for elemental analysis of [CHN] (2400 Series II, Perkin-Elmer, Boston, MA, USA).
Statistical analyses
The effect of seasonal timing on foliar gas exchange and related leaf characteristics was analysed using a linear mixed-effects model framework to perform a three-way repeated-measures ANOVA in R (ver. 2.7.0, The R Foundation for Statistical Computing, Vienna, Austria), assigning measurement round (the 4- to 5-day period when replicates from each species treatment combination were measured), species (B. nana and E. vaginatum) and warming (control or greenhouse) as explanatory variables; treatment block was treated as a random effect. Prior to analysis, data were tested for normality (Shapiro–Wilk) and heteroskedasticity (Breusch–Pagan) and
log10-transformed when necessary. Post hoc multiple
comparisons were made using Tukey’s test. To address the relationships between foliar physiological rates and ambient temperature or leaf traits, correlation analyses were employed. In addition, stepwise linear regression models that integrated the effects of species, measurement round, warming treatment and ambient temperature to assess select gas exchange variables were evaluated using corrected Akaike Information Criteria (AICc; see the Supplementary Material). For all analyses, P-values of<0.05 were considered significant.
Results
Seasonal environmental variability
Full snowmelt at the long-term experimental warming and control plots occurred by ~June 9, 2010 (Toolik EDC). During the measurement period of Julian Day 162–209 (11June–28 July),
the maximum and minimum temperature, relative humidity, light, and precipitation were highly variable (Fig.1). During this period, the highest recorded temperature (23.9C) occurred on 9 July
and the lowest minimum temperature (0.4C) after snowmelt
occurred on 6 July, merely 3 days prior. The average temperature
during the measurement period was 10.7C, with an average
minimum temperature of 4.8C and an average maximum
temperature of 14.3C. In passively warmed plots, this
translates to an average maximum temperature of 19.3C,
nearly equal to the leaf sample measurement temperature. Across the growing season, mean vapour pressure deficit, calculated from mean values of relative humidity and temperatures, was 0.187 kPa in the controls and 0.471 kPa in the passively warmed plots. Three large precipitation events occurred during the measurement period, corresponding with lower ambient air temperatures, high relative humidity and low daily PAR (Fig.1).
Specific leaf traits and chemistry
Due to the contrasting leaf forms ofB. nana, which produces small,flat, circle-shaped leaves each season, andE. vaginatum, which grows elongated, three-sided tillers that are retained through the snow-covered winter, it is not surprising the corresponding specific leaf area (SLA) measurements differ greatly between the species taken as a whole (Table 1; Fig. S2), and within both control and warming treatments (P<0.0001). Though individual measurement rounds show some variation in SLA, across the growing season, elevated growth temperature did not affect either species compared with leaves in the control (Fig. S2). Leaf C concentration was greater and much more variable inB. nanathan inE. vaginatum (P<0.0001), and warming treatment and seasonal timing (Round) did not affect this in either species (Fig. S3a,d; Table1).E. vaginatumdecreased in proportional N content as the season progressed;B. nanaalso decreased through the season, but it was less pronounced (Fig. S3). Warming did not elevate N content in either species. The species-specific trends in N caused the related increases in C : N over the seasonal course (Fig. S3).
Intraseasonal dynamics of photosynthesis and respiration
The impacts of species, warming treatment and measurement round through the season on area-, mass- and N-based gas exchange rates (measured at 20C), as expressed by the results
of a three-way ANOVA, are shown in Table 2. Variation in area-based light-saturated photosynthetic rates (Fig. 2) were primarily explained through species differences, withB. nana consistently exhibiting greater rates of carbon assimilation across all measurements, as well as when considering measurements in the warmed plots (P<0.01). Area-based Asat showed no
significant response to the measurement round (Fig.2), though
mass-based rates yielded an interactive effect of species and round (Fig. S3a–d; Table 2), suggesting the effect of leaf structural differences between the species when assessing photosynthetic rates. Only when expressed on a per-N rate didAsatvary with
measurement round, driven by the increases in per-N photosynthesis later in the season related to lower foliar N concentration (Fig. S3e–h). Similarly, there were no observed
changes in rates under long-term warming treatment in either species, and B. nana consistently exhibited higher rates in both warmed and control plots compared withE. vaginatum. If one considers the processes underlying photosynthetic efficiency, Vcmaxwas significantly affected by the interaction of species and
measurement round. Mean rates ofVcmaxinB. nana, particularly
under warming, increased slightly through the season (Fig.3). Rates ofVcmaxandJwere correlated (r2= 0.856). The ratio of
these variables,J:Vcmax, was generally 1–2 but declined through
the growing season in both species (Fig.4e–f; Table2). Across all measures of mitochondrial dark respiration,B. nana exhibited higher rates thanE. vaginatum(Table2). A significant interaction term between species and measurement round highlighted differences in mitochondrial dark respiration (area-and N-based), betweenE. vaginatumandB. nanaover the course of the growing season:E. vaginatumdisplayed a gradual decrease in rates around Day 180 (29 June) that was not observed in B. nana(Fig.2c–d). Further, considering all measurements, long-term growth warming was associated with lower rates of area-basedRdarkin both species, though this effect is only observed in E. vaginatumconsidering N-basedRdark. On a mass basis,Rdark
decreased through the growing season in both species (Fig.2c–d; Table2), with the highest mean rates for both species occurring in thefirst 2 weeks of the growing season.
Short-term high-resolution temperature response curves of Rdarkmeasured midseason showed a higher degree of thermal
acclimation to long-term elevated growth temperature in E. vaginatumthan inB. nana(Fig.3). As in the measurements made at a single temperature of 20C (Fig.2) and calculated at
10C for R
10 (Table 3), rates of respiration were generally
greater in B. nana than in E. vaginatum across the measurement temperature range from 5C to 20C. However,
over 20–35C,E. vaginatumgrown in control plots respired at
increasingly greater rates than didB. nana, which corresponded to its significantly higherQ10andEovalues (Fig.4, Table3).
One of the main objectives of this study was to obtain a better understanding of the light inhibition of respiration in these species and how this phenomenon may relate to other leaf traits. Across species and growth conditions, light significantly suppressed
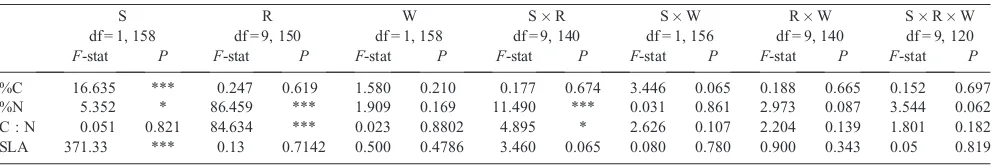
Table 1. Results from three-way repeated-measures ANOVA analysing the carbon (% C) and nitrogen (%N) concentrations and their ratio (C : N)
of dry leaf material and specific leaf area (SLA) inBetula nanaandEriophorum vaginatum
*,P<0.05; **,P<0.01; ***,P<0.001; S, species; R, round; W, warming round; df, degrees of freedom
S df = 1, 158
R df = 9, 150
W df = 1, 158
SR df = 9, 140
SW df = 1, 156
RW df = 9, 140
SRW df = 9, 120
F-stat P F-stat P F-stat P F-stat P F-stat P F-stat P F-stat P
%C 16.635 *** 0.247 0.619 1.580 0.210 0.177 0.674 3.446 0.065 0.188 0.665 0.152 0.697 %N 5.352 * 86.459 *** 1.909 0.169 11.490 *** 0.031 0.861 2.973 0.087 3.544 0.062 C : N 0.051 0.821 84.634 *** 0.023 0.8802 4.895 * 2.626 0.107 2.204 0.139 1.801 0.182 SLA 371.33 *** 0.13 0.7142 0.500 0.4786 3.460 0.065 0.080 0.780 0.900 0.343 0.05 0.819
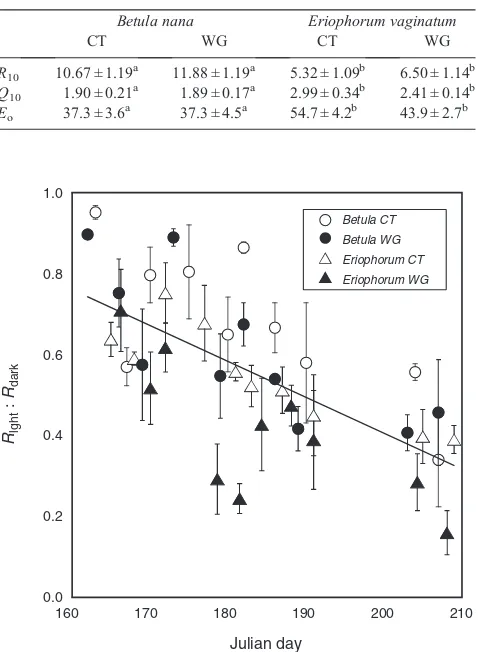
respiration rates (P<0.0001), with individual leaf values ranging widely.Rlight:Rdarkwas less inE. vaginatumthanB. nanaunder
both growth conditions (P<0.001) and decreased further under warming inE. vaginatum(P<0.01). For both species and growth conditions, Rlight:Rdark decreased over the growing season
(Fig. 5). Warming decreased rates in only E. vaginatum for area- and N-based rates (P<0.05 for both), but not mass-based rates, which found warming to significantly lower rates when considering all measurements (P<0.01). Furthermore, the effect a speciesmeasurement round interaction (P<0.05) was evident in the different trends of respiratory release over the course of the season (Fig.2e–f; Fig. S4). The ratio of carbon loss via respiration in the light to gross photosynthesis (Rlight:Agross),
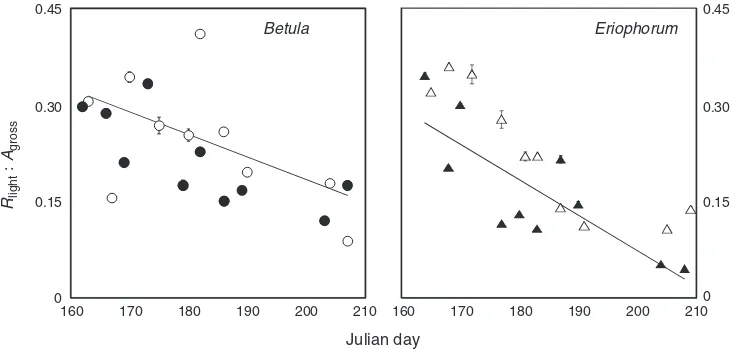
which describes the relative carbon loss from respiration compared with the total carbon cycled in a leaf (as opposed to the difference between thefluxes), decreased through the season in both species (Fig. 6), though at different rates. These proportional respiratory losses were significantly greater in B. nana than in E. vaginatum and warming significantly decreased these values, considering all measurements across the season (Table 2). No clear relationships were found between the degree of inhibition and foliar fluxes or traits in these species; regression analysis betweenRlight:Rdark, and %N, AsatandVcmaxproducedr2<0.10 (data not shown).
Intraseasonal ambient temperature influences on gas exchange
To evaluate the influence of ambient temperature on gas exchange rates, we compared multivariate linear models that incorporated temperature values from the day of, and mean temperature values
from the week before gas exchange measurement. Table S1 shows the results of models incorporating the effect of species, warming treatment, and day-of and week-before minimum, maximum and average temperatures on area-basedAsat,Rdark, RlightandRlight:Rdark, evaluating by comparing relative AICc
weights. The best model for photosynthesis (measured at 20C)
incorporates only species, with the next best only incorporating species and warming treatment, suggesting no significant effect of short-term ambient air temperature on rates ofAsat. In contrast,
bothRdarkandRlight(also measured at 20C) were more sensitive
to short-term ambient air temperatures, with the best models incorporating the effect of species, growth conditions and either the prior week’s average temperature (Rdark) or the
measurement day’s minimum temperature (Rlight; Fig. S5). The
top three models for Rlight:Rdark incorporated minimum
temperature values. When Rlight is considered alone, a clear
predictive response is not obvious (Fig. S5), though significant relationships were observed betweenRlight, and day-of minimum
temperature (P<0.01), day-of maximum temperature (P<0.01), day-of average temperature (P<0.01) and week-prior minimum temperature (P<0.01), though not with the prior week’s average or maximum temperature, suggesting greater sensitivity to short-term conditions, colder conditions or both.
Discussion
The primary objective of this study was to evaluate the mechanistic physiological responses of foliar photosynthesis and respiration to long-term warming conditions and natural variations in ambient temperature through the growing season
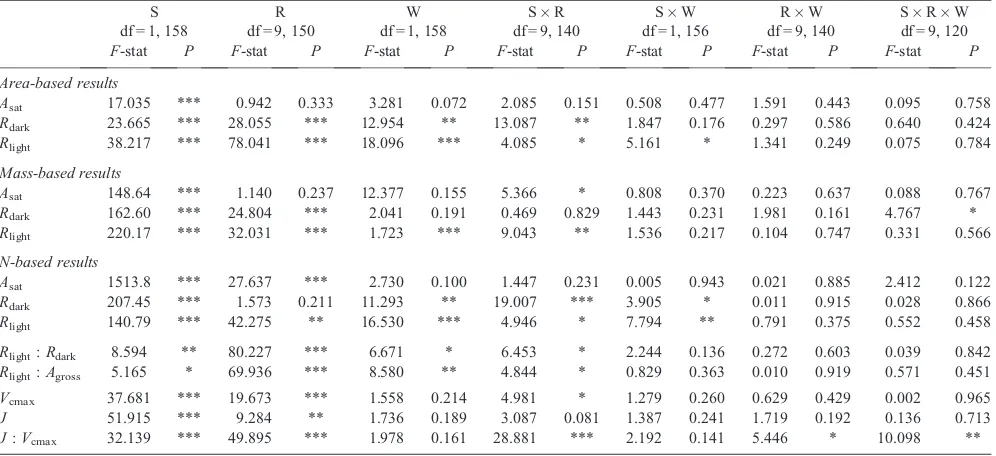
Table 2. Results from three-way repeated-measures ANOVA analysing foliar gas exchange variables, including light-saturating photosynthesis (Asat),
dark respiration (Rdark) and respiration in the light (Rlight) expressed on an area, mass and nitrogen basis; the ratio ofRlighttoRdark(Rlight:RDark);
the ratio of photosynthetic carbon assimilation to respiratory carbon release (Rlight:Agross); and the maximum carboxylation rate of Rubisco (Vcmax)
and the electron transport rate (J), both measured at ambient leaf temperature and corrected for a constant temperature of 258C inBetula nanaand
Eriophorum vaginatum
*,P<0.05; **,P<0.01; ***,P<0.001; S, species; R, round; W, warming; df, degrees of freedom
S df = 1, 158
R df = 9, 150
W df = 1, 158
SR df = 9, 140
SW df = 1, 156
RW df = 9, 140
SRW df = 9, 120
F-stat P F-stat P F-stat P F-stat P F-stat P F-stat P F-stat P
Area-based results
Asat 17.035 *** 0.942 0.333 3.281 0.072 2.085 0.151 0.508 0.477 1.591 0.443 0.095 0.758
Rdark 23.665 *** 28.055 *** 12.954 ** 13.087 ** 1.847 0.176 0.297 0.586 0.640 0.424
Rlight 38.217 *** 78.041 *** 18.096 *** 4.085 * 5.161 * 1.341 0.249 0.075 0.784
Mass-based results
Asat 148.64 *** 1.140 0.237 12.377 0.155 5.366 * 0.808 0.370 0.223 0.637 0.088 0.767
Rdark 162.60 *** 24.804 *** 2.041 0.191 0.469 0.829 1.443 0.231 1.981 0.161 4.767 *
Rlight 220.17 *** 32.031 *** 1.723 *** 9.043 ** 1.536 0.217 0.104 0.747 0.331 0.566
N-based results
Asat 1513.8 *** 27.637 *** 2.730 0.100 1.447 0.231 0.005 0.943 0.021 0.885 2.412 0.122
Rdark 207.45 *** 1.573 0.211 11.293 ** 19.007 *** 3.905 * 0.011 0.915 0.028 0.866
Rlight 140.79 *** 42.275 ** 16.530 *** 4.946 * 7.794 ** 0.791 0.375 0.552 0.458
Rlight:Rdark 8.594 ** 80.227 *** 6.671 * 6.453 * 2.244 0.136 0.272 0.603 0.039 0.842
Rlight:Agross 5.165 * 69.936 *** 8.580 ** 4.844 * 0.829 0.363 0.010 0.919 0.571 0.451
Vcmax 37.681 *** 19.673 *** 1.558 0.214 4.981 * 1.279 0.260 0.629 0.429 0.002 0.965
J 51.915 *** 9.284 ** 1.736 0.189 3.087 0.081 1.387 0.241 1.719 0.192 0.136 0.713 J:Vcmax 32.139 *** 49.895 *** 1.978 0.161 28.881 *** 2.192 0.141 5.446 * 10.098 **
in two dominant Arctic plants. We hypothesised that the within-growing season rates of photosynthesis, respiration and the inhibition of respiration will relate to growth-induced energy demand. These rates will acclimate to long-term warming and be
responsive to short-term temperature fluctuations. Our results show stronger seasonal and thermal responses in respiration than in photosynthesis (when both are measured at 20C), which was
further influenced by species differences and growth under
long-15
Betula Eriophorum
10
5
0
15
10
5
0
6
4
2
0
6
4
2
0
6
4
3
2
1
0 4
2
0 Asat
(
µ
mol CO
2
m
–2
s
–1
)
Rdark
(
µ
mol CO
2
m
–2
s
–1
)
Rlight
(
µ
mol CO
2
m
–2
s
–1
)
160 170 180 190 200 210
160 170 180 190 200
Julian day (a)
(c)
(e)
(b)
(d)
(f)
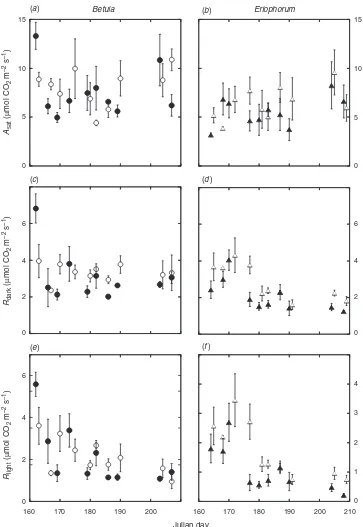
Fig. 2. (a,b)Saturating photosynthesis (Asat; measured at PAR = 1500mmol m–2s–1and 400 parts per million (ppm)
CO2), (c,d) foliar dark respiration (Rdark; measured at PAR = 0mmol m–2s–1and 400 ppm CO2) and (e,f) respiration in
the light (Rlight; estimated via the Kok method at low PAR levels) through the growing season for leaves of (a,c,e)
Betula nana(circles) and (b,d,f)Eriophorum vaginatum(triangles) grown in ambient (unfilled symbols) and passively warmed (filled symbols) conditions. All variables were measured at 20C in laboratory conditions (n= 4).
term warming. This study also provided the opportunity to expand upon existing knowledge about biotic and environmental controls on foliar Rlight, and how seasonal timing and temperature
variability may mediateRlight:Rdark. Together, thesefindings
provide a more detailed mechanistic understanding of the control of carbon exchange in tundra ecosystems.
Species-mediated influences of seasonal and environmental effects on carbon exchange
In our study, the rates of photosynthesis and respiration of B. nana, when measured at a common temperature, tended to be higher than those ofE. vaginatumduring the Arctic tundra growing season (Fig.2; Table2), grown under control conditions and long-term passive warming. The higher rates of carbon exchange in B. nana, both when measured at 20C (Fig. 2)
and over the 5–35C temperature range (Fig. 3), were
consistent with previous studies that sampled plants grown under warming at midseason (Chapin and Shaver 1996), and with the addition of soil nitrogen and phosphorus (Heskelet al.
2012). The difference inAsatbetweenB. nanaandE. vaginatum
was greatest directly after leaf out (Fig.2), which emphasises the impact of growth form on foliar physiological processes.B. nana, a deciduous woody shrub is likely to have a relatively high energy demand immediately after snowmelt to accommodate efficient aboveground and belowground growth during the short growing season, and this may be further enhanced under warming (Chapin et al.1995; Sullivanet al.2007). By contrast,E. vaginatum, a tiller-producing graminoid, can retain leaves for multiple years (Fetcher and Shaver1983) and, for this reason, may act less opportunistically upon snowmelt in the spring in terms of nutrient acquisition viafine root growth (Sullivanet al.2007) and quick leaf production. These trends are supported by previous
work on deciduous and evergreen species, where seasonal photosynthesis and respiration were consistently significantly lower in the evergreen (Owet al.2010). The species contrast is underscored by the respective leaf architectures and composition: interspecies comparisons show a less dense (greater SLA) leaf with higher N content inB. nana than in E. vaginatum(Table1, Figs S2, S3).
We found a general, though not significant, decline inAsatin
leaves sampled from long-term warming plots, suggesting a potential duration-dependent warming effect at the leaf level that may contribute to a similar lack of photosynthetic stimulation reported at the ecosystem level (Shaver et al.
2000; Elmendorfet al.2012). Also, these tundra species may be pushed beyond their photosynthetic thermal optimum under elevated temperatures (Sage and Kubien2007), which could be a likely scenario in Arctic populations that may be locally adapted for colder growth temperatures. We observed no apparent seasonal arch in theAsat,VcmaxandJrates, which can
generally characterise growing season carbon assimilation of leaves measured at ambient leaf temperatures, as previously reported (for Asat) in these species (Starret al. 2008). At the
leaf level, the highest rates ofAsat,VcmaxandJcan occur in the
early growing season (Dunganet al.2003; Xu and Baldocchi
2003). This discrepancy may be explained by the highly variable ambient temperature and precipitation conditions (Fig.1), though model evaluation found no strong relationship between photosynthetic variables (measured at 20C) and short-term
temperature values (Table S1). Also, as we measured all leaves at a common temperature (20C), we controlled for the
influence of ambient temperature on leaf temperature, which can affect photosynthetic rates, and allowed for comparison across changes in the ambient temperature to assess thermal acclimation. Respiration rates of both species were generally highest in the first few weeks after snowmelt (measured at 20C; Fig.2e
–f), which is more apparent inRlightthan inRdark,and are similar to
previously reported values (Heskel et al. 2012; Heskel et al.
2013). In bothB. nanaandE. vaginatum, higher energy demand, and potentially respiratory rates, in the early season relative to the mid- and late season may be attributable to new leaf growth and development (Vose and Ryan2002; Xuet al.2007; Owet al.
2010), and possibly a higher density of mitochondria in younger leaves (Armstronget al.2006). This respiratory release can be further enhanced by the colder ambient temperatures experienced by plants in the early growing season due to a short-term cold acclimation (Atkin and Tjoelker2003; Armstronget al. 2006). The thermal response of respiration is nonlinear and varies between species in response curve shape and slope (Fig. 3, Table 3); higher respiration in B. nana across the range of temperatures experienced during the growing season (Fig. 1) and the lack of thermal acclimation may favour its expansion in the tundra under current conditions (Heskelet al.2013). Further, the observed warm acclimation in leaves ofE. vaginatum(Fig.3) suggests lowered metabolic rates that may limit growth, despite reducing respiratory C loss under a future climate.
It should be noted that similar rates of respiration rates across species may not necessary equate to similar energy efficiency: B. nanais reported to exhibit greater respiratory efficiency than E. vaginatum through the differential use of the alternative and cytochrome pathways, potentially lending a competitive
0
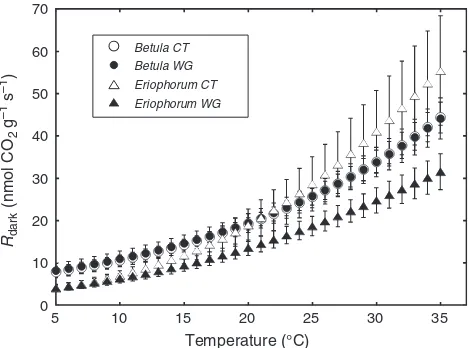
Fig. 3. The mean short-term thermal responses of foliar dark respiration
from 5C to 35C modelled from a polynomialfit from raw data inBetula
nana(circles) andEriophorum vaginatum(triangles) sampled from control (CT, open) and warmed (WG, closed) growth environments. Temperature (T) response curves of respiration (R) werefit to second-order polynomial equations as follows:B. nanacontrol,r= 0.027T2+ 0.082T+ 6.60;B. nana
warmed,r= 0.026T2+ 0.103T+ 6.77;E. vaginatumcontrol, r= 0.045T2
– 0.106T+ 3.10; andE. vaginatumwarmed,r= 0.018T2+ 0.176T+ 2.633. For
all thermal response curvefits,R2>0.990.
advantage in growth and development (Kornfeldet al.2013). In addition,Rlight:Agross, decreased over the growing season
(Fig.6), driven by lower values ofRlightas the season progressed,
rather than any significant change in photosynthesis, which is
discordant with the idea that the processes would increase in a coupled manner based on carbohydrate substrate supply and demand. Kornfeld et al. (2013) found no difference in starch and sugar content between control and warmed leaves within
0 20 40 60 80
Betula
0 20 40 60
Eriophorum
0 20 40 60 80
0 40 80 120
0 1 2 3
0 1 2 3 4
Julian day
160 170 180 190 200 210 160 170 180 190 200
(a)
(c)
(e)
(b)
(d)
(f)
Vcmax
(
µ
mol
m
–2
s
–1
)
J
:
Vcmax
J
(
µ
mol
m
–2
s
–1
)
Fig. 4. (a,b) Maximal carboxylation rate (Vcmax) and (c,d) electron transport rate (J), both measured in laboratory
conditions and corrected to a constant 25C, and (e,f) the ratio of these variables (J:V
cmax) over the growing season in
leaves of (a,c,e)Betula nanaand (b,d,f)Eriophorum vaginatumgrown under ambient (open) and warmed (filled) conditions. Values shown are means with s.e.
species when measured at a single sampling point during the growing season, though leaves ofB. nanacontained a greater concentration of both sugar and starch thanE. vaginatum. We were unable to quantify foliar carbohydrate values in these species through the season, though future studies could include this informative measurement to further relate the mechanistic links between these processes.
Both species exhibited the lowest values of Rlight:Rdark
towards the end of the season in late July (Fig.5), suggesting a potential developmental or energy demand-related control on the inhibition of respiration by light that allows for greater
respiratory energy production in the early season during leaf expansion. The only other known study that explored the seasonal response ofRlight:Rdarkobserved the lowest level of inhibition
earlier in the growing season, before the warmest month (Crous et al.2012). This response, similar to our study, despite a starkly different ecological system, supports the idea of shared seasonal timing-mediated biochemical controls on the light inhibition of respiration across species. The degree of inhibition is known to show a relaxed response under environmental conditions that can stimulate growth due to increased demand for energy and C skeletons, as exhibited under elevated CO2(Wanget al.2001;
Shapiro et al. 2004) and increased soil nutrient availability (Heskelet al.2012), though this is not always the case (Tissue et al.2002; Ayubet al.2011). Long-term warming also mediated Rlight:Rdark, with lower values observed in warm-grown
leaves, though measurement temperature can also impact these relationships (Atkinet al.2006).
Mechanistic explanations for the relationships among growth demand, cellular energy status and the degree of light inhibition of respiration have been previously reported. The environmental challenges of a short growing season and ~24-h diel light exposure in the Arctic tundra control growth rates that may then influence values of Rlight:Rdark (Bret-Harte et al. 2001; Bret-Harte et al. 2002). In the light, adenylate supply from photosynthesis may decrease the energy demand from mitochondrial respiration. Additionally, photorespiration is associated with the inactivation of pyruvate dehydrogenase, a precursor to the tri-carboxylic acid (TCA) cycle (Budde and Randall1990), though previous estimations of photorespiration in these species did notfind a strong correlation with the inhibition of Rlight (Heskel et al. 2013). The TCA cycle can also be
significantly altered in the light to support N assimilation, which effectively reduces CO2 release (Tcherkez et al.2005;
Tcherkezet al.2008; Tcherkezet al.2009). This effect may be enhanced in tundra plants when soil N is less limiting; under these conditions, growth rates increase (Bret-Harteet al.2002). The inhibition ofRlightis observed to be slightly increased in fertilised
soils (Heskelet al.2013). Additionally, the oxidative pentose phosphate pathway (OPPP), which contributes the necessary reductant for the synthesis of multiple metabolites in darkness, may be relaxed in the light when reductants are provided by photosynthesis, diminishing CO2release by the OPPP. Though
the OPPP comprises a proportionally smaller CO2flux compared
with that from the TCA cycle, in the light, this decrease may contribute to lower overall CO2 release, causing Rlight<Rdark
(Buckley and Adams2011). In our current study, the apparent relaxation of the light inhibition of respiration in leaves of both study species (Fig.5), resulting in the greatest proportional CO2
losses (Fig.6), suggesting that high growth demand for ATP and carbon skeletons outweigh potential carbon losses in the early season.
Influences of variable ambient temperature on gas exchange
In addition to quantifying the effects of long-term warming on the foliar gas exchange during the growing season, this study evaluated the influence of intraseasonal short-term temperature variability on these physiological processes. Arctic tundra growing seasons can exhibit dramatic shifts in temperature and
Table 3. Parameters describing the respiratory response to
measurement temperature in leaves ofBetula nana andEriophorum
vaginatumgrown under control (CT) and long-term warming (WG)
conditions, including Q10 (the temperature sensitivity of respiration
(estimated over 5–358C)), R10 (the basal respiration rate at 108C
(mmol CO2g–1s–1)) andE
o(kJ mol–1), a variable related to the energy
of activation calculated from values of respiration at 208C andR10
Values presented are means and s.e. Statistical differences between species and treatments are denoted alphabetically
Betula nana Eriophorum vaginatum
CT WG CT WG
R10 10.67 ± 1.19a 11.88 ± 1.19a 5.32 ± 1.09b 6.50 ± 1.14b
Q10 1.90 ± 0.21a 1.89 ± 0.17a 2.99 ± 0.34b 2.41 ± 0.14b
Eo 37.3 ± 3.6a 37.3 ± 4.5a 54.7 ± 4.2b 43.9 ± 2.7b
Betula CT Betula WG Eriophorum CT Eriophorum WG
Rlght
:
Rdark 1.0
0.8
0.6
0.4
0.2
0.0
160 170 180 190 200 210
Julian day
Fig. 5. Means and s.e. of the ratio of respiration in the light (Rlight), estimated
via the Kok method, to dark respiration (Rdark), both variables measured at
20C and 400 parts per million CO2, through the growing season inBetula
nana(circles) andEriophorum vaginatum(triangles) under ambient, control field conditions (CT, open symbols) and under a long-term passive warming treatment (WG,filled symbols;n= 4). A linear regression (y=–0.009x+ 2.19; R2= 0.47) depicts the decliningRlight:Rdarkvalues with the progressing
growing season.
precipitation within days, as was observed in this study during summer 2010 in Toolik Lake, Alaska (Fig.1), and this variability is likely to influence the temperature-sensitive processes controlling leaf carbon cycling. Respiration in both species can be highly temperature-sensitive, especially at warmer temperatures, which may become more common in a future Arctic (Fig. 3, Table 3). When modelled against the temperature of the measurement day, the average temperature of the prior week accounted for species and treatment effects, and some patterns emerged that help to characterise the nature of the temperature sensitivity of foliar gas exchange (Table S1). However, photosynthesis, which is known to respond to short-term changes in temperature infield-grown plants (Berry and Björkman 1980; Poyatos et al. 2012), did not show strong relationships to daily or weekly variation in temperature; instead, species effects explained most variation (Table S1). The underlying photosynthetic machinery maintains consistent rates of carbon assimilation (measured at a constant temperature) throughout the growing season, though daily fluctuations in temperature and precipitation experiences in the Arctic may influence in vivo rates. Plant species from alpine and Arctic ecosystems can exhibit local adaptation to the extreme variability experienced in those locations (Korner and Larcher
1988), which may translate to a limited acclimation (Atkinet al.
2006). Further, because the ambient temperature conditions from this region fluctuate so unpredictably in short periods through the season, any analysis using temperature averages of previous time windows might not be as useful for estimating thermal acclimation as they are in regions with more predictable seasonal temperature patterns (Owet al.2010; Searleet al.2011). In contrast, respiratory rates in the light and dark, when measured at a constant temperature, appeared to be more correlated with short-term ambient temperature variation. The AICcanalysis shows that the strongest model forRdarkincluded
species and warming effects, and the prior week’s average
temperature; in contrast, the strongest model forRlightincluded
the former parameters and the minimum temperature from the measurement day (Table S1). The model relationships may suggest a short-term thermal sensitivity of respiration that may be more responsive to temperature minimums, though this is not clearly reflected in regressions of Rlight with the ambient
temperature values (Fig. S5). This sensitivity of respiration to temperature minimums has been observed previously in roots as well and suggests that thermal acclimation in cold growth temperatures may regulate metabolic activity to meet the demands of growth and maintenance at the expense of greater carbon loss (Covey-Crumpet al. 2002). Low ambient temperatures did not clearly relate to the highest rates of respiration when measured at a common temperature, as would be expected under respiratory cold acclimation (Atkin and Tjoelker2003). However, it is possible that developmental timing may also play into the leaves’respiratory rates and ability to acclimate, especially inB. nanain the early season when its leaves are still expanding (Armstrong et al. 2006). Through a relatively simple modelling exercise, we found some evidence of differential temperature controls on photosynthesis and respiration in B. nana and E. vaginatum; we suggest that future work should include more detailed environmental and biotic factors, including soil temperature, daily photosynthetic radiation and leaf carbohydrate data, to more accurately inform the seasonal temperature sensitivity of foliar carbon exchange.
Conclusions and implications
The physiological measurements collected in this study allowed for the quantification of mechanistic responses in the nightless and highly variable growing season of the arctic tundra, and provided new insights into foliar carbon regulation. We present new information on the seasonal trends of foliar carbon cycling in two dominant tundra species, and relate thesefluxes to
short-0 0.15 0.45
0.30
0 0.15 0.45
0.30
Julian day
Betula Eriophorum
160 170 180 190 200 210 160 170 180 190 200 210
Rlight
:
Agross
Fig. 6. The proportional carbon loss through respiration in the light to gross photosynthesis in (a)Betula nanaand
(b)Eriophorum vaginatumover the growing season (Rlight:Agross, both variables measured at a common temperature
of 20C and 400 parts per million CO2). Linear regressions across growth conditions depict the relationship of
Rlight:Agrossand measurement date during the growing season (B. nana:y=–0.003 + 0.88x;R2= 0.30;E. vaginatum:
y=–0.005 + 1.17x;R2= 0.65). Values represent variable means and s.e.; error bars are not visible for many values due to their small value.
term temperature variability and long-term warming. Our study presents the first published values of the photosynthetic parametersVcmaxandJat multiple points during the season in
these species, which can inform and refine parameterisation of vegetation models at many scales. Also, we present thefirst report of the seasonalflexibility of the degree of the inhibition ofRlight
under long-term warmed growth conditions, in these or any species, which will enable more accurate calculations of ecosystem respiration. Based on these measurements, a seasonal estimate (not accounting for potential temperature sensitivity as discussed above; see Eqn S3) shows that neglecting the inhibition of foliar Rlight in Arctic tundra
vegetation could lead to overestimations of foliar carbon loss of ~4 mol m–2leaf (~176 g) over the growing season, or even more
(~4.2 mol m–2) when considering plants grown under warmed
conditions. Although the temperature effect on respiratory carbon loss in the light may be minimal, the overall discrepancy influxes between Rdark and Rlight must be considered for realistic
descriptions of Arctic carbon cycling. Our study contributes important data that allow for an increased understanding of dominant tundra species’ responses to environmental change, both long- and short-term, and will allow for more predictive power in models estimating ecosystem carbon storage.
Acknowledgements
We are grateful to the researchers and support staff at the Arctic LTER and Toolik Field Station for their help in this study, as well as Greg Pendergast. This study was made possible through funding from the NSF #0732664. OKA acknowledges grant support from the Australian Research Council (DP0986823).
References
Armstrong AF, Logan DC, Atkin OK (2006a) On the developmental dependence of leaf respiration: responses to short and long-term changes in growth temperature. American Journal of Botany 93, 1633–1639. doi:10.3732/ajb.93.11.1633
Armstrong AF, Logan DC, Tobin AK, O’Toole P, Atkin OK (2006b) Heterogeneity of plant mitochondrial responses underpinning respiratory acclimation to the cold in Arabidopsis thaliana leaves. Plant, Cell & Environment29, 940–949. doi:10.1111/j.1365-3040.2005. 01475.x
Armstrong AF, Badger MR, Day DA, Barthet MM, Smith P, Millar AH, Whelan J, Atkin OK (2008) Dynamic changes in the mitochondrial electron transport chain underpinning cold acclimation of leaf respiration. Plant, Cell & Environment31, 1156–1169. doi:10.1111/ j.1365-3040.2008.01830.x
Atkin OK, Tjoelker MG (2003) Thermal acclimation and the dynamic response of plant respiration to temperature.Trends in Plant Science8, 343–351. doi:10.1016/S1360-1385(03)00136-5
Atkin OK, Bruhn D, Tjoelker MG (2005) Response of plant respiration to changes in temperature: mechanisms and consequences of variations in Q10; values and acclimation. In‘Plant respiration’. (Eds H. Lambers &
M. Ribas-Carbo), pp. 95–135. (Springer: Dordrecht, The Netherlands) Atkin OK, Scheurwater I, Pons TL (2006) High thermal acclimation potential
of both photosynthesis and respiration in two lowlandPlantagospecies in contrast to an alpine congeneric.Global Change Biology12, 500–515. doi:10.1111/j.1365-2486.2006.01114.x
Ayub G, Smith RA, Tissue DT, Atkin OK (2011) Impacts of drought on leaf respiration in darkness and light inEucalyptus salignaexposed to industrial-age atmospheric CO2and growth temperature.New Phytologist 190, 1003–1018. doi:10.1111/j.1469-8137.2011.03673.x
Berry J, Björkman O (1980) Photosynthetic response and adaptation to temperature in higher plants.Annual Review of Plant Physiology and Plant Molecular Biology 31, 491–543. doi:10.1146/annurev.pp.31. 060180.002423
Bret-Harte MS, Shaver GR, Zoerner JP, Johnstone JF, Wagner JL, Chavez AS, Gunkelman RF IV, Lippert SC, Laundre JA (2001) Developmental plasticity allows Betula nana to dominate tundra subjected to an altered environment.Ecology82, 18–32.
Bret-Harte MS, Shaver GR, Chapin FS III (2002) Primary and secondary stem growth in Arctic shrubs: implications for community response to environmental change.Journal of Ecology90, 251–267. doi:10.1046/ j.1365-2745.2001.00657.x
Buckley TN, Adams MA (2011) An analytical model of non-photorespiratory CO2 release in the light and dark in leaves of C3 species based on
stoichiometricflux balance.Plant, Cell & Environment34, 89–112. doi:10.1111/j.1365-3040.2010.02228.x
Budde RJ, Randall DD (1990) Pea leaf mitochondrial pyruvate dehydrogenase complex is inactivated in vivo in a light-dependent manner. Proceedings of the National Academy of Sciences of the United States of America87, 673–676. doi:10.1073/pnas.87.2.673 Cahoon SMP, Sullivan PF, Shaver GR, Welker JM, Post E (2012) Interactions
among shrub cover and the soil microclimate may determine future Arctic carbon budgets.Ecology Letters15, 1415–1422. doi:10.1111/j.1461-0248.2012.01865.x
Chapin FS, Shaver GR (1996) Physiological and growth responses of Arctic plants to afield experiment simulating climatic change. Ecology77, 822–840. doi:10.2307/2265504
Chapin FS, Shaver GR, Giblin AE, Nadelhoffer KJ, Laundre JA (1995) Responses of Arctic tundra to experimental and observed changes in climate.Ecology76, 694–711. doi:10.2307/1939337
Chapin FS, Sturm M, Serreze MC, McFadden JP, Key JR, Lloyd AH, McGuire AD, Rupp TS, Lynch AH, Schimel JP, Beringer J, Chapman WL, Epstein HE, Euskirchen ES, Hinzman LD, Jia G, Ping C-L, Tape KD, Thompson CDC, Walker DA, Welker JM (2005) Role of land-surface changes in Arctic summer warming.Science310, 657–660. doi:10.1126/ science.1117368
Covey-Crump EM, Attwood RG, Atkin OK (2002) Regulation of root respiration in two species ofPlantagothat differ in relative growth rate: the effect of short and long term changes in temperature.Plant, Cell & Environment 25, 1501–1513. doi:10.1046/j.1365-3040.2002. 00932.x
Crous KY, Zaragoza-Castells J, Ellsworth DS, Duursma RA, Low M, Tissue DT, Atkin OK (2012) Light inhibition of leaf respiration infield-grown Eucalyptus salignain whole-tree chambers under elevated atmospheric CO2 and summer drought.Plant, Cell & Environment 35, 966–981.
doi:10.1111/j.1365-3040.2011.02465.x
Dungan RJ, Whitehead D, Duncan RP (2003) Seasonal and temperature dependence of photosynthesis and respiration for two co-occurring broad-leaved tree species with contrasting leaf phenology. Tree Physiology23, 561–568. doi:10.1093/treephys/23.8.561
Elmendorf SC, Henry GHR, Hollister RD, Björk RG, Bjorkman AD, Callaghan TV, Collier LS, Cooper EJ, Cornelissen JHC, Day TA, Fosaa AM, Gould WA, Grétarsdóttir J, Harte J, Hermanutz L, Hik DS, Hofgaard A, Jarrad F, Jónsdóttir IS, Keuper F, Klanderud K, Klein JA, Koh S, Kudo G, Lang SI, Loewen V, May JL, Mercado J, Michelsen A, Molau U, Myers-Smith IH, Oberbauer SF, Pieper S, Post E, Rixen C, Robinson CH, Schmidt NM, Shaver GR, Stenström A, Tolvanen A, Totland Ø, Troxler T, Wahren C-H, Webber PJ, Welker JM, Wookey PA (2012) Global assessment of experimental climate warming on tundra vegetation: heterogeneity over space and time.Ecology Letters
15, 164–175. doi:10.1111/j.1461-0248.2011.01716.x
Environmental Data Center Team (2011) Meteorological monitoring program at Toolik, Alaska. Toolik Field Station, Institute of Arctic Biology, University of Alaska Fairbanks, Fairbanks, AK 99775. Available at http://toolik.alaska.edu/edc/abiotic_monitoring/data_query.php
Fetcher N, Shaver GR (1983) Life histories of tillers ofEriophorum vaginatum in relation to tundra disturbance. Journal of Ecology 71, 131–147. doi:10.2307/2259967
Gough L, Hobbie SE (2003) Responses of moist non-acidic tundra to altered environment: productivity, biomass, and species richness.Oikos103, 204–216. doi:10.1034/j.1600-0706.2003.12363.x
Heskel MA, Anderson OR, Atkin OK, Turnbull MH, Griffin KL (2012) Leaf-and cell-level carbon cycling responses to a nitrogen Leaf-and phosphorus gradient in two Arctic tundra species.American Journal of Botany99, 1702–1714. doi:10.3732/ajb.1200251
Heskel MA, Greaves HE, Kornfeld A, Gough L, Atkin OK, Turnbull MH, Shaver GR, Griffin KL (2013) Differential physiological responses to environmental change promote woody shrub expansion.Ecology and Evolution3, 1149–1162. doi:10.1002/ece3.525
Hüve K, Bichele I, Ivanova H, Keerberg O, Pärnik T, Rasulov B, Tobias M, Niinemets Ü (2012) Temperature responses of dark respiration in relations to leaf sugar concentration. Physiologia Plantarum 144, 320–334. doi:10.1111/j.1399-3054.2011.01562.x
Kirschbaum MUF, Farquhar GD (1987) Investigation of the CO2dependence
of quantum yield and respiration in Eucalyptus pauciflora. Plant Physiology83, 1032–1036.
Kok B (1948) A critical consideration of the quantum yield of Chlorella-photosynthesis.Enzymologia13, 1–56.
Korner C, Larcher W (1988) Plant life in cold climates.Symposia of the Society for Experimental Biology42, 25–57.
Kornfeld A, Heskel M, Atkin OK, Gough L, Griffin KL, Horton TW, Turnbull MH (2013) Respiratory flexibility and efficiency are affected by simulated global change in Arctic plants. New Phytologist 197, 1161–1172. doi:10.1111/nph.12083
Loranty M, Goetz S, Rastetter E, Rocha A, Shaver G, Humphreys E, Lafleur P (2011) Scaling an instantaneous model of tundra NEE to the Arctic landscape.Ecosystems14, 76–93. doi:10.1007/s10021-010-9396-4 Mitchell KA, Bolstad PV, Vose JM (1999) Interspecific and environmentally
induced variation in foliar dark respiration among eighteen southeastern deciduous tree species. Tree Physiology 19, 861–870. doi:10.1093/ treephys/19.13.861
Natali SM, Schuur EAG, Trucco C, Hicks-Pries CE, Crummer KG, Baron-Lopez AF (2011) Effects of experimental warming of air, soil and permafrost on carbon balance in Alaskan tundra. Global Change Biology17, 1394–1407. doi:10.1111/j.1365-2486.2010.02303.x O’Sullivan OS, Weerasinghe KWLK, Evans JR, Egerton JJG, Tjoelker MG,
Atkin OK (2013) High-resolution temperature responses of leaf respiration in snow gum (Eucalyptus pauciflora) reveal high-temperature limits to respiratory function.Plant, Cell & Environment
36, 1268–1284. doi:10.1111/pce.12057
Oberbauer SF, Starr G, Pop EW (1998) Effects of extended growing season and soil warming on carbon dioxide and methane exchange of tussock tundra in Alaska.Journal of Geophysical Research103, 29 075–29 082. doi:10.1029/98JD00522
Oberbauer SF, Tweedie CE, Welker JM, Fahnestock JT, Henry GHR, Webber PJ, Hollister RD, Walker MD, Kuchy A, Elmore E, Starr G (2007) Tundra CO2fluxes in response to experimental warming across latitudinal and
moisture gradients.Ecological Monographs77, 221–238. doi:10.1890/ 06-0649
Oechel W, Vourlitis G, Hastings S, Zulueta R, Hinzman L, Kane D (2000) Acclimation of ecosystem CO2exchange in the Alaskan Arctic in response
to decadal climate warming. Nature 406, 978–981. doi:10.1038/ 35023137
Ow LF, Whitehead D, Walcroft AS, Turnbull MH (2010) Seasonal variation in foliar carbon exchange inPinus radiataandPopulus deltoides: respiration acclimates fully to changes in temperature but photosynthesis does not. Global Change Biology16, 288–302. doi:10.1111/j.1365-2486.2009. 01892.x
Pomeroy JW, Bewley DS, Essery RLH, Hedstrom NR, Link T, Granger RJ, Sicart JE, Ellis CR, Janowicz JR (2006) Shrub tundra snowmelt. Hydrological Processes20, 923–941. doi:10.1002/hyp.6124
Post E, Forchhammer MC, Bret-Harte MS, Callaghan TV, Christensen TR, Elberling B, Fox AD, Gilg O, Hik DS, Hoye TT, Ims RA, Jeppesen E, Klein DR, Madsen J, McGuire AD, Rysgaard Sr, Schindler DE, Stirling I, Tamstorf MP, Tyler NJC, van der Wal R, Welker J, Wookey PA, Schmidt NM, Aastrup P (2009) Ecological dynamics across the Arctic associated with recent climate change. Science 325, 1355–1358. doi:10.1126/ science.1173113
Poyatos R, Gornall J, Mencuccini M, Huntley B, Baxter R (2012) Seasonal controls on net branch CO2assimilation in sub-Arctic mountain birch
(Betula pubescensssp.czerepanovii(Orlova) Hamet-Ahti).Agricultural and Forest Meteorology 158–159, 90–100. doi:10.1016/j.agrformet.
2012.02.009
Rocha AV, Shaver GR (2011) Burn severity influences postfire CO2exchange
in Arctic tundra.Ecological Applications21, 477–489. doi:10.1890/10-0255.1
Sage RF, Kubien DS (2007) The temperature response of C3 and C4
photosynthesis.Plant, Cell & Environment30, 1086–1106. doi:10.1111/ j.1365-3040.2007.01682.x
Searle SY, Thomas S, Griffin KL, Horton T, Kornfeld A, Yakir D, Hurry V, Turnbull MH (2011) Leaf respiration and alternative oxidase in field-grown alpine grasses respond to natural changes in temperature and light.New Phytologist189, 1027–1039. doi:10.1111/j.1469-8137. 2010.03557.x
Serreze MC, Walsh JE, Chapin FS, Osterkamp T, Dyurgerov M, Romanovsky V, Oechel WC, Morison J, Zhang T, Barry RG (2000) Observational evidence of recent change in the northern high-latitude environment.Climatic Change 46, 159–207. doi:10.1023/A:1005504 031923
Shapiro JB, Griffin KL, Lewis JD, Tissue DT (2004) Response ofXanthium strumariumleaf respiration in the light to elevated CO2 concentration, nitrogen availability and temperature.New Phytologist162, 377–386. doi:10.1111/j.1469-8137.2004.01046.x
Sharkey TD, Bernacchi CJ, Farquhar GD, Singaas EL (2007) Fitting photosynthetic carbon dioxide response curves for C3 leaves.Plant, Cell and Environment30, 1035–1040. doi:10.1111/j.1365-3040.2007. 01710.x
Shaver GR, Billings WD, Chapin FS, Giblin AE, Nadelhoffer KJ, Oechel WC, Rastetter EB (1992) Global change and the carbon balance of arctic ecosystems.Bioscience42, 433–441. doi:10.2307/1311862
Shaver GR, Johnson LC, Cades DH, Murray G, Laundre JA, Rastetter EB, Nadelhoffer KJ, Giblin AE (1998) Biomass and CO2flux in wet sedge
tundras: responses to nutrients, temperature, and light. Ecological Monographs68, 75–97.
Shaver GR, Canadell J, Chapin FS, Gurevitch J, Harte J, Henry G, Ineson P, Jonasson S, Melillo J, Pitelka L, Rustad L (2000) Global warming and terrestrial ecosystems: a conceptual framework for analysis.Bioscience
50, 871–882. doi:10.1641/0006-3568(2000)050[0871:GWATEA]2.0. CO;2
Starr G, Oberbauer SF, Ahlquist LE (2008) The photosynthetic response of Alaskan tundra plants to increased season length and soil warming.Arctic, Antarctic, and Alpine Research40, 181–191. doi:10.1657/1523-0430(06-015)[STARR]2.0.CO;2
Stone RS, Dutton EG, Harris JM, Longenecker D (2002) Earlier spring snowmelt in northern Alaska as an indicator of climate change. Journal of Geophysical Research: Atmospheres107, 4089. doi:10.1029/ 2000JD000286
Sullivan P, Sommerkorn M, Rueth H, Nadelhoffer K, Shaver G, Welker J (2007) Climate and species affectfine root production with long-term fertilization in acidic tussock tundra near Toolik Lake, Alaska.Oecologia
153, 643–652. doi:10.1007/s00442-007-0753-8