DOI:10.5897/JSSEM2013.0395
ISSN 2141-2391 ©2013 Academic Journals http://www.academicjournals.org/JSSEM
Journal of Soil Science and Environmental
Management
Full Length Research Paper
The effects of tillage systems on soil physical properties
and water conservation in a sandy loam soil in Eastern
Kenya
J. M. Miriti
1*, G. Kironchi
2, A. O. Esilaba
3, C. K. K. Gachene
2, L. K. Heng
4and D. M. Mwangi
21
Kenya Agricultural Research Institute (KARI), ARC Muguga South Centre, P.O. 30148-00100 Nairobi, Kenya. 2
Faculty of Agriculture, University of Nairobi, P.O. Box 30197-00100 Nairobi, Kenya. 3
Kenya Agricultural Research Institute (KARI) Headquarters, P.O. Box 57811-00200 Nairobi, Kenya. 4
International Atomic Energy Agency (IAEA), Soil and Water Management and Crop Nutrition Section, Wagrammer Strasse 5, P.O. Box 100, 1400 Vienna, Austria.
Accepted 21 October, 2013
Soil water conservation through tillage is widely accepted as one of the appropriate ways of addressing soil moisture constraints in rainfed agriculture. A field experiment was conducted for 6 seasons (2007 to 2009) to evaluate the effects of 3 tillage practices namely ox-plough (OP), subsoiling-ripping (SR) and tied-ridge (TR) on soil physical and hydro-physical properties of a sandy loam soil. Soil surface roughness, bulk density (BD), total porosity, crust strength, saturated hydraulic conductivity, steady infiltration rates and soil water storage were evaluated. Results showed that, mean inter-row BD (1.51 Mg m-3) and crust strength (3.05 MPa) with SR tillage were 7 and 15% greater (P ≤ 0.05) than with OP, respectively. Inter-row infiltration rates for OP (7.9 cm h-1) were more than two fold greater than for SR (3.6 cm h-1) and TR (3.3 cm h-1). Soil surface roughness with TR was significantly greater than with OP
and SR tillage systems. Soil water storage for TR (222 mm) exceeded (P ≤ 0.05) that for OP and SR by 30 mm (16%) and 32 mm (17%), respectively. This study concluded that, ripping soil along planting line that are prone to surface crusting without disturbing the soil between crop rows was not effective as a conservation tillage method.
Key words: Tillage, soil physical properties, soil water conservation, sandy loam soil,infiltration rate.
INTRODUCTION
Agricultural production in the arid and semi-arid areas of Kenya is highly dependent on rainfall because water for irrigation is scarce or farmers cannot afford the technology. In order to have successful rainfed crop production in these areas, rain water conservation is essential (Barron et al., 2003). The success of on-farm soil water conservation however depends upon many soil factors such as soil bulk density (BD), porosity, soil surface sealing and crusting, surface roughness, hardpans, hydraulic conductivity, and infiltration rates as
they determine the hydrological properties of soil (Strudley et al., 2008). Soil compaction causes low porosity, reduced infiltration, increased penetration resistance and limited root growth. Soil surface roughness (configuration) influences wind and water erosion by decreasing soil detachment and transport caused by erosion (Cogo et al., 1983). Soil surface roughness can however change considerably with rain, wind and soil cultivation events (Guzha, 2004). Crusting is a soil surface characteristic that provides information
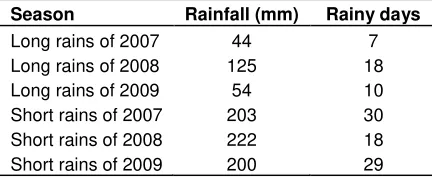
Table 1. Seasonal rainfall during the study period.
Season Rainfall (mm) Rainy days
Long rains of 2007 44 7
on soil strength or penetration resistance. Higher crust strength has been reported to reduce soil water storage due to the reduction of crust conductance and infiltration rates (Gicheru et al., 2004; Shivonje et al., 2005).
Large areas of semi-arid areas of Kenya are covered by sandy soils which are prone to crusting and compaction leading to low rain water use efficiency (Biamah et al., 1993). It has been suggested that, tillage can improve the physical and hydro-physical properties of the soils and consequently increase rainwater harvesting and crop yields (Gachene and Kimaru, 2003, Rockstrom et al., 2009, Strudley et al., 2008). Ox-plough (OP) tillage using mouldboard plough followed by hand weeding with a hoe is a common tillage method used by farmers in semi arid areas of Kenya. This tillage system has been reported to encourage crust and hardpan formation (Biamah et al., 1993; Gitau 2004). In such soils, deep tillage in form of subsoiling-ripping (SR) has been recommended to improve soil hydraulic conditions (Rockström and Lars-Ove, 1999; Soltanabadi et al., 2008). It has also been reported that, tillage practices that increase soil surface roughness such as tied ridging and ripping can increase soil water storage and availability to crop because they are able to capture rainfall and increase the time for infiltration to take place resulting in better crop yields (Guzha, 2004). The challenge faced by farmers when using tied ridging in Kenya is the high Temesgen (2007) however noted that subsoiling a sandy loam soil along crop rows with minimum soil disturbance between rows resulted in reduced yields when compared to ploughing because of increased runoff.
Soils of Kenya are diverse and there is need to determine the appropriateness of different water conservation tillage systems. Currently, there is very little information available on appropriateness of subsoiling and ripping tillage technologies on the crust prone soils widely cultivated by farmers in the dry areas. Previous studies on ripping in Kenya reported by Rockström et al. (2009) was focused on crop yields and did not study its effects on soil properties and soil moisture conservation. The objective of this study was therefore, to determine
the comparative effectiveness of SR, tied-ridge (TR) and OP tillage systems in improving soil hydraulic properties and soil water conditions in sandy loam soils in semi-arid eastern Kenya.
MATERIALS AND METHODS
Site characteristics and treatments
The field experiment was conducted at Kampi ya Mawe (1°50’S, 37°40’E, elevation 1155 m) in the experimental field of Kenya Agricultural Research Institute. Average annual rainfall is 600 mm with two peaks in April/May and in October/December (Jaetzold et al., 2006). The first and second rainy seasons were referred to as long rainy season and short rainy season, respectively. The field experiment was conducted for 6 rainy seasons: three long and three short rainy seasons between 2007 and 2009. Seasonal rainfall received at the site during the study period is given in Table 1. The soil is classified as chromic Luvisol (FAO-UNESCO, 1994) formed on undifferentiated basement system rock (gneisses). The soil surface 0 to 14 cm layer texture is sandy loam (80% sand, 7% silt, and 13% clay) with low organic carbon (0.61%) content (Table 2). The land slope at the study site was 0 to 2%.
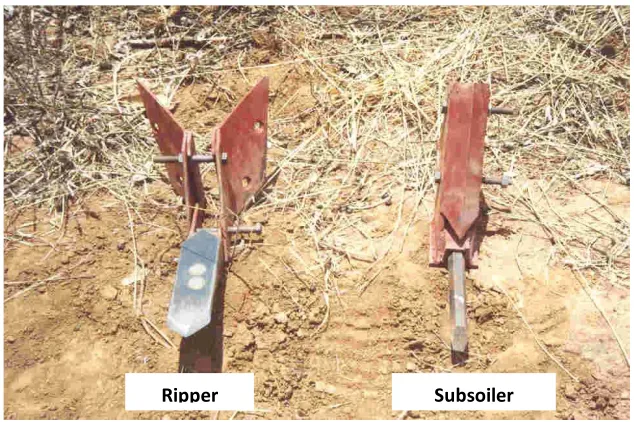
The treatments consisted of 3 tillage practices: TR, SR and OP. SR tillage (about 24 cm depth) was done along the planting line (90 cm interval) with an ox driven soil subsoiler to break the hardpan. The subsoiler and ripper used were fabricated at the University of Nairobi in the Department of Environmental and Biosystems Engineering (Figure 1). tillage treatment, the entire plot was ploughed (about 14 cm depth) using an oxen drawn mouldboard plough as practiced by farmers in the area. In each tillage method, 3 cropping systems namely sole maize (3.7 plants m-2), sole cowpea (5.5 plants m-2) and maize/cowpea intercrop (planted in the same row but in alternate hill) were compared; in a randomized split-plot design with tillage practices as the main plots and cropping systems as the sub-plots. When comparing the tillage systems, OP tillage treatment was used as control while sole maize was the control when comparing cropping systems. No crop rotation was done during the study. Each treatment was replicated 3 times. A ridge was constructed around the experimental block to prevent water run-on.
Data collection and analysis
At different stages of crop cycle, undisturbed soil cores were taken between and within crop rows for determination of soil saturated hydraulic conductivity, bulk porosity density and porosity changes. This was achieved by driving stainless steel cylinder (100 cm3,
approximately 4.0 cm in length, diameter 5.6 cm) in the soil using a hammer. The samples were then carefully trimmed both sides to the size of the cylinder and then taken to the laboratory for soil physical properties analysis. The saturated hydraulic conductivity of the soil was determined using the constant head method described by Klute and Dirksen (1982). After this determination, the soil cores were put in an oven and dried at 105°C to a constant weight. BD of the soil was calculated as the mass of dry soil divided by the core ring volume. Total soil porosity was calculated from BD as:
Porosity (%) = 1 BD 100
PD
Table 2. Soil characteristics at the Kampi ya Mawe experimental site.
Soil horizon Depth (cm) Sand (%) Clay (%) Silt (%) BD (Mg m-3) pH Organic Carbon (%)
Ap 0-14 80 13 7 1.48 6.04 0.61
AB 14-27 63 29 8 1.54 5.32 0.50
Bu1 27-50 48 39 13 1.44 5.78 0.57
Bu2 50-83 47 37 16 1.33 5.28 0.58
BC 83-94 57 23 20 1.57 5.47 0.70
C 90-106+ 61 32 7 1.59 5.32 0.72
Subsoiler Ripper
Figure 1. The ripper and subsoiler used in the study.
Where BD is the soil BD (Mg m-3) and PD is average particle density (2.65 Mg m-3).
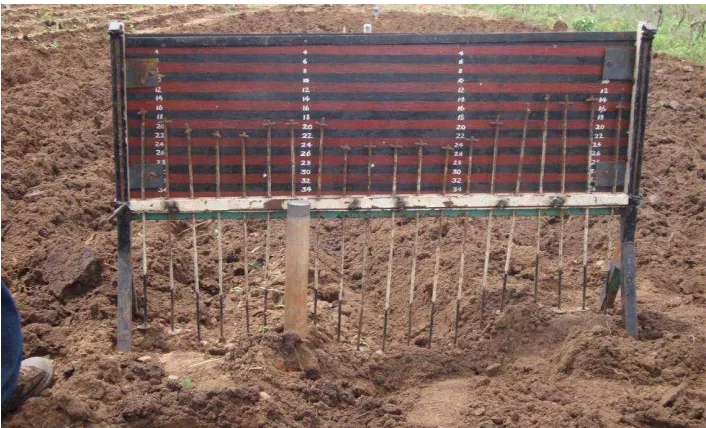
Soil surface roughness was measured immediately after the tillage operations and within the crop season. Readings were taken from 3 randomly selected positions in each plot. A pin-meter similar to that described by Moreno et al. (2008) was used to measure surface roughness (Figure 2). The instrument consisted of a graduated flat metal board on which a 130 × 90 cm frame with 20 needles that slide up and down was fitted. The spacing from one pin to the other was 20 cm. Each needle was fitted with a small foot to prevent it from penetrating the soil.
During the height measurement, the whole device was placed horizontally and the needles were then allowed to slide down until their feet freely touched the soil surface and then locked in position. The height of each of the needles above the top of the frame was recorded after taking the readings on the graduated board. The needles were then pulled up, locked and the instrument moved to the next measuring position. Measurements were replicated in 3 positions per plot and the following the formula was used to calculate surface roughness:
Surface roughness (%) = LOG STDEV
100(2)
Where LOG is the logarithm, STDEV is the standard deviation of the pin height measurements. Penetration resistance was measured at the soil surface using a hand-held cone penetrometer (Stiboka penetrograph, Eijkelkamp Agrisearch Equipment,
Netherlands). The penetration resistance was measured within and between crop rows at 13, 26, 56, and 101 days after sowing (DAS) during short rains cropping season of 2009. Ten soil crust strength measurements were taken at randomly selected positions in sole maize plot. The penetrometer springs and cone sizes were adjusted depending on the soil strength. The penetration resistance which represents the crust strength was calculated as:
s
C
CR I
A C
(3)
Where CR is the resistance (N cm-2), I is the impression on the scale (cm), Cs is the spring constant (N cm-1), AC is the area of the
cone (cm2).
Figure 2. The pin meter used in the study
80 cm of water entered the soil. Infiltration test was then continued until the time taken by 5 cm of water in big tube to enter the soil was constant. Infiltration rate and cumulative infiltrations were then calculated from the recorded data. Soil water in the profile (0 to 110 cm) was monitored using a neutron probe (CPN 503-DR Campbell Pacific Nuclear, Martinez, CA). The measurements were done weekly during the crop cycle at 15, 30 45, 60 80, and 100 cm soil depths from aluminum access tubes installed in the plot along the middle crop row.
The data was subjected to analysis of variance (ANOVA) using the Genstat (2007) software package. Significant treatment differences were obtained using Fisher’s Protected LSD test. Effects were considered significant in all statistical analysis for P
values ≤ 0.05.
RESULTS
Soil bulk density (BD) and total porosity
Soil surface (0 to 10 cm) BD and total porosity data measured between the crop rows (inter-row) is presented in Table 3. BD and porosity were significantly affected by the tillage methods. The BD after sowing was greatest in SR (1.47 Mg m-3), followed by TR (1.41 Mg m-3) and lowest in OP tillage (1.34 Mg m-3) which indicated that, OP significantly (P ≤ 0.05) reduced inter-row BD by 5% (0.13 Mg m-3) compared to untilled soil in SR plots. Initial total porosity was greatest for OP (49%) and least for SR (44%) with significant (P ≤ 0.05) differences among the tillage systems.
There was a temporal increase in inter-row BD and a decrease of soil porosity as the season progressed. The greatest increase in BD 10% (from 1.34 Mg m-3 to 1.48 Mg m-3) was recorded in the OP plots while BD changes in SR and TR plots were 6% (from 1.47 Mg m-3 to 1.56 Mg m-3) and 5% (from 1.41 Mg m-3 to 1.48 Mg m-3)
respectively, by the end of season. Total porosity also declined in similar proportions. BD and total porosity within rows was not significantly different among the tillage methods.
Saturated hydraulic conductivity and infiltration
Soil surface (0 to 10 cm) saturated hydraulic conductivity (Ks) measured between crop rows (inter-row) is presented in Table 3. The Ks in TR (0.81 cm h-1) was
significantly (P ≤ 0.05) lower than in OP (6.24 cm h-1
) and SR (4.33 cm h-1) plots after sowing. The Ks data shows that, though there was a significant tillage differences in Ks at sowing, the Ks at 30 DAS and at harvest was smaller and not significantly different among tillage systems. The overall reduction in Ks ranged from 5.61 to 0.38 cm h-1 and the greatest decline was in OP followed by SR and least in TR plots. The Ks values within crop rows were not significantly different (P ≤ 0.05) among tillage treatments during the crop cycle but they double the Ks observed in the inter-row.
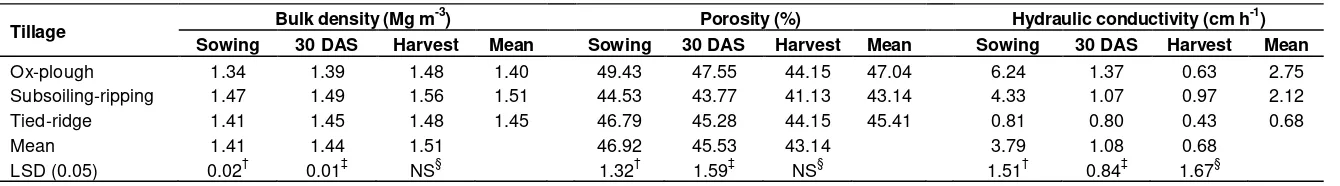
Table 3. Effect of tillage treatments on inter-row row soil surface (0 to 10 cm) BD, porosity and saturated hydraulic conductivity at sowing, 30 DAS and at harvest during the short rainy season of 2009.
Tillage Bulk density (Mg m
-3) Porosity (%) Hydraulic conductivity (cm h-1)
Sowing 30 DAS Harvest Mean Sowing 30 DAS Harvest Mean Sowing 30 DAS Harvest Mean
Ox-plough 1.34 1.39 1.48 1.40 49.43 47.55 44.15 47.04 6.24 1.37 0.63 2.75
Subsoiling-ripping 1.47 1.49 1.56 1.51 44.53 43.77 41.13 43.14 4.33 1.07 0.97 2.12
Tied-ridge 1.41 1.45 1.48 1.45 46.79 45.28 44.15 45.41 0.81 0.80 0.43 0.68
Mean 1.41 1.44 1.51 46.92 45.53 43.14 3.79 1.08 0.68
LSD (0.05) 0.02† 0.01‡ NS§ 1.32† 1.59‡ NS§ 1.51† 0.84‡ 1.67§
† = for comparing tillage means within a soil property, ‡ = for comparing date means within a soil property, §
= for comparing the interaction, NS = not significant.
infiltrations rates (5.75 cm h-1).
Soil crust strength
Soil crust strength is an important soil physical characteristic that provides information on ability to allow water movement into the soil. The temporal variations in soil crust strength with the tillage treatments during the long rain season of 2009 are shown in Figure 3. The inter-row crust strength responded to tillage and the crust strength for OP (0.15 MPa) was 213 and 166% significantly lower than for SR (0.47 MPa) and TR (0.40 MPa) respectively, 13 DAS. The crust strength increased with time in all tillage systems. When averaged across the tillage systems, crust strength at the end of the season was 4.8 MPa compared to crust strength (0.34 MPa) soon after tillage. OP maintained the least crust strength throughout the entire crop season. The low crust strength measured on 13 and 26 DAS in the TR plots was because of the loose soil deposited at the ridge basin during weeding and ridge reconstruction. In general, the crust strength recorded along crop rows was higher by a factor of 6 compared to the inter-row crust strength.
Tillage did not have a significant effect on the crust strength along crop rows.
Soil surface roughness
Soil surface roughness is an unevenness of the soil surface. Temporal variations in soil surface roughness with the tillage treatments during are shown in Figure 4. Surface roughness was significantly different among the tillage methods and the effect of tillage was largest soon after cultivation and the effect decreased as the season progressed. The soil surface roughness was consistently highest in TR (64 to 79%) tillage and lowest in OP (6 to 50%). Surface roughness soon after tillage was 79, 58, and 50 for TR, SR and OP, respectively. At the time of harvesting, surface roughness had declined to 64, 20 and 6% in TR, SR and OP plots respectively, indicating that the greatest decline was with OP, followed by SR and then TR tillage.
Soil water storage
Seasonal rainfall at the site ranged from 44 to 222
mm per season during the study period (Table 1). The short rains of 2008 was the wettest season (222 mm), followed by short rainy season of 2007 (203 mm), short rains season of 2009 (200 mm), long rains season of 2008 (125 mm), long rains season of 2009 (54 mm) and finally the long rains season of 2007 (44 mm). There were crop failures during the long rains seasons of 2007 and 2009 failed due to low rainfall and hence the 2 seasons are not discussed in this paper.
Table 4. Effect of tillage treatments on steady infiltration rates between the crop rows (inter-row) and within rows during the short rains of 2009.
Tillage Inter-row Within row
Ox-plough 7.9 37.0
Subsoiling-ripping 3.6 27.4
Tied-ridge 3.3 -
Mean 5 32.2
LSD (0.05) 1.7 NS
NS = not significant
0.0 1.0 2.0 3.0 4.0 5.0 6.0
13 26 63 101
Days after sowing
C
ru
st
s
tr
en
g
th
(
M
p
a)
ox-plough subsoiling-ripping tied-ridge
Figure 3. Effect of tillage on inter-row soil crust strength during short rains of 2009 season. Bars=LSD0.05.
seasons. The tillage × cropping systems interactions indicated that, maximum soil water content (225 mm) was recorded in sole maize grown under TR and minimum soil water content (179 mm) in sole bean grown under SR tillage system.
DISCUSSION
Soil bulk density and total porosity
The low BD and high porosity values observed in OP plots is attributed to soil disturbance during ploughing. The high initial BD in SR compared to OP is because the compacted inter-rows which were not tilled during land preparation. Though the inter-row BD after sowing was different (P ≤ 0.05) among tillage systems, it was statistically the same at the end of the season in all tillage treatments. Similar observations were reported by Šimanskaitė (2008). The temporal increase in BD during
the crop season could be due to a combination of rain drop impact and soil compaction due to repeated human traffic during weeding, data collection and other crop management activities. The exposure of the hardpan during the construction of ridges caused the observed high inter-row BD in TR plots. BD within rows was not different among tillage methods but TR maintained the lowest BD than OP and SR because of the relatively lose soil on the ridge.
Soil crust strength
0 10 20 30 40 50 60 70 80 90 100
0 12 57 101
Days after sow ing
S
u
rf
ac
e
ro
u
g
h
n
es
s
(%
)
Ox-plough Subsoiling-ripping Tied-ridge
Figure 4. Soil surface roughness decline as affected by tillage during short rains of 2009 season. Bars=LSD0.05
Figure 5. Soil profile (0 to 110 cm) water storage as affected by tillage and cropping systems (averaged for 4 seasons). Error bars =LSD0.05.
(0 to 5 cm) than in treatments where the crust were disturbed by hand hoe weeding. Crust strengths at the base of the ridge basins were higher than under OP because of the exposure of hard subsoil during the making of the ridges. The crust strength between crops rows was always higher than within crop rows due to compaction through trampling. The general increase in crust strength with time within crop rows is attributable to natural formation of crust under raindrop impact since there was minimal human interference.
Saturated hydraulic conductivity and steady infiltration rate
inter-row Ks during the crop cycle is consistent with the findings of Mwendera and Feyen (1993). They attributed the Ks decline to the increase in soil compaction and total porosity decline. The insignificant changes in Ks observed in TR are due to the exposed hardpan.
In this study, we observed that SR did not result in Clogging of macro-pores causes a discontinuity of water transmitting pores (Kooistra et al., 1984; Römkens et al., 1990). Low infiltration rates in SR tillage could also have been caused by slow lateral water movement in SR treatments because downward and outward of water during infiltration depend on the capacity of soil to transmit water both vertically and laterally (Michael, 1978). Ploughing the entire plot in the OP treatments, resulted in increased total porosity in the whole plot which probably encouraged faster water lateral movement in the plots while lateral water movement in SR tillage was restricted by the low total porosity in the unploughed sections between crop rows. These results are supported by the Guzha (2004) who reported that tilled soil gave significantly higher infiltration rates than untilled soil. The infiltration rates within crop rows were greater than the inter-row infiltrations rates due to the observed stronger crust strength and lower total porosity in the inter-row spaces.
Soil surface roughness
The high surface roughness observed in the TR is due to the raised ridges and basins created during tie ridging; while the surface roughness in SR was greater than in OP tillage because of the ripped deep furrows. The rapid reduction in surface roughness particularly in OP is a reflection of unstable soil which looses the clods formed after tillage due to raindrop impact, erosion and human interference during data collection and weeding. Lal (1997) reported that tilled sandy soils are susceptible to soil erosion after ploughing as soil aggregates are broken down leading to loss of soil structure. The clay content of the study soil at the plough layer was less than 13% implying that the soil had unstable structure. TR maintained the greatest surface roughness than the other tillage systems because the ridges were reconstructed every time weeding was done. The high surface roughness observed in TR would ensure that substantial rainfall is trapped and conserved in the soil profile.
Soil water storage
The variations in tillage effects on soil hydro-physical
properties (BD, porosity, crust strength, infiltrations, and surface roughness) led to the observed differences in soil water storage among the tillage systems. The highest soil water content recorded in TR treatments is due to increased depression water storage induced by the high surface roughness in the tillage system. According to Hansen et al. (1999), depression storage of tilled soil increases with increasing surface roughness. This was apparent in the field soon after the rains when we observed higher depression storage (water pools) in TR than in the other tillage treatments. The capacity for TR to capture and store rainfall would ensure more water will be available to crop in TR tillage than the other tillage systems (Guzha, 2004). SR tended to produce less soil water content than OP because of the low steady infiltration rates associated with the high BD and soil crust strength and low total porosity conditions developed between the crop rows under SR tillage system.
Temesgen (2007) observed that, runoff in treatments with subsoiling and furrowing along planting rows (without disturbing the soil in between) exceeded runoff in ploughed treatments which he ascribed to the high BD (low porosity) in the un-ploughed inter-row spaces. Soil water retention under SR tillage systems would probably have been improved by mulching as it protects soil structure from destruction by the raindrop impact thus, maintaining good soil porosity for infiltration (Gicheru et al., 2004). The mulching option was however not feasible at the study site because the crop residue is mainly for livestock feed.
Soil water content in cowpea sole crop was always less (P ≤ 0.05) than maize sole crop treatments, suggesting that cowpea utilized more soil moisture than maize. The observation that cowpea sole crop and maize/cowpea intercrop treatments tended to give similar soil water content implies that both treatments had similar water consumption.
Conclusion
demonstrated that maintenance of good soil porosity, infiltration and surface roughness is critical when selecting tillage systems for increased soil water conservation.
ACKNOWLEDGEMENTS
This work was supported by Kenya Agricultural Productivity Programme (KAPP), Kenya Arid and Semi-arid Lands Programme (KASAL) and the International Atomic Energy Agency (IAEA). Special thanks are due to Dr. Patrick Gicheru and Isaya Sijali of KARI-Kabete and maize yields for two semi-arid locations in east Africa. Agric. For. Met. 117:23-37.
Bhattacharyya R, Praksh V, Kundu S, Gupta HS (2006). Effect of tillage and crop rotations on pore size distribution and soil hydraulic conductivity in sandy clay loam soil of the Indian Himalayas. Soil Till. Res. 86:129-140.
Biamah E, Gichuki FN, Kaumbutho PG (1993). Tillage methods and conservation methods in East Africa. Soil Till. Res. 27:105-123. Cogo NP, Moldenhauer WC, Foster GR (1983). Effect of crop residue,
tillage-induced roughness and runoff velocity on size distribution of eroded soil aggregates. Soil Sci. Soc. Am. J. 47(5):1005-1008. FAO-UNESCO (1994). FAO-UNESCO. Soil map of the world
1:5,000,000 vol. vi. Africa UNESCO Paris.
Gachene CKK, Kimaru G (2003). Soil fertility and land productivity. Technical Handbook P. 30. RELMA/Sida Publication, Nairobi Kenya. GenStat (2007). GenStat Release 9.1, Lawes Agricultural Trust
(Rothamsted Experimental Station). GenStat Ninth Edition.
Gicheru PT, Gachene C, Mbuvi J, Mare E (2004). Effects of soil management practices and tillage systems on soil surface soil water conservation and crust formation on a sandy loam in semi-arid Kenya. Soil Till. Res. 75:173-184.
Gitau AN (2004). Mechanical behaviour of hardsetting Luvisol soil. PhD
Thesis, University of Nairobi, Kenya.
Guzha AC (2004). Effects of tillage on soil microrelief, surface depression storage and soil water storage. Soil Till. Res. 76:105–114. Hansen B, SchjØnning P, Sibbesen E (1999). Roughness indices for estimation of depression water storage capacity of cultivated soil surfaces. Soil Till. Res. 53:103-111.
Jaetzold R, Schmidt H, Hornetz B, Shisanya C (2006). Farm management handbook of Kenya.Natural conditions and farm information. Vol II, part C1- East Kenya. Ministry of Agriculture, Kenya. 2nd Edition.
Klute A, Dirksen C (1982). Hydraulic conductivity and diffusivity. In Klute, A. (Ed.), Methods of Soil Analysis. American Society of Agronomy. Agron. Monogr. 9. ASA, SSSA, Madison, WI. USA. Kooistra MJ, Bouna J, Boersma OH, Jager A (1984). Physical and
morphological characterization of undisturbed and disturbed ploughpans in a sandy loam soil. Soil Till. Res. 4:405-417.
Lal R (1997). Long-term tillage and maize monoculture effects on a tropical Alfisol in western Nigeria. I. Crop yield and soil physical properties. Soil Till. Res. 42:145-160.
Michael AM (1978). Irrigation, theory and practice. Vikas Publishing House PVT Ltd. New Delhi, India. P. 801.
Moreno RG, Diaz Alvarez MC, Tarquis AM, Barrington S, Requejo SA (2008). Tillage and soil type effects on soil surface roughness at semiarid climatic conditions. Soil Till. Res. 98:35-44.
Mwendera EJ, Feyen J (1993). Predicting tillage effects on infiltration. water productivity from on-farm action research. Soil Till. Res. 103:23-32.
Rockström J, Lars-Ove J (1999). Conservation tillage systems for dryland farming: on-farm research and extension experiences. E. Afr. Agric. For. J. 65(2):101-114.
Römkens MJM, Prasad SN, Parlange JY (1990). Surface sealing development in relation to rainstorm intensity. Catena 17:1-11. Shivonje FM, Okwach GE, Kironchi G (2005). Soil crust formation as
affected by slope gradient on clay soils of semi-arid Machakos District, Kenya. In: Mugendi DN, Kironchi G, Gicheru PT, Gachene CKK, Macharia PN, Mburu M, Mureithi JG, Maina F, (eds), Capacity building for land resource Management to meet the challenges of food security in Africa. 21st Annual Conference of Soil Science Society of East Africa (SSSEA), 1st -5th December, 2003, Eldoret, Kenya, pp. 123-136
Šimanskaitė D (2008). The impact of soil tillage minimization on sandy light loam soil. Agron. Res.6:349–357
Soltanabadi DH, Miranzadeh M, Karimi M, Varnamkhasti MG, Hemmat A (2008). Effect of subsoiling in condition of strip tillage on soil physical properties and sunflower yield. J. Agric. Tech. 4(2):11-19. Stevens PA (2000). Ripping with draught animals: IMAG-DLO
experiences in Zambia. In: Biamah, E.K., Rockstrom J. and Okwach G.E., (eds.). Conservation tillage for dryland farming. technical options and experiences in Eastern and southern Africa. Nairobi: Regional Land Management Unit (RELMA), Swedish International Development Cooperation Agency (Sida), 2000. (RELMA Workshop Report Series 3):42-53.
Strudley MW, Green TR, Ascough JC (2008). Tillage effects on soil hydraulic properties in space and time: State of the science. Soil Till. Res. 99:4–48