©
+
,-
.
/ , 0
$
%
1
2
1
3
0
-
#%1
,,
&%3
&%0
- 4
5%1)
Faculty of Fisheries and Marine Science, Brawijaya University, Indonesia
2)
Faculty of Fisheries and Marine Science, Diponegoro University, Indonesia
3)
Genetic Laboratories, Department Marine and Environmental Science, University of the Ryukyus Email: [email protected]
Received: February 24, 2014, Accepted: April 7, 2014
.16
6
The study was conducted to determine the genetic diversity of based on sequences of the COI mitochondrial DNA. Successfully 54 samples of Garut; 43 of Yogyakarta and 47 of Banyuwangi populations were amplified by PCR using universal primers LCO 1490 and HCO 2198 successfully amplified COI gene in 625 bp, with an overall haplotype totaled 64 at 111 polymorphic sites. All population showed high genetic diversity within population interpreted by the value of gene diversity (H): Garut is 0.9266 ± 0.0251; Yogyakarta is 0.9668 ± 0.0156 and Banyuwangi is 0.9288 ± 0.0257 and the value of nucleotide diversity (π): Garut is 0.007155 ± 0.003972; Yogyakarta is 0.007966 ± 0.004387 and Banyuwangi is 0.00723 ± 0.004021. Gene diversity and nucleotide diversity did not differ significantly between populations. While genetic diversity among populations interpreted from haplotypes similarity or shared haplotype. Number of shared haplotypes among three populations is 12 haplotypes with 90 samples included. Banyuwangi population showed smallest intensity interaction with other populations indicated by the smallest value of haplotypes; polymorphic sites; hetorozigosity and distribution of larvae are influenced by spatial factor. However, three populations come from one ancestors and part of a large population. Thus the current and other environmental factors in South Coast of Java Island are effected on the genetic diversity among populations of with a correlation coefficient is r = 0.98 (genetic diversity with current) and r = >0.90 (genetic diversity with temperature, salinity, pH, depth and distance).
7 - 3 : , genetic diversity, COI, mitochondrial DNA, haplotype
86 (9: 6 (8
Hermit crab is one of omnivores animal since it plays an important role in ecosystem that is as the cleaner animal and plays an important role in community structure (Eric . 2010). They are eaten by many animals higher up in the food chain. They also as scavengers and help quickly recycle dead matter on the shores. Some hermit crabs become the important export commodity that is being hunted marine aquarium enthusiasts in the world because of the beauty and uniqueness (Calado ., 2003). One of them is the which is usually called by the (Kelomang kaki biru) by supplier of aquarium ornament in Indonesia.
According to Haig and Ball (1988), was distributed along the East Coast of Africa to the Hawaiian Islands, Tuamotu Islands and Maluku Islands. But not only in the Maluku, had the animal also distributed in some rocky beaches and tidal flats along Indian Ocean (Morgan, 1991). Exportir supplier of in Java comes from Garut beach (Peungpeuk beach), Yogyakarta (Baron beach) and Banyuwangi (Blambangan beach). All of these place located in South Coast of Java (Ahyan, personal communication).
The lack of information about abundance of hermit crab in Indonesia. It is estimated that approximate 30,000 individuals per month in the period from September to March (season) and
about 5,000 individuals per month in the period from April to August (not the season).
This study is complementary of hermit crab studies previous conducted by about dynamic of tropical hermit crab assemblage (Bertness, 1981); reproduction of hermit crab (Brian, 1989); behavior of hermit crab (Coenobitidae) (Vanessa, 2008); molecular analysis of the taxonomic and distributional status for the genera and
(Mantello 2006); and paripatric speciation drives deversification and distributional pattern of hermit crab (Decapoda: Diogenidae: Calcinus) (Malay and Paulay, 2009), microhabitat distribution of the hermit crabs
and (Brian and Bach, 2010); multigene molecular systematic confirm species status of morphologically convergent Pagurus hermit crab (Silva ., 2011) and revisiting (Komai ., 2011).
©
Genetic diversity of can be affected by the discrepancy of spatial factor (Row, 2011). The study of some population of aquatic organism are determined by spatial factors, they are population size, strength of diffusion, form of aquatic and behavioral characteristics of larvae and the model of current movements (Largier, 2003). According to Dahlhoff and Rank (2000), genetic diversity related to the latitude and longitude or the gradient of tide and temperature. Among those factors, the latitude and longitude describe the spatial location of the habitat that becomes the selection factor to maintain the life and determine biologic interaction like gen flow, mutation, and gen drift. Therefore, spatial factor has an important role in determining the genetic diversity of a population by identifying the quantity of polymorphisms appearance. Genetic diversity and fenotipic comes from DNA variation and gene regulation. Furthermore Stansfield and Elrod (2007), states the amount of genetic diversity within a species depends on the number of individuals, the range of geographical spread, the rate of population isolation and the genetic systems. An important role is also performed by the processes of natural selection and the factors that affect the spatial and temporal changes in the genetic composition of a species or population. Therefore, the aim of this study was to determine how genetic diversity within population and among population in based on sequence analyzes of COI gene mitochondrial DNA and the relationship the genetic diversity among population with spatial factor in Garut, Yogyakarta and Banyuwangi.
6+ / 89 +60(9
Genetic materials used in this study were about 54 samples from Garut; 43 samples from Yogyakarta and 47 samples from Banyuwangi that were collected by purposive sampling. Leg muscle tissue samples of were taken by the autotomi method on the legs (Aoki ., 2008).
1) Extraction and amplification
Total DNA extraction and PCR amplification were carried out according to method of Hideyuki . (2004) in the Laboratory of Genetics, Department of Marine and Environmental Sciences, University of the Ryukyus in October to December 2012. These methods used for DNA extraction was the method that used in the extraction is a modified of Phenol Choloform Sambrook method.
COI gene mitochondrial DNA (mtDNA) was amplified by PCR using universal primers of LCO 1490 (51
GGTCAACAAATCATAAAGATATTGG 31) and HCO 2198 (51TAAACTTCAGGGTGACCAAAAAATCA 31) (Folmer
., 1994). This primer has been widely used to study COI gene mithochondrial DNA at invertebrates as in Sotelo . (2009a) and Sotelo . (2009b) which uses two primers above at the species of European Maja Spider Crab and and Komai . (2011) also uses it on . PCR conditions were as follows: pre denaturation 94 °C for 2 min, followed by denaturation 94 °C for 30 seconds, annealing at a temperature of 45 °C for 30 seconds, and extension at a temperature of 72 °C for 1min, cycle 30 times, then ends with a final extension at 72 °C for 7 min. Checking the results of PCR was performed by electrophoresis on 1% gel agarose.
2) Sequencing COI gene of
Sequencing was performed by the sequencing principle of dideoxy Sanger method using Automatic DNA sequence CEQ 8800 with star kit (Beckman Coulter). Sequencing COI gene by using Clustal X (version 2.1) to align the sequences results (Thompson ., 1997); Arlequin to determine haplotipe and nucleotide diversity in the population (Tajima, 1983); AMOVA (Analysis Moleculer of Variance) to analyze population structure (Excoffier ., 1992) and MEGA version 4.0 (Molecular Evolutionary Genetic Analysis) to create a phylogeny tree by method, where the matrix calculation of genetic distance with model of Kimura 2 parameters were implemented on the pair wise distance calculation (Tamura ., 2007). While to know the relationship between genetic diversity with the environment, then tested the correlation and regression between genetic diversity with spatial factors, so known the degree of correlation of r value.
+1:/6 89 9 1 :11 (8
Genetic diversity of in nature can be seen by composition and proportion of nucleotide bases, the total of haplotype, the total of polymorphic loci, the total of alleles per loci and heterozygosity value. The results of analysis the genetic diversity among populations of in the sequences of COI gene DNA mitochondrial of from three different populations is shown in Figure 1.
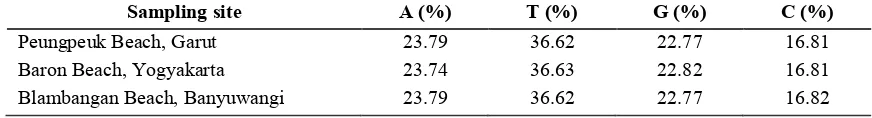
The frequency of the total composition of nucleotide base of 144 sequences of COI gene mitochondrial DNA of
at each location as listed in Table 1 below: :
Table 1. The number of nucleotide base as the results of sequencing at each sampling site
1 , $;% 6 $;% < $;% $;%
Peungpeuk Beach, Garut 23.79 36.62 22.77 16.81 Baron Beach, Yogyakarta 23.74 36.63 22.82 16.81 Blambangan Beach, Banyuwangi 23.79 36.62 22.77 16.82
Figure 1. Comparison of average samples, haplotypes, polymorphic sites, allel, gene diversity (H), nucleotide diversity (π) and heterozigosity (Ho/He) in three sampling location
The frequency of A T base composition that is equal to 60.39% and by G C bases at 39.61%. The frequency of A T base that greater can affect polymorphism level the fragment sequences of COI gene on mitochondrial DNA of . This is because the composition of the nucleotide bases associated with the use of codons that encode proteins. Boore (2006) suggests that the protein coding genes in the mitochondrial DNA of the animals showed a tendency to use codons with percentage more of A T base. The greater the frequency of AT base composition, then it is more likely appear the codon variations as a result of appearance of the variations anucleotide.
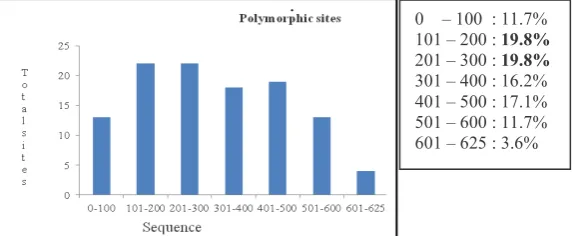
Polymorphic sites (S) or segregation sites is a nucleotide positions that showed variations or differences between the sequences in the m samples (Nei and Kumar, 2000). Long sequences of COI gene in mitochondrial DNA of as a whole that gained is 625 bp and obtained 111 polymorphic sites. The percentage of polymorphic sites with long sequences is equal to 17.76%.
Distribution of polymorphic sites the mitochondrial COI DNA sequences generated from this study are presented in graphical form in Figure 2.
Calculation of transition and transversion nucleotide bases using AMOVA, COI gene DNA mitochondrial is shown in Table 2.
.
Figure 2. The polymorphic sites distribution of COI Mitochondrial DNA sequences of . The highest polymorphic sites at sequences between 101 300. This shows the level of mutation in the sequence was higher than the range of the other sequences.
Table 2. Transition and transversion nucleotide COI gene DNA mitochondrial on population in Garut, Yogyakarta and Banyuwangi
1 , / 6 $6 % 6
$6 %
6
Peungpeuk beach, Garut 39 1 40
Baron beach, Yogyakarta 39 2 41
Blambangan beach, Banyuwangi 30 30
Bio geographical differences can be seen from the results of the data processed satellite imagery with basic water and land conditions that can be barrier/ barrier interaction between populations. The results of measurements from field are presented in Table 3.
Peungpeuk beach in Garut have character of types steep coast, rocky hard and big, strong flowing, and big waves. Hermit crab which living on Peungpeuk beach is much seen if the beach in low tide conditions. Baron Beach in Yogyakarta also has the character of a steep and rocky limestone, flowing tend to be quieter and a little waves. This beach has mossy
puddle where many hermit crabs live in the puddle. The waves are crushed by the mountain that just into the sea, so waters tend to be calm. While Blambangan beach in Banyuwangi has a character that is not steep. The waves crushed by small hills in the middle of the beach. The rocks that are on the beach are the limestone as the result of hills erosion by the sea water. The farther away from the shore, the stronger water flow. Flow at these waters is a current mixing of the Indian Ocean and Bali Strait.
Specifically, the environment determines gene flow that occurs both within populations and among populations
0 – 100 : 11.7% 101 – 200 : #= ';
201 – 300 : #= ';
©
separated. This is supported by the stadia of the species life cycle that most likely to be influenced by the environment and the dominance of the gene at the time of the spreading. Environmental influences have likely only genetically through the composition of bases or it can directly appear as the nature in the phenotype.
There are two variables that describe the genetic diversity called the haplotype variation and nucleotide variations. The haplotype variation often called a gene variation which is a
subject of random variation refers to the change in frequency of haplotype (Nei and Tajima, 1981). The total haplotypes is 64, with 12 of them are shared haplotypes between populations and 42 haplotypes are local haplotypes at one sampling location either in Garut, Yogyakarta and Banyuwangi. 90 samples were including in 12 shared haplotypes.
Genetic diversity in this study was classified into genetic diversity within populations and among populations. Each the genetic diversity is caused by different factors.
Table 3. Environment parameter measurement in Peungpeuk Beach, Garut; Baron Beach in Yogyakarta and Balambangan Beach, Banyuwangi
1 , ! -Pantai Blambangan, Banyuwangi 28.1 32.3 40.3 108.5 8.04
, &' &5 5& &@ 5# A5 =A A@ ' &)
! " # $
Overall, the sampling locations have a high gene diversity in Garut population is 0.9266 ± 0.0251; Yogyakarta 0.9668 ± 0.0156; and Banyuwangi 0.9288 ± 0.0257. The differentiation of gene diversity quantity in each population has a distant
range, so it would not give any information about the significant differentiation in gene exchange among individual of the population as a proof that environment factors does not restrict the random mating in the population. The value of gene diversity is followed by value of
nucleotide diversity of each population.
Table 4. Comparison of gene diversity and nucleotide diversity
B < C ,- 4 . - 3 ,
Gene diversity (H) 0.9266 ± 0.0251 0.9668 ± 0.0156 0.9288 ± 0.0257 Nucleotide diversity (π) 0.007155 ± 0.003972 0.007966 ± 0.004387 0.00723 ± 0.004021
High value of nucleotide diversity indicates that genetic diversity appeared and the population formed for a long time and reflects the large size of the population. Instead, a low nucleotide diversity indicate that genetic diversity and population formed at that time is not long (newly formed) and reflects the relatively small size of the population (Barber . 2000). The number of samples analyzed did not affect nucleotide diversity obtained. Nucleotide diversity is also independent of the sequence length. So the nucleotide diversity is an accurate parameter to describe the genetic diversity, and the nucleotide diversity is independent of the sample size and the length of DNA.
In general, genetic diversity comes from mutation events that change the order of the nucleotide bases in a DNA chain. According to Stansfield . (2006), mutations are changes to the genetic material that can be inherited and can come up with alternative forms of a gene are called allele. These changes can affect the phenotype and individual response to a particular environment. Mutation of genes at the nucleotide level is called a point mutation. In this study, the overall genetic diversity comes from events with a point mutation at nucleotide base differences in each individual.
Comparative temporal can not be done in this study, but comparison with the species of crab % by Aoki (2008), collected from the population of Tokushima; Fukuoka; Saga; Kochi; Kagoshima; Okinawajima; Taipei; and Tungkang indicate that the Okinawajima population has smallest random mating among populations as geographically isolated so that
only the low value of genetic diversity among populations. Population in Okinawajima only has the genetic diversity of 0.2539, whereas genetic diversity in populations other value greater than 0.7700.
! " #
Haplotype indicated the differentiation and variation of sequence. Gene diversity among population is interpreted from similarity haplotypes among the population that is illustrated by shared haplotype. Shared haplotype is an indication of the existence of gene flow that happens among the population. Allele migration through gene migration will effected the interaction and recombination with domestic alleles through sexual reproduction randomly. Gene flow and migration among the population showed were collected in all sampling sites still involve in a big population.
with the percentage of polymorphic sites which is the total number of sequence mutations. Polymorphic sites of Banyuwangi population also have the least percentage (30 sites) compared with two other populations (Garut 40 sites and
Yogyakarta 41 sites). This is the illustration of heterozygosity, the number of haplotypes and polymorphic sites of Garut, Yogyakarta, and Banyuwangi population in Table 5.
Table 5. Comparison of Haplotypes, Polimorpic sites and Heterozigosity
B < C ,- 4 . - 3 ,
Σ Haplotype 28 30 25
Σ polymorphic site 40 41 30
Heterozigosity observed (Ho) 0.00715 ± 0.04461 0.00797 ± 0.04576 0.00723 ± 0.4522 Heterozigosity expected (He) 0.11179 ± 0.14088 0.12144 ± 0.13614 0.15066 ± 0.14713
Ho / He 0.064 0.066 0.048
Although those three populations has interaction by migrating each other, but the number of haplotypes and polymorphic sites of Banyuwangi population that is smaller than other population shows that the intensity of the interaction is lesser. It is may happened because the influence of spatial factor that determines the distribution like the current factor.
Genetic differences of among the three populations based on the average genetic distance matrix reflected the genetic relationship between these haplotype. Determination of the genetic relationship of these three populations is needed to determine the relationship haplotype of the three different populations. OTU (Operational Taxonomic Unit) with haplotypes alternative link
from three different populations is shown in Figure 3. :
Figure 3. Dendogaram Haplotype on Population in Garut (G), Yogyakarta (Y) and Banyuwangi (B). Phylogenetic tree dominance among populations is difficult to describe
Based on the output AMOVA calculations, the three populations of have FST value of 0.00230. This indicates that as much as 0.23% of the total variation in the observed gene resulting from differences between groups, and up to 100% (overall) of the gene diversity is a variation of the individuals in the group.
Gene flow occurs between populations affected by natural conditions. The existence of stonewall/ barrier that hinders the movement of the flow leads to a place making gene flow uninterrupted. Gene flow is often described as gene migration. Migration alleles through migration will lead to the interaction of genes and recombination with domestic alleles through random sexual reproduction.
Table 6. P value in allele frequencies (above diagonal) and Nei’s genetic distance (below diagonal) among three localities of correction P < 0.05
B < C , 4 . - 3 ,
Garut *** 0.19091 0.29091
Yogyakarta 0.00015 *** 0.57273 Banyuwangi 0.00165 0.00988 ***
Anova (Analysis of variance) results of regression analysis and correlation parameters of the flow current, pH, salinity, temperature, depth and distance of separation by affected genetic diversity at a location with r values above 90%. Flow of water strong affect at 0.98 correlation coefficient. This means that as much as 95% (R2=0.95) movement of flow both the strength, flow direction and the flow will affect the genetic diversity that appears in . With planktonic stadia
about 21 days, flows are able to contribute carrying the larvae to the other regions.
©
through gene flow would cause an interaction and recombination with domestic alleles through random sexual reproduction. High genetic diversity also indicates the high intensity of the process of random mating in the population. Adult phase for hermit crab is more stable the movement because of a little the influence of the flow received so that the adult of hermit crab did not have the ability to migrate by walking up to a habitat away. In the adult phase is the result of interaction when the planktonic phase will be seen from the alleles of the offspring.
There are two possible explanation that caused by the alleles migration that possible from random mating. Dispersed species to a distant place not determine the possibility of gene flow if domestic genes originally not scraped by environmental influences (flow) or gene interaction due to random mating. Conversely if the original gene can not survive with the new habitat and interactions with other individuals, it will appear alleles as new genetic diversity that appears in these habitats.
(8 /:1 (8
Garut, Yogyakarta and Banyuwangi populations have high genetic diversity within population interpreted by the value of gene diversity (H): Garut is 0.9266 ± 0.0251; Yogyakarta is 0.9668 ± 0.0156 and Banyuwangi is 0.9288 ± 0.0257. While genetic diversity among populations interpreted from haplotypes similarity or shared haplotype. Banyuwangi population has lower interaction with others, it showed by lowerhaplotype, polymorphic site and larva dispersion. three populations come from one ancestors and part of a large population.
78( /+9<+ +861
This research was partly funded by the International Graduate Program for Asia Pacific Region, University of the Ryukyus. We especially thank Professor Imai Hideyuki for accepting Muliawati Handayani in his laboratory and thank also due to his Assistant, Muhammad Fadry Abdullah for his assistance. We are grateful to Professor Ambariyanto M.Sc for their helpful insight. We thank to reviewers for critical and editorial comment to the manuscript.
+2+ +8 +1
Ahyan. Personal Communicator collected at 24th Agust 2012
Aoki, M., J. Naruse, J. Cheng, Suzuki, and Hideyuki I. 2008. Low Genetic Variability in an Endangered Population of Fiddler Crab % on Okinawa Island (Analysis of mtDNA). Fish Sci 74: 330 340.
Barber, P.H., S.R. Palumbi, M.V. Erdmann, and M.K. Moosa. 2000. A Marine Wallace’s line?. Nature 406 (17): 2 4.
Bertness, M.D. 1981. Dynamic of Tropical Hermit Crab Assemblage. Ecol Soc Aml 62 (3): 751 761.
Boore, J.L. 2006. The Complete Sequence of The Mitochondrial Genome of
(Mollusca: Cephalopoda). BMC Genomics 7 (182): 1471 2164.
Brian, H.A. 1989. Mating Success of Male Hermit Crabs in Shell Generalist and Shell Specialist Species. Behavioral Ecol Soc 25: 119 128.
Brian, H.A., and C.E. Bach. 2010. Microhabitat Distribution of The Hermit crabs and . Pacific Sci 64 (3): 441 447.
Calado, R., J. Lin, A.L. Rhyne, R. Arau and L. Narciso. 2003. Marine Ornamental Decapods – Popular, Pricey and Poorly Studied. Journal of Crustacean Biology 23 (4): 963 973.
Dahlhoff, E.P., and N.E. Rank. 2000. Functional and Physiological Consequences of Genetic Variation at Phosphoglucose Isomerase: Heat Shock Protein Expression is Related to Enzyme Genotype in a Montane Beetle. Proceeding of National Academy of Science USA 97 (18): 10056 10061.
Folmer, O., M. Black, W. Hoeh, R. Lutz, and R. Vrijenhoek. 1994. DNA Primers for Amplification of Mitochondrial Cytochrome C Oxidase Subunit I from Diverse Metazoan Invertebrates. Mol Mar Bio Biotechnology 3 (5): 294 299.
Eric, G., Johnson, A. George, H.H. Anson, M.K. Desmond, N. Romuald, Lipcius, C.M. John, A.M. Gretchen, J.M. Thomas, S. Eric, D.S. Jeffrey, Jacques van M., Z. Yonathan M.R. and Gina. 2010. Ecosystem based fisheries management for Chesapeake Bay: Blue Crab background and issues briefs. Maryland Sea Grant, UM SG TS 2010 04.
Excoffier, N.C., P.E. Smouse, , and J.M. Quattro. 1992. Analysis of molecular variance inferred from metric distances among DNA restriction data. Gen 131: 479 491.
Haig, J., and E. Ball. 1988. Hermit crabs from North Australian and Eastern Indonesian Waters (Crustacea Decapoda: Anomura: Paguroidea) Collected during the 1975 Alpha Helix Expedition. Records of the Australian museum 40:
Hideyuki, I., J.H. Cheng, K. Hamasaki and K. Numachi. 2004. Identification of Mud Crab (Genus Scylla) Using ITS 1 and 16S Rdna Markers. Aquat Liv Res 17: 31 34.
Komai T, Chen hui Y, Junju O and Tin Yan Chan. 2011. Revisiting (Stimpson 1858) (Crustacea: Decapoda: Anomura: Paguridae). Zootaxa 3096: 41 52.
Largier, J.L. 2003. Considerations in Estimating Larval Dispersal Distances from Oceanographic Data. Ecological Applications 13 (1): 71 89.
Lee, S. 2004. Sequence Comparisons of 28S Ribosomal DNA and Mitochondrial Cytochrome C Oxidase Subunit I of
& ' $ , & ' and & & .
Kor J Parasitol 42 (3): 129 135.
Mantelatto, F.L., R. Robles, R. Biagi and D.L. Felder. 2006. Molecular Analysis of The Taxonomic and Distributional Status for The Hermit Crab Genera Loxopagurus Forest, 1964 and Isocheles Stimpson, 1858 (Decapoda, Anomura, Diogenidae). Zoosystema 28 (2): 495 506.
Morgan, G.J. 1991. A Review of The Hermit Crab Genus Calcinus Dana (Crustacea: Décapota: Diogenidae) from Australia, with Descriptions of Two New Species. Department of Aquatic Invertebrates. Western Australian Museum. Francis Street, Perth, WA 6000.
Nei, M., and F. Tajima. 1981. DNA Polymorphism Detectable by Restriction Endonucleases. Genetics, 97 (21): 145 163.
Nei, M., and S. Kumar. 2000. Molecular Evolution and Phylogenetics. Oxford University Press; New York.
Nugroho, A.R. 2012. Study of Genetic Variation of Asian Moon scalop (( ) in North shores Central Java by Allozyme Markers in Case to Marineculture’s Develop. Thesis. Diponegoro University; Semarang. p. 90.
Row, J.R. 2011. Origins of Genetic Variation and Population Structure of Foxsnakes Across Spatial and Temporal Scales. Thesis. Queen’s University Kingston; 32 89.
Silva, J.M., A. Dos Santos, R.C. Marina, Filipe O Costa S.G.R. and Carvailo. 2011. Multigene Molecular Systematic Confirm Species Status of Morphologically Convergent Pagurus Hermit Crab. PLoS ONE 6 (12)
Sotelo, G., M. Ploma, and P. David. 2009. Molecular phylogeny and biogeography history of the European Maja Spider Crab (Decapoda, Majidae). Mol Phyloge and Evol 30: 1 6.
Sotelo, G., M. Ploma and P. David. 2009. Low Mitochondrial Diversity and Lack of Structure in The Velvet Swimming Crab Along the Galician Coast. Mar Biol 156: 1039 1048.
Stansfield, W., C. Raul and C. Jaime. 2006. Molecular Biology and cell. Erlangga; Jakarta. 198 213.
Stansfield, W. and S. Elrod. 2007. Genetic, (Translated by Damaring Tyas W). Erlangga; Jakarta. 90 101
Tajima, F. 1983. Evolutionary Relationship of DNA Sequences in Finite Populations. Genetic 105: 437 460.
Tamura, K., J. Dudley, S. Kumar, M. Nei, and S. Kumar. 2007. MEGA4: Molecular Evolutionary Genetics Analysis (MEGA) Software Version 4.0. Mol Biol and Evol 8: 1596 1599.
Thompson, J.D., T.J. Gibson, F. Plewniak, F. Jeanmougin, and D.G. Higgins. 1997. The Clustal X Windows Interface: Flexible Strategies of Multiple Sequence Alignment Aided by Quality Analysis Tools. Nuc Acid Res 24: 4876 4882.