Abstract At the aim to clarify the relationship between the sandbar formation and lithogeneous sediment discharges, the sedimentological aspects of the Mesjid River Estuary are revealed by various analysis. he samples of bottom surface sediments and the suspended sediment were collected at 50 stations in the estuary using grab and van dorm samplers. Oceanographic observation were also carried out at the stations. he Mesjid River Estuary receives lithogeneous sed-iments mainly from the Mesjid River’s drainage areas which play important role on the formation of sandbar which is shown by a belt-like area (0.5-1.0 m depth) in the area of the river mouth. he sandbar might become a sandbank in 20 to 40 years later. High suspended sediment up to 354.61 mg/l indicates the river mouth receives lithogeneous sediments. Total of 926 ton/day of the sediments supplied by the river are deposited 0.024 m/year into the area.
Abstrak Berbagai analisis aspek-aspek sedimentologi dilakukan untuk mengklariikasi hubungan antara pembentukan
sandbar dan pemasukan sedimen lithogeneous di daerah Estuaria Sungai Mesjid. Sampel sedimen dasar dan sedimen tersuspensi diambil dari 50 stasiun tersebar di estuaria tersebut menggunakan grab dan van dorm sampler. Parameter oceanograi juga diukur pada setiap stasiun. Daerah Estuaria Sungai Mesjid menerima suplai sedimen lithogeneous domi-nan dari Sungai Mesjid yang berasal dari daerah tangkapannya, menjadi sumber utama pembentukan sandbar di daerah depan mulut sungai berbentuk seperti sabuk. Daerah seperti sabuk ini merupakan sandbar dalam proses pembentukan, memiliki batimetri paling dangkal 0,5-1,0 m dan diduga akan menjadi sandbank dalam kurun waktu 20-40 tahun. Suplai sedimen lithogeneous ditunjukkan oleh nilai sedimen tersuspensi pada mulut sungai sangat tinggi mencapai 354,61 mg/l. 926 ton/hari sedimen tersebut disuplai oleh sungai ini dan diendapkan dengan kecepatan 0,024 m/tahun di daerah depan mulut sungai.
Keywords:Bottom surface sediments, Bottom character, Suspended sediment, Sediment discharge, Sedimentation
rates.
Kata kunci: Sedimen permukaan dasar, Sedimen tersuspensi, Pemasukan sedimen, Kecepatan pengendapan, Karakter
dasar perairan
1.Introduction
An estuary is a partially enclosed coastal body of water that is either permanently or periodically open to the sea and which receives at least periodic discharge from a river(s), and thus, while its salinity is typically less than that of natural sea water and varies temporally and along its length, it can become hypersaline in regions when evaporative water loss is high and freshwater and tidal inputs are negligible [Potter at al., 2010]. he estuary serves as a temporary storage reservoir for materials contributed from the watershed [Gebert et al., 2013] Estuary may periodically receive large amounts of terrigenous sediment from the whole catchment during heavy rain and that extreme erosion events caused by intense local rain storms may produce looding and massive sediment deposition from relatively small parts of the catchment [Gibbs and Bremner, 2008]. he Mesjid River Estuary is located in the eastern
Rifardi and Yeeri Badrun
Department of Marine Sciences, Faculty of Fisheries and Marine Sciences, Riau University, Pekanbaru, Riau, Indonesia
Department of Biology, Faculty of Mathemathic and Natural Scienc-es, Muhammadyah University, Pekanbaru, Riau, Indonesia Correspondent email:fardi64@yahoo.co.id
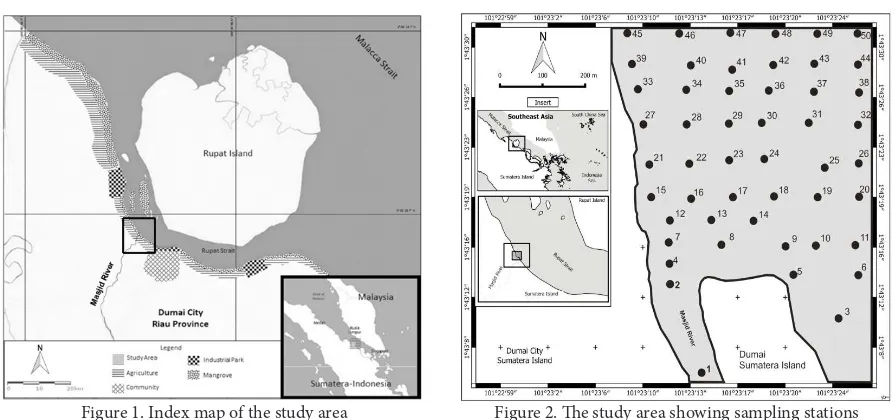
at al. [2015]; Merian at al. [2016]; and Putra et al. [2017]. However, there is no any study concerning to the sediment discharge and depositional rates. he objective of this study is to clarify the relationship between the formation of sandbar and lithogeneous sediments discharge, based on the sedimentary environment featured by sediment distributions and oceanographic observation, and analyses of sediments transported from the Mesjid River and the sedimentation rates in the estuary. Physiographic setting. he Rupat Strait, is separated from Malacca Strait by Rupat Island, is located on the eastern coast of Sumatera Island, Riau Province. he Rupat Strait, located between Sumatera Island and Malacca Strait, it is elongated and has northward, southward-openings with a length of about 88 km from north to south and a width of about 8 km. h e outlets are leading to Malacca Strait (Figure 1). he area studied is restricted to the Mesjid River Estuary and its surrounding area in the Rupat Strait, located within the lines of 01°43’5.99’’N and 01°43’31.58’’N Lat. and 101°23’8.33’’E and 101°23’26.20’’E Long. (Figure 2). he area studied has a rather lat bottom topography and is inluenced by water masses from the Mesjid River and Malacca Strait by tidal currents and anthropogenic activities, and the bottom topography gets gradually deeper northeastwards. he river with rather large drainage areas, lows into estuary of the area. he coastal zone of the estuary is characterized by mangrove vegetation, such as Avicennia sp, Rhizopora sp. In addition, the remains of mangrove vegetation can be found along the coastal line of the estuary which is under the inluence of longshore currents [Rifardi, 2001].
2.he Methods
he samples of bottom surface sediment and the suspended sediment were collected from 50 stations
2015. he positions of the sampling stations were determined by using the Global Positioning System (Figure 2). Oceanographic observation was also carried out to measure velocity and direction of tidal current, depth and salinity at 50 stations. All bottom samples were collected by using grab sampler. he samples were used for analysis of mechanical grain size. he gravel and sand proportions were determined by sieving and were weighed oven dried (Rifardi et al.,1998). he settling tube method was utilized to determine the mud proportion. he graphical method was used to calculate the mean diameter (Mzø), sorting coeicient (Ói) and skewness (Ski) of the sediments. he textural proportions of gravel, sand and mud were plotted on Shepard’s triangle.
To determine the accumulated sediments during the ebb tide, sediment traps were place in 4 stations (Stn. 7, 12, 13 and 15). he concentrations of suspended sediment at three diferent depths (surface, middle and bottom) were measured at Station 2. Beside the suspended sediment, other parameters namely current velocity and the width of the Mesjid River mouth were also measured to determine water discharge during the ebb tide.
Suspended sediment concentration (mg/l) and water discharge (m3/s) of the river were used to determine total amount of lithogeneous sediments (ton/year) discharged by the Mesjid River into the estuary ater converting the unit of liter (l) to dm³ and of second (s) to year. Accumulated sediments in sediment traps were calculated based on total amount of sediments (gram and/or ml) trapped in the sediment trap (m²) in period of time (day), as proposed by modiied by Rifardi [2012]. he accumulated sediments were utilized to estimate sedimentation rates (m/year) ater converting the unit of ml to m³ and of day to year.
3.Result and Discussion
11 101° 23' 26.0361" E 1° 43' 15.8867" N 67.92 76.96 6.10 0.16 0.54 Mud -15.13 32.99 213.81
12 101° 23' 11.6359" E 1° 43' 17.6596" N 63.83 36.28 4.74 0.82 0.97 Muddy Sand -0.54 17.18 39.46
13 101° 23' 14.8137" E 1° 43' 17.6761" N 67.10 32.90 3.43 0.71 0.99 Muddy Sand -0.54 20.10 39.62
14 101° 23' 18.0246" E 1° 43' 17.6927" N 48.64 51.40 5.49 0.71 0.99 Sandy Mud -13.32 24.91 109.99
15 101° 23' 9.9849" E 1° 43' 19.3084" N 52.01 47.99 5.02 0.79 0.59 Muddy Sand -1.22 17.84 53.33
16 101° 23' 13.2620" E 1° 43' 19.3250" N 44.90 55.09 4.52 0.90 0.99 Sandy Mud -15.95 20.68 67.88
17 101° 23' 16.4564" E 1° 43' 19.3912" N 43.29 56.72 5.61 0.87 0.99 Sandy Mud -13.50 23.98 70.31
18 101° 23' 19.6673" E 1° 43' 19.4077" N 34.71 65.29 6.82 0.84 0.99 Sandy Mud -16.04 29.03 136.47
19 101° 23' 22.9159" E 1° 43' 19.4081" N 37.30 71.34 6.00 0.52 0.93 Sandy Mud -16.25 31.02 191.22
20 101° 23' 26.1981" E 1° 43' 19.4236" N 22.61 77.39 6.20 0.28 0.51 Mud -16.84 33.19 191.98
21 101° 23' 9.9532" E 1° 43' 21.7227" N 33.39 66.61 6.98 0.52 0.53 Sandy Mud -1.76 19.54 38.24
22 101° 23' 13.1261" E 1° 43' 21.7723" N 30.62 69.38 6.87 0.65 0.93 Sandy Mud -15.40 21.60 71.09
23 101° 23' 16.1903" E 1° 43' 22.1035" N 30.30 69.70 7.38 0.65 0.99 Sandy Mud -17.37 26.20 232.64
24 101° 23' 19.0120" E 1° 43' 22.1445" N 30.00 70.00 7.13 0.55 0.95 Sandy Mud -17.89 29.67 232.11
25 101° 23' 23.5492" E 1° 43' 21.4722" N 47.12 73.14 3.41 0.30 0.85 Sandy Mud -17.55 31.64 182.45
26 101° 23' 26.1567" E 1° 43' 21.7961" N 70.05 77.36 6.19 0.14 0.51 Mud -17.69 33.08 182.31
27 101° 23' 9.5885" E 1° 43' 24.6723" N 30.27 69.72 6.57 0.13 0.58 Sandy Mud -2.47 20.00 56.88
28 101° 23' 12.8294" E 1° 43' 24.5896" N 32.22 67.78 6.50 0.15 1.00 Sandy Mud -12.46 23.61 78.66
29 101° 23' 16.0702" E 1° 43' 24.6723" N 30.00 70.00 6.31 0.10 0.99 Sandy Mud -17.58 27.80 124.69
30 101° 23' 18.6880" E 1° 43' 24.7528" N 30.00 70.00 3.42 0.11 0.90 Sandy Mud -18.98 30.20 167.39
31 101° 23' 22.2529" E 1° 43' 24.7528" N 40.84 71.99 6.13 0.10 0.76 Sandy Mud -19.87 31.68 180.13
32 101° 23' 26.1419" E 1° 43' 24.6183" N 70.68 77.48 6.36 0.10 0.51 Mud -18.86 33.06 181.14
33 101° 23' 9.1479" E 1° 43' 27.1751" N 47.10 52.90 5.65 0.66 1.50 Sandy Mud -4.72 23.83 94.84
34 101° 23' 12.9100" E 1° 43' 27.0499" N 46.74 53.25 3.40 0.66 0.99 Sandy Mud -15.49 26.89 84.66
35 101° 23' 16.0817" E 1° 43' 26.9954" N 40.46 59.54 6.00 0.57 0.96 Sandy Mud -17.64 30.14 115.89 36 101° 23' 19.3484" E 1° 43' 26.9954" N 30.00 70.00 6.15 0.33 0.82 Sandy Mud -19.92 31.05 165.95 37 101° 23' 22.6325" E 1° 43' 26.9672" N 36.74 71.24 6.38 0.10 0.69 Sandy Mud -20.76 32.15 169.93 38 101° 23' 26.1419" E 1° 43' 26.9846" N 23.87 76.13 6.59 0.10 0.51 Mud -18.61 33.55 171.63 39 101° 23' 8.6414" E 1° 43' 29.0013" N 57.48 41.79 5.93 0.87 1.99 Muddy Sand -4.99 28.30 108.34 40 101° 23' 13.1397" E 1° 43' 28.8713" N 58.45 40.72 5.52 0.88 1.07 Muddy Sand -15.42 30.11 96.22 41 101° 23' 16.4342" E 1° 43' 28.7534" N 45.29 54.72 6.20 0.62 0.90 Sandy Mud -17.81 30.91 114.21 42 101° 23' 19.6751" E 1° 43' 28.7948" N 33.59 66.35 6.43 0.34 0.77 Sandy Mud -19.86 31.74 159.82 43 101° 23' 22.8158" E 1° 43' 28.8713" N 30.84 69.16 6.59 0.10 0.64 Sandy Mud -20.09 32.65 160.17 44 101° 23' 26.1532" E 1° 43' 28.7948" N 34.15 70.76 6.78 0.10 0.50 Sandy Mud -18.83 33.93 161.19
45 101° 23' 8.3321" E 1° 43' 31.4826" N 49.87 50.13 6.52 0.76 0.88 Sandy Mud -5.49 34.13 126.73
46 101° 23' 12.1685" E 1° 43' 31.5626" N 49.63 50.37 6.48 0.63 0.64 Sandy Mud -14.69 34.24 114.57
47 101° 23' 16.1795" E 1° 43' 31.5760" N 46.90 53.11 6.63 0.41 0.63 Sandy Mud -17.81 34.25 112.79
48 101° 23' 19.6856" E 1° 43' 31.5536" N 39.26 60.71 6.87 0.34 0.64 Sandy Mud -18.31 34.21 147.83
49 101° 23' 22.8985" E 1° 43' 31.4491" N 36.40 63.62 6.86 0.14 0.57 Sandy Mud -18.75 34.03 147.38
of mean diameter (Mzø) and mud content (%) are shown in Figures 3 and 4, respectively.
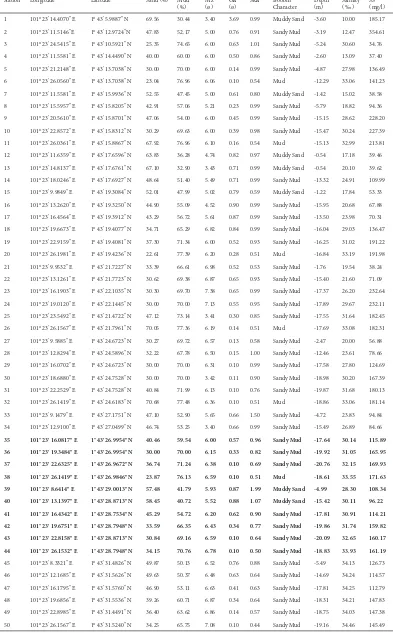
he bottom sediments in the Mesjid River Estuary are characterized by very ine sand to very ine silt (Mz ø : 3.40-7.38 ø). Gravels are not found at all stations, which are occupied dominantly by mud fractions (more than 50%), indicating that the bottom character in the estuary must be mud and sandy mud except for stations 7, 12, 13, 15, 39 and 40 which are composed of muddy sand. he areas with low mean diameter (Mz ø : ≤ 5ø) can bee seen in the river channel (Stn. 1 and 2) and in the area of the river mouth (Stn. 7, 12, 13 and 15). he peculiar features of these sediments are assumed to result from the derivation of coarser materials from the Mesjid River drainage area and from the neighboring coastal areas accessible to erosion seaward of the estuary. In addition to, bottom sediments with low mean diameter are distributed in the area of the river mouth which are situated at the boundary between diferent water masses, namely the fresh water mass and marine water mass. Strong main currents are seen in the area
inluence the bottom sediments. Other areas occupied by iner grained-sediments which are inluenced by weak tidal currents less than 0.3 m/s (Figures 5 and 6). Strong relationship between the distribution of median diameter of bottom surface sediments and currents system was also found in the Dumai Coastal Waters of Rupat Strait which located close to the Mesjid River Estuary [Rifardi et al., 2015] and in the strait which connected to the estuary [Rifardi and Syahrul, 2013], and this relationship is also recognized in the South Yatsushiro Sea, southwest Kyushu Japan [Rifardi et al., 1998]. he relationship between particle size and water velocity was also explained by Koiter et al. [2013]. Transport directions of sediments are mostly controlled by current circulation [Wei et al., 2004]. he seasonal variation of suspended sediment transport and its seasonal dispersal patterns from the Bohai Sea to the Yellow Sea was discussed by Wang et al. [2016] and the results indicate that the dispersal patterns of sediment were strongly inluenced by current system. he Mesjid River Estuary is occupied by high mud Figure 3. Geographical distribution of mean diameter
(Mz ø)
Figure 4. Geographical distribution of mud content (%)
Figure 6. Velocity and direction of the ebb current Figure 5. Velocity and direction of the high tide
except for the stations located in the two areas (the river channel and the area of the river mouth). he river drainage areas are mainly composed by alluvial deposits, moreover the coastal area of the estuary is occupied by peat land. High mud contents in the estuary are supposed to be derived from the areas which are sufered by erosion and abrasion. he sediment loads were highly correlated to drainage area and river discharge, so larger basins usually had larger sediment loads [Gellis et al., 2007]. More variety of the distributions of mean diameter (Mz ø) and of mud contents in the estuary indicate that the distributions strongly inluenced by tidal currents system. Tidal currents lowing from Malacca Strait to the southeastward low through the estuary during the high tide. he velocity of the high tide current coming into the estuary reaches 0.17-0.50 m/s. On the contrary, the velocity of the ebb current reaches 0.19-0.44 m/s and the current lowing from Malacca Strait to the northwestward low through the estuary.
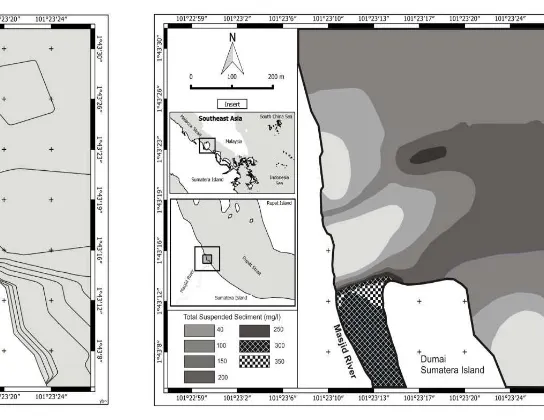
he distributions of sorting coeicient (Ói) and
skewness (Ski) are shown in Figure 7 and 8, respectively. A general trend of sorting coeicient in the studied area is that sediments are poorly sorted (0.1-0.9 ø) except for Station 1 showing high value as 3.69 ø. Poorly sorted sediments (1-3 ø) are recognized in areas inluenced by strong tidal currents 0.24-0.37 m/s at the high tide current and 0.37-0.44 m/s at the ebb current) as seen in the river channel (Stn. 1 and 2), the area of the river mouth (belt like-area: Stn. 7, 12-18) and the northern part of study area (Stn. 39, 40, 45 and 46). Well sorted sediments (<0.5 ø) is distributed in other areas of the estuary except the three areas aboved, and the areas are under the inluence of weak tidal currents. Poorly sorted sediments indicating the Mesjid River Estuary is occupied by unstable tidal current system (Rifardi, 2015).
he distributions of skewness (Ski) indicate that the study area is characterized by very ine-skewed sediments (>0.4). High ine-skewed sediments are recognized in the river channel, the area of the Figure 7. Distribution of the sorting coeicient (Ói) Figure 8. Distribution of the skewness (Ski)
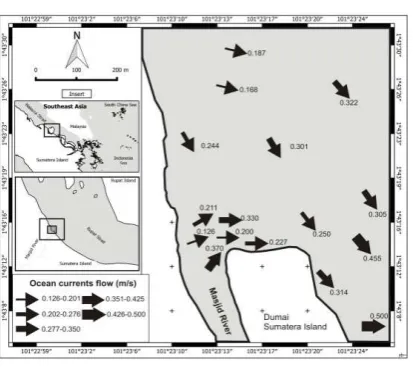
river mouth and the northern part of study area. Geographical distribution of the skewness sediments show the same tendency as of the sorting coeicient (Ói), indicating the study area is strongly under the inluence of tidal currents system as mentioned above. he Mesjid River Estuary has a rather lat bottom topography less than 21 m deep and gets gradually deeper northeastwards except for the area of the river mouth. his area is recognized as “belt like area” having west-east direction in the Mesjid River Estuary showing less than 1.0 m deep and the area is the shallowest area characterized by muddy sand of the bottom character. he deepest parts are found in the central and northeastern parts of the study area, more than 20 m in deep (Figure 9). he poorly sorted sediments supplied by the Mesjid River were deposited in the belt like area, but the deposition of mostly mud sediments was prevented by the high tide and ebb currents low across the north and south parts. Judging from the distributions of mean diamater (Mz ø : Figure 3) and mud content (Figure 4), the mud parts of the sediments must have been transported from the mouth of the river by the currents toward the northeastern and eastern parts where the high suspended sediments are seen (Figure 10). he river thus acted as a major contributor of terrestrial sediment to the study area, as also found by Rifardi [2008], the river mouth area is dominantly inluenced by fresh water run from the river. Gibbs and Bremner [2008] reported that estuary may periodically receive large amounts of terrigenous sediment from the whole catchment; and contributor of terrestrial sediment to global ocean, presenting signiicant inluence on global material cycling and marine ecosystem Martin et al. [1993]. he distribution of suspended sediment concentration (mg/l) shows the study area is occupied dominantly by the high concentration more 100 mg/l except for 14 stations (Stn. 3, 4, 7, 8, 12, 13, 15, 16, 17, 21, 22, 27 and 28) showing low concentration less than 70 mg/l. he concentration of the area is higher than the concentration of normal marine waters condition i.e. maximum 20 mg/l which clearly indicate the suspended sediment discharged from other areas and transported
highest suspended sediment (354.61 mg/l) into the study area. It became clear when low salinity (10-12 ‰) observed at Stations 1 and 2 (the river channel area) due to the inluence of fresh water. he suspended sediment is also transported together with marine water masss by tidal currents system derived from northern and eastern parts and deposited into the study area. he lowest concentrations (< 53 mg/l) are found in the stations 7, 12, 13 and 15 which are located in the belt like area under brackish condition i.e. nearly 20 ‰ in salinity afected more or less by fresh water. he similarity today between the river input and the tidal ine sediments, analysed from the inner tidal limit to the suspended sediment front present in the outer Estuary and inner Bristol Channel [Kirby and Parker, 1982], points to the river catchments as overwhelming source of the ine material. A prodelta began forming just ater highstanding under slow sea-level rise, and the delta front arrived by voluminous sediment input from the Nakdong River, Korea [Cho et al., 2016].
he concentrations of suspended sediment measured during the ebb tide at station 2 in three diferent depths (surface: 335.96 mg/l, middle: 350.92 mg/l and bottom: 376.95 mg/l) show high value 354.61 mg/l in average. his station is characterized by 2.3 m depth 52.6 m width and current velocity reaches 0.25 m/s. Based on the characteristics, the water discharge lowing through the station enter the Mesjid River Estuary reaches 30.24 m3/s. Total amount of lithogeneous sediments (ton/year) discharged by the Mesjid River into the estuary was calculated based on the suspended sediment concentration (mg/l) and the water discharge (m3/s). he results of the calculation show that the lithogeneous sediments were discharged by the Mesjid River into the estuary reach 926 ton/ day which is equal to 338,173 ton/year. he sediments were derived from the river’s hinterland due to the land development [Putra et al., 2017]. In addition, ebb currents play their own role in the transport of sediment, but this is primarily through lateral erosion associated with channel migration [Oyedotun, 2016]
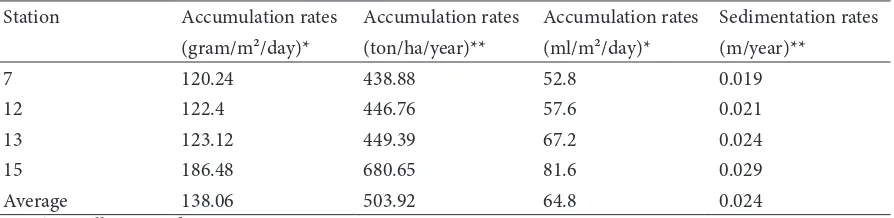
he stations 7, 12, 13 and 15 were used as locations to trap the suspended sediment using sediment Tabel 2. Results of accumulation rates of sediments and sedimentation rates
2016]. he area is assumed as the conluence area between fresh water mass derived from the Mesjid River and marine water mass. Velocities of the lood and ebb currents are relatively strong in this area. However, bottom currents in the area must be very weak in spite of the strong surface tidal currents. Suspended sediments are suggested to be supplied by the ebb current lows northward from the South Mesjid River Estuary where a great amount of sediment derived from the hinterland through the Mesjid River, has been deposited in the area. his assumption is supported by the high sedimentation rates as well as high accumulation rates of sediments in the area he high sedimentation rates in the area can also be explained by the occurence of a current rip between the fresh water mass and the marine water mass entering into the estuary, and quick sedimentation of the suspended sediments composed by silt materials which locculated in the sea water. his peculiar feature was also seen in the continental shelf adjancent to Japan as reported by and Sakamoto [1982]. he feature is also found in Parangtritis beach as mentioned by Retnowati et al. [2012] shoreline morphology are considered as signatures of rip currents occurrence along Parangtritis beach. Total amount of lithogeneous sediments (ton/ year) discharged by the Mesjid River into the estuary reach 926 ton/day which is equal to 338,173 ton/year. Some of the sediments are deposited in the area of the river mouth ”belt like area” which showing the high sedimentation rates (0.024 m/year) and the area is the shallowest part in the estuary (Figure 9). he depth of the area ranges from 0.5 to 1.0 m and the area is assumed as a sandbar which supposed to be sandbank in 20 years later if the sediments discharge and the currents system show the same situation as the present. Sedimentation history of sanbars in lood-tidal delta in Lake Tofutsu, Japan indicate that even though the sandbars appeared to comprise the same sand material, the sediment under the sandbars had a very varied stratigraphy, comprising the river-bone muddy sediment derived from the upstream side [Watanabe and Sassa, 2016].
of the suspended sediments in the belt like area. he lithogeneous sediments are accumulated in the area up to 503.92 ton/ha/year cause of high sedimentation rates (0.024 m/year) and the area is assumed as a sandbar as shown by the shallowest of bathymetry 0.5-1.0 m depth. he sandbar is supposed to be sandbank in 20 to 40 years later if the sediments discharge and the currents system show the same situation as the present. he suspended sediment discharged by the river into the estuary during the ebb tide which assumed as the total amount of lithogeneous sediments entering the estuary. he concentrations of suspended sediment discharged by the river reach 354.61 mg/l which is equal to 338,173 ton/year of the lithogeneous sediments. he tidal currents play important role on the distribution the sediments. he lithogeneous sediments discharged by the Mesjid River and suspended sediment of marine water mass are transported toward the north into the Mesjid River Estuary during the ebb tide, and reversed during high tide. More variety of the distributions of mean diameter (Mzø) and of mud contents in the estuary suggest that the distributions strongly inluenced by tidal currents system. he general feature of the bottom sediments is quite harmonize well with tidal currents system.
Acknowledgement
We express our deep gratitude to the Research Institute of Riau University, Minister of Education and Culture of Indonesia with contract number: 1001a/UN.19.5.1.3/LT/2015, for funding the present study. Particular thanks are due to Mr Yogi Novri Yusda, my undergraduate student, for his technical assistance in the ield and laboratory works; all my colleagues at the Department of Marine Sciences, Riau University, for their kind help.
References
Indonesia, Coastal Development, 10(2), 97-113. Amin, B., A. Ismail, A, Arshad, C. K. Yap and M.S. Kamarudin
(2008), Anthropogenic impacts on heavy metal concentrations in the coastal sediments of Dumai, Indonesia, Environmental Monitoring and Assessment, 148(1), 291-305, doi:10.1007/s10661-008-0159-z. Amin, B., A. Ismail, A, Arshad, C. K. Yap and M.S. Kamarudin (2009). Gastropod assemblages as indicators of sediment metal contamination in mangroves of Dumai, Sumatra, Indonesia, Water, Air and Soil Pollution, 201, 9-18. Badrun, Y. (2008). Analisis kualitas perairan Selat
Rupat sekitar aktivitas industri minyak bumi Kota Dumai, Jurnal Environmental Science, 1(2):17-25. Cho, A., D. Cheong, J. C. Kim, S. Shin, Y. H. Park and K.
Katshuki (2016). Delta formation in Nakdong River, Korea, during the holocene as inferred from the diatom assemblage, Coastal Reseach, 33(1): 67-77. Gebert, J., B. Conlin, J. Cushing, S. Douglas and G.Westfall
(2013). Sediment Quantity And Dynamics. Delaware Estuary Regional Sediment Management Plan (White Paper), U.S. Army Corps of Engineers, New Jersey Department of Transportation, U.S. Dept of Agriculture, Natural Resources Conservation Service, Waikato Regional Council. Gellis, A. C., C. R. Hupp, J. M. Landwehr and M. J. Pavich,
(2007). Sources and transport of sediment in the wransport of sediment in the watershed, p. 28, Synthesis of U.S. Geological Survey Science for the Chesapeake Bay Ecosystem and Implications for Environmental Management. U.S. Geological Survey, Reston, Virginia. Gibbs, M. And D. Bremner (2008). Wharekawa Estuary
Sediment Sources, Environment Waikato Technical Report 2008/07, 36 p., Environment Waikato, Hamilton East. Kirby, R. and W. R. Parker (1982). A suspended sediment
front in the Severn Estuary, Nature, 295, 396-399. Koiter, A. J., P. N. Owens, E. L. Petticrew and D.A. Lobb (2013). he behavioural characteristics of sediment properties and their implications for sediment ingerprinting as an approach for identifying sediment sources in river basins, Earth-Science Reviews 125, 24–42. Martin, J. M., J. Zhang, M. C. Shi, and Q. Zhou
(1993).Actual lux of the Huanghe ( Yellow River) sediment to the western Paciic Ocean, Netherlands Journal of Sea Research, 31(3), 243-254. Merian, R. D., Mubarak and S. Sutikno (2016).
Analisis kualitas perairan muara Sungai Dumai ditinjau dari sspek isika, kimia dan biologi, Dinamika Lingkungan Indonesia, 3(2):107-112. Musriin (2011). Mapping of Depth and Tidal
Current System in Mesjid River Estuary, Dumai City, Berkala Perikanan Terubuk, 39(1), 44-50. Nedi, S., B. Pramudya, E. Riani and Manuwoto
(2010). Environmental characteristics of Rupat Strait, Environmental Science, 1(4), 25-35. Oyedotun, T. D. T. (2016). Sediment characterisation
in an estuary-beach system, J. Coast Zone Manag, 19: 433, doi: 10.4172/2473-3350.1000433. Potter, I .C., B. M. Chuwen, S. D. Hoeksema and M. Elliott (2010). he concept of an estuary: A deinition that incorporates systems which can become closed to the ocean and hypersaline, Estuarine, Coastal and Shelf Science, 87(3), 497-500.
Putra, R. M., Rifardi and Elizal (2017). Kapasitas asimilasi total suspended solid (TSS) di muara Sungai Nerbit besar Kelurahan Lubuk Gaung Kecamatan Sembilan Kota Dumai Provinsi Riau, Terubuk, 45(1), In press. Retnowati, A., M. A. Marfai and J. T. S. Sumantyo
(2012), Rip currents signatures zone detection on Alos Palsar Image at Parangtritis beach, Indonesia, Indonesian Journal of Geography, 43(2), 12-27. Rifardi, K. Oki and T. Tomiyasu (1998). Sedimentary
environments based on textures surface sediments and sedimentation rates in the South Yatsushiro Kai (Sea), Southwest Kyushu, Japan, Sedimentology Sociaty Japan, 48, 67-84. Rifardi (2001). Study on sedimentology from the Mesjid River Estuary and its Environs in the Rupat Strait, the East Coast of Sumatera Island, Coastal Development, 4(2), 87-97. Rifardi (2008). Analisis ekologi foraminifera bentik
pada permukaan sedimen perairan Muara Sungai Mesjid dan Selat Rupat pantai timur Sumatera, Ilmu Kelautan, 13(2), 95-102. Rifardi (2012). Ekologi sediment laut modern,
167 p, UR Press, Pekanbaru, Indonesia. Rifardi and Syahrul (2013). Analisis degradasi perairan
Selat Rupat pantai timur Sumatera berdasarkan aspek sedimentasi sebagai dasar dalam perencanaan pembangunan dan pengelolaan wilayah pesisir Kota Dumai Provinsi Riau, 36 p., Laporan penelitian guru besar, Lembaga Penelitian dan Pengabdian Kepada Masyarakat, Universitas Riau, Pekanbaru Rifardi, Syahminan, Suwarni, R. B. Butar and N. Fidiatur
(2015). Sedimentary environments of the Dumai Coastal Waters on the East Coast of Central Sumatera Island, Indonesia, ASM Science Journal, 9(2), 9-16. Rifardi (2015). Studi karakteristik sedimen estuaria
Sungai Dumai dan estuaria Sungai Mesjid Selat Rupat, 71 p., Laporan penelitian guru besar, Lembaga Penelitian dan Pengabdian Kepada Masyarakat, Universitas Riau, Pekanbaru Sakamoto, W. (1982). Detritus-roles of suspended
and bottom sediment on coastal marine ecosystem, Marine Sci. Monhtly, 14(8), 482-489. Syahminan, E. Riani, S. Anwar and Rifardi (2015).
Heavy metals pollution status Pb and Cd in sediments in Dumai Sea western waters-Riau Province, Pengelolaan Sumberdaya Alam dan Lingkungan, 5(2), 133-140, doi: 10.19081/jpsl.5.2.133. Wang, A., H. Wang, N. Bi and X. Wu (2016). Sediment
transport and dispersal pattern from the Bohai Sea to the Yellow Sea, Coastal Reaseach, 74, 104-116. Watanabe, Y and S. Sassa (2016). Sedimentation history of
sanbars in lood-tidal delta evaluated by seismic method in Lake Tofutsu, Japan, Coastal Research, 32(6), 1389-1401. Wei, H., D. Hainbucher, T. Pohlmann, S. Feng
and J.Suendermann (2004). Tidal induced Lagrangian and Eulerian mean circulation in the Bohai Sea, Marine Systems, 44(34), 141-151. Wöstmann, R. and G. Liebezeit (2012). Geochemical
evidence for diferent peat sources in the Siak estuary and along the east coast of Sumatra, Indonesia, Mires and Peat, 10(2), 1–13, http://www.mires-and-peat.net/. Xing, G., H. Wang, Z. Yang and N.Bi (2016).