LINE SEGMENTATION OF 2D LASER SCANNER POINT CLOUDS FOR INDOOR SLAM
BASED ON A RANGE OF RESIDUALS
M. Petera,∗, S.R.U.N. Jafria, G. Vosselmana
a
University of Twente, Faculty ITC, Enschede, the Netherlands - (m.s.peter, s.r.u.n.jafri, george.vosselman)@utwente.nl
Commission IV, WG IV/5
KEY WORDS:segmentation, laser, 2D, residuals, SLAM, indoor
ABSTRACT:
Indoor mobile laser scanning (IMLS) based on the Simultaneous Localization and Mapping (SLAM) principle proves to be the preferred method to acquire data of indoor environments at a large scale. In previous work, we proposed a backpack IMLS system containing three 2D laser scanners and an according SLAM approach. The feature-based SLAM approach solves all six degrees of freedom simultaneously and builds on the association of lines to planes. Because of the iterative character of the SLAM process, the quality and reliability of the segmentation of linear segments in the scanlines plays a crucial role in the quality of the derived poses and consequently the point clouds. The orientations of the lines resulting from the segmentation can be influenced negatively by narrow objects which are nearly coplanar with walls (like e.g. doors) which will cause the line to be tilted if those objects are not detected as separate segments. State-of-the-art methods from the robotics domain like Iterative End Point Fit and Line Tracking were found to not handle such situations well. Thus, we describe a novel segmentation method based on the comparison of a range of residuals to a range of thresholds. For the definition of the thresholds we employ the fact that the expected value for the average of residuals ofnpoints with respect to the line isσ/√n. Our method, as shown by the experiments and the comparison to other methods, is able to deliver more accurate results than the two approaches it was tested against.
1. INTRODUCTION
In the recent years, “as-built” three-dimensional acquisition of indoor environments with the aim of establishing or updating Building Information Models (BIMs) for various applications has gradually moved to the focus of a wider range of research. Due to the unfavorable characteristics of indoor scenes for image-based methods (lighting, intersection angles) most acquisition methods build on active sensing, i.e. laser scanning. In order to reduce the amount of manual interaction needed for e.g. co-registration of scans to a common coordinate system, mobile laser scanning using the Simultaneous Localization and Mapping (SLAM) prin-ciple is the preferred method for experimental - e.g. (Cinaz and Kenn, 2008, Wen et al., 2016, Filgueira et al., 2016) - as well as commercial - Viametris iMS3D, NavVIS M3, ZEB1/ZEB REVO, Google Cartographer - systems.
In our previous work we described the design of a backpack-worn indoor mobile laser scanning system as well as a SLAM approach solving the full six degrees of freedom simultaneously based on the measurements of three 2D laser scanners (Vossel-man, 2014). This SLAM method belongs to the family of feature-based SLAM approaches, relying on linear features, i.e. line segments, which are associated to planes representing the map. The line segments have to be extracted from the laser scanlines using an approriate segmentation method. The accuracy of this segmentation method’s results, i.e. the quality of the segments’ orientations together with the lineplane association approach -highly influences the resulting drift. As an example, a thin ob-ject attached or close to a wall plane and parallel to it (e.g. a whiteboard or door, see figure 1) can cause a slightly wrong ori-entation of the resulting line segment if not detected reliably. This wrong line segment is in turn used to establish or update a slightly
∗Corresponding author
wrongly oriented plane to which the next wrong line is associated. The result is obvious: As the position and orientation of the sen-sor system are computed simultaneously, the errors accumulate resulting in deteriorated poses and point clouds.
For our backpack system and the experiments in this paper, we use the Hokuyo UTM-30LX 2D laser scanner. According to the manufacturer, the UTM-30LX has a range noise of±30 mm (in-door,<3000lx, up to 10 m). In our own experiments for smaller distances (<5 m), however, we identified a much better noise level of around±3 to±3.5 mm.
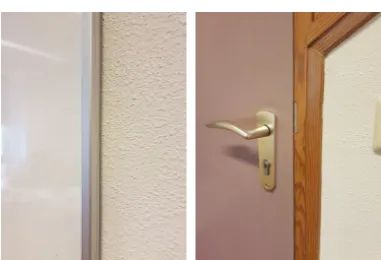
Figure 1 shows a single scanline captured by the Hokuyo UTM-30LX as well as the ground truth segmentation to linear segments (manually performed). It depicts the two problematic cases men-tioned before: a whiteboard attached to one of the walls which has a depth of 2 cm and a door with a depth of 1.5 cm. While the whiteboard has clear, steep edges (see figure 2 left), the detec-tion of the door is further complicated by the fact that its frame forms a sloped edge which results in a continuous transition from wall to door leaf (see figure 2 right). It is obvious that these two objects’ depths are very close to the sensor noise, which makes them difficult to be detected as segments separate from the walls they are attached to.
Figure 1. Problematic cases for line segmentation (red o: scanner position)
Figure 2. Whiteboard (left) and door (right) edges
1.1 Related Work
SLAM approaches, firstly building on ultrasound, later on 2D laser scanning, originated as a solution for two of the fundamen-tal problems of autonomous robots : localization, mapping, and wayfinding. Consequently, this field is the main source for search related to this work. As with upcoming 3D sensors re-search in the field of 2D robotics SLAM has lost some traction, most of the related work is rather old.
In (Siadat et al., 1997) three different approaches for linear seg-mentation of 2D laser scans are described: Successive Edge Following (SEF), Line Tracking (LT), Iterative End Point Fit (IEPF). A good comparison of those approaches (with their variations) and other prominent ones can be found in (Nguyen et al., 2005). According to the authors, other methods based on Kalman-filters, Hough-transform, RANSAC, or Expectation-Maximization (EM) were found to be less reliable in terms of their correctness. (Sack and Burgard, 2004) also come to the con-clusion that IEPF outperforms EM, especially in the case of small structures.
SEFmethods work directly on the polar coordinates (angle and range) delivered by the 2D scanning system. A point is included into the current segment if the difference between its range and the previous point’s range is below a threshold.
LT- or sometimes also called incremental - methods work on the Cartesian coordinates. They decide about including a point into a segment by adding the point to the segment and checking its dis-tance to the resulting recomputed line against a metric threshold
(Siadat et al., 1997). Alternatively, the distance of the point to be included can be computed with respect to the line defined by the points contained in the segment only, as done in our own previous work, see (Vosselman, 2014).
IEPF- or split-and-merge - starts with the full scanline, splitting it recursively at the point with the largest distance to the fitted line as long as this distance is larger than a threshold (Duda and Hart, 1973, Pavlidis and Horowitz, 1974, Siadat et al., 1997, Borges and Aldon, 2004). In the subsequent merge step, possibly exist-ing collinear segments are merged again. IEPF generally refers to methods which connect the first and last point in a segment, while split-and-merge methods rely on an estimation of the line (mostly using least-squares adjustment).
According to the comparison described in (Nguyen et al., 2005), IEPFandLT methods were found to be the most reliable ones in terms of true positives as well as false positives (they will be used for the comparison to our method, see section 3). Being parts of the processing chain of real-time robotic systems (which rely on the results for further steps like localization, mapping, and wayfinding), most of the approaches mentioned in subsec-tion 1.1 focus on fulfilling run-time constraints. As our indoor mapping system is human-operated and the SLAM problem is solved (so far) solely in post-processing, run-time was not taken into account when developing and evaluating the method.
2. METHODOLOGY
2.1 Line segmentation using a range of residuals
The detection of the narrow objects described before poses a problem for theLTmethod used in (Vosselman, 2014). This is due to the fact that it accepts a point as part of the segment if its distance to the line is less than3σ(for a confidence interval of 99.7%). Thus, an object with a distance of e.g. 2σwill remain undetected if testing points individually. The average residual over a number of points, however, will deviate significantly.
If a set ofnpoints form a valid line, the expected value for their residuals’ mean value isσ/p
(n)withσbeing the residual of each point with respect to the line. If the goal is the identification of linear segments in a set of points, this fact can be employed by comparing a range of average residuals against a range of thresh-olds in order to test a point for its inclusion into a segment. Those residuals are: The residual of the next point itself, tested against the threshold3σ; the next point and the last point contained in the segment, tested against3σ/p
(2); and so forth until3σ/√k, wherekis defined as a number of points contained in the segment. Figure 3 depicts the threshold curve and curves of average resid-uals for a point to be included in the segment, the point before the split and the split point. It can be seen that the average resid-uals of the point within the line (shorter because the smaller size of the segment results in a smaller amount of points to be tested) are low which caused the point to be included into the segment. At the split point, however, the curve of average residuals crosses the threshold curve, causing a new segment to be initiated.
Figure 3. Decision curves for a point within the segment (*), the point just before the split point (✷) and the split point (o);
threshold curve (continuous line)
threshold,percentage- the percentage of points contained in the segment which will be used for testing, andminLen- the min-imum number of points considered to form a reliable segment. The parameters will be explained further in the following.
For the initialization of a segment the current point together with theNnext points are used to fit a line using least squares adjust-ment. The line is accepted as a candidate if they form a valid line, i.e. if the mean value of the residuals is lower thanσ. If the line is not accepted, the current point gets the label “unsegmented” and the next point is chosen.
The parameterpercentageis used to select a number of points contained in the segment which will used for testing the next point for inclusion. The next point is tested by comparing a range of residuals to a range of thresholds as described above. If all the threshold checks are passed successfully, the point is added to the segment and the line parameters are recomputed. If not, the point is not included, the segment is added to the list of segments (if the number of points in the segment is greater thanminLen), and the point is used to initiate a new segment (together with the next Npoints).
An exemplary result using the dataset shown in figure 1 can be seen in figure 4 (using the parameters N=3, percentage=20%, σ=0.01 m,minLen=15).
2.2 Combination of forward-backward processing
While - in the aforementioned figure - the whiteboard (segment number 2) is detected quite accurately, it can clearly be seen that the door segment (number 5) contains some surrounding parts as well. This results from the fact that the door’s “upper” edge is only tested based on the small amount of points in the wall segment next to it, causing the line fitting to be inaccurate and allowing inclusion of door points. The “lower” edge, however, gets detected, because it is tested based on the larger number of points in segment 6.
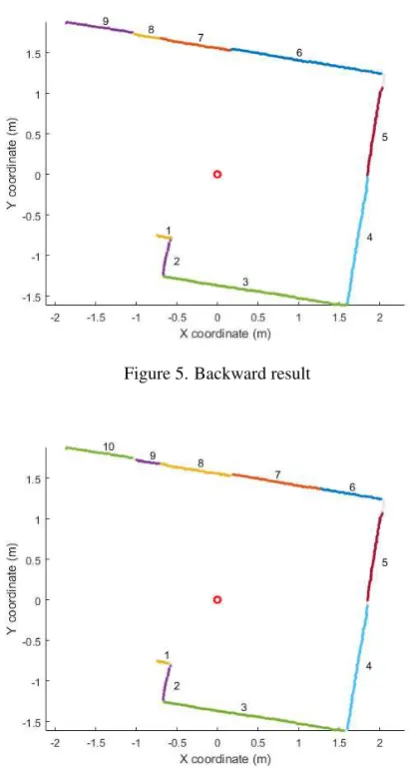
During our experiments we realized that running the method for-ward and backfor-ward on the dataset and combining the results can help to overcome this shortcoming. Figure 5 shows the result of running the method backward. It can be seen that, in this direc-tion, the door’s “upper” edge is detected and the resulting small
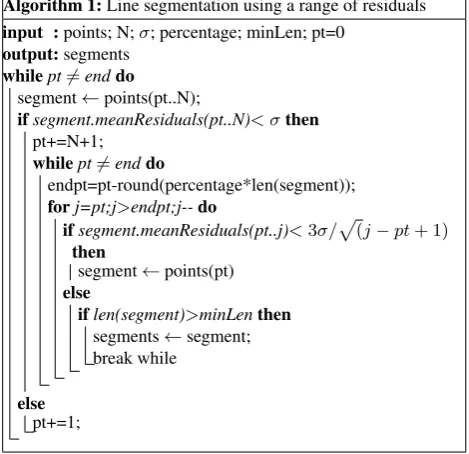
Algorithm 1:Line segmentation using a range of residuals
input :points; N;σ; percentage; minLen; pt=0
output:segments
segment is discarded because it contains less points thanminLen requests.
Figure 6 shows the combination of the results using the following strategy: a) if a point in one result is unsegmented it is set to unsegmented, b) if a point marks the change from one segment to another (or an unsegmented point) in the forward, backward, or both segmentation, a new segment starts also in the combined result. Finally, a check is performed if the resulting segments still fulfill theminLenrequirement. In figure 6 it is also visible that this method helps to clearly separate the segments, see e.g. the gaps between segments 4 and 5 (the fuzzy transition area from wall to door where the split also is difficult for a human operator to be identified). It is also obvious that the results tend to show a certain amount of oversegmentation as a tradeoff.
Figure 4. Forward result
3. EXPERIMENTS AND RESULTS
Figure 5. Backward result
Figure 6. Forward and backward results combined
manually (see figure 1). The comparison is carried out in the following way:
1. Assign each segment in the result to the ground truth seg-ment with the biggest overlap, compute overlap1 (i.e. the ra-tio between the number of overlapping points and the num-ber of points in the ground truth segment). A value of 1 for overlap1 means there is no oversegmentation present and all points in the ground truth segment were found by the seg-mentation method using one segment.
2. Compute the overlap of all segments assigned to one ground truth segment with the ground truth segment (=overlap2). A value of 1 for overlap2 means all the points in the ground truth segment were found, possibly using more than one seg-ment.
3. Save the number of segments overlapping with one ground truth segment (“oversegmentation”)
4. Compute the angle between the resulting segment and the assigned ground truth segment.
Thus, for each set of parameters the average overlap1, average overlap2, the median angle and the amount of
over/undersegmentation (i.e. average number of resulting seg-ments per ground truth segment) are computed and plotted (see e.g. figure 7).
3.1 Influence of the parameters on the results
Obviously, the number of points in a segment -minLen- does not have an impact on the quality of the individual segment, but will cause small (and possibly unreliable) segments to be discarded, therefore affecting the overall accuracy. The number of points used for the initial line -N- does not have an impact on the qual-ity of the individual segment, neither. However, as more points will be tested for the initial line estimation, an increase inNcan lead to a greater amount of unsegmented points. Those two pa-rameters were fixed toN=3 andminLen=15.
The most influential parameter on the quality isσ, as can be seen in figure 7. It steers the amount of over/undersegmentation as well as the angle trueness and the overlaps with the ground truth. According to figure 7 small values produce a high amount of oversegmentation (which can be seen in the low overlap1 as well as the under/oversegmentation values). The method works best withσvalues between0.0095mand0.011m(for a value of 15% forpercentage), of which the lower bound is selected because of a slightly higher overlap1.
Figure 7. Influence of theσparameter, percentage=0.15
For a fixedσ, the influence of the last remaining parameter - per-centage- can be analyzed (see figure 8). This parameter also in-fluences mostly the amount of over/undersegmentation, but also the angle trueness, as well as the overlap, apart from the fact that increasing it has a negative effect on run-time because of an in-crease of computations per point. However, an inin-crease of the parameter beyond 15% anyway influences the oversegmentation and angle trueness negatively, so that this parameter was fixed at 15%.
Figure 8. Influence of the percentage parameter,σ=0.0095 m
Figure 9. Best result, range of residuals segmentation,σ=0.0095 m,percentage=15%
3.2 Comparison to other methods and discussion
According to (Nguyen et al., 2005) the most reliable approaches in terms of true positives as well as false positives are those based on IEPF and LT. Those will be used for the comparison to our method.
In figures 10 and 11 the impact of an IEPF method’s threshold parameter and the best result can be seen, respectively. The best result in figure 11 shows a small amount of oversegmentation, but does not manage to detect the door segment’s start and end points, missing the left edge of the whiteboard as well. Already at a threshold value of0.0115mthe left edge of the whiteboard gets missed.
Figures 12 and 13 show the influence of the threshold parameter of theLTmethod used in (Vosselman, 2014) and the best result, respectively. As clearly visible in figure 12, the method is able to perform very well when using the correct threshold which can be derived from the range noise (here: 0.003m). However, results deteriorate rapidly when deviating from it, a fact which is already described by (Nguyen et al., 2005): “algorithm performances are very sensitive to the values used”. The best result using the op-timal threshold (figure 13) thus is very close to the ground truth,
Figure 10. Influence of the threshold parameter on the IEPF segmentation
Figure 11. Best result IEPF segmentation, threshold=0.011m
despite the lower door edge being detected late which results in a slightly tilted wall segment next to it. When increasing the thresh-old to0.004monly, the door is not separated from the wall any-more; starting from0.005m, the whiteboard also is missed which can also be seen in the increasing overlap1 curve.
Despite the fact that (Nguyen et al., 2005) rates it more accurate thanLTmethods, the appliedIEPFmethod’s results are not con-vincing for the challenges in this data set.
In contrast, the simpleLTapproach performs reasonably well for the problematic case described here. However, its high depen-dency on the correct choice of the threshold parameter dimin-ishes its applicability, especially when using an acquisition sys-tem whose noise changes e.g. with the distance between scanner and surface.
Figure 12. Influence of the threshold parameter on the LT segmentation
Figure 13. Best result LT segmentation, threshold=0.003 m
percentage parameter. Disadvantage a) is not a problem for our SLAM approach, tilted lines would have a higher impact on the results. Disadvantage b) is balanced out by the more accurate re-sults which are visible in the very low median angles in figure 7. Disadvantage c) currently cannot be prevented, see section 4 for ideas on how to tackle this in the future. However, the resulting segmentation is very accurate over a wider range ofσparameters, reflected in the high overlaps as well as the very small median an-gles. The door gets detected usingσvalues between0.008and 0.011m, the whiteboard between0.007and0.014m. Even when using aσof 0.015 m the results are similar to the best result de-livered by theIEPFmethod.
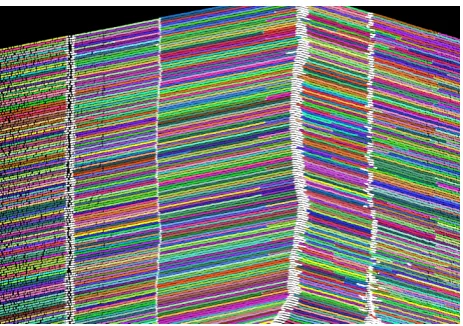
Figure 14 shows more scanlines of the same scene using per-centage=15% andσ=0.0095 m. In order to plot the subsequent scanlines, the time was used as offset along the z axis. From the left edge of the figure to the right, the data shows the wall, white-board, wall, corner, wall, door, and wall, split by white points which represent the “unsegmented” label. It can be seen that, de-spite the scanner being moved (see the “curve” in the corner, for example), the separation between walls and whiteboard/door is detected reliably. In the area of the door and the wall next to it, however, the tendency to oversegment is clearly visible.
Figure 14. More scanlines of the same scene, plotted using the time as offset along the z axis of the scanner (white points =
unsegmented)
4. CONCLUSIONS AND FUTURE WORK
In this paper we presented a novel line segmentation method for 2D lidar scanlines based on testing a range of residuals against a range of thresholds. Despite the higher computational complexity when compared to the other methods (which do not analyze each point several times), the method is capable of producing accurate linear segments and preventing tilted lines which can be caused by narrow, nearly collinear objects.
In the future, we will investigate if the computational complexity can be reduced. This could e.g. be done by not testing the full range of residuals, but only at discrete steps, thus reducing the number of tests per point. Furthermore, we will thoroughly test the impact of different segmentation methods on the results of our SLAM method. Lastly, we plan to analyze if forward-backward processing can also improve the results of theLTmethod.
REFERENCES
Borges, G. A. and Aldon, M.-J., 2004. Line extraction in 2d range images for mobile robotics.Journal of Intelligent & Robotic Sys-tems40(3), pp. 267–297.
Cinaz, B. and Kenn, H., 2008. HeadSLAM-simultaneous local-ization and mapping with head-mounted inertial and laser range sensors. In:Wearable Computers, 2008. ISWC 2008. 12th IEEE International Symposium on, IEEE, pp. 3–10.
Duda, R. O. and Hart, P. E., 1973. Pattern Classification and Scene Analysis. Wiley.
Filgueira, A., Arias, P., Bueno, M. and Lagela, S., 2016. Novel inspection system, backpack-based, for 3d modelling of in-door scenes. In: Proceedings of the International Conference on Indoor Positioning and Indoor Navigation (IPIN), Alcal de Henares, Spain.
Nguyen, V., Martinelli, A., Tomatis, N. and Siegwart, R., 2005. A comparison of line extraction algorithms using 2d laser rangefinder for indoor mobile robotics. In:Intelligent Robots and Systems, 2005.(IROS 2005). 2005 IEEE/RSJ International Con-ference on, IEEE, pp. 1929–1934.
Sack, D. and Burgard, W., 2004. A comparison of methods for line extraction from range data. In:Proc. of the 5th IFAC sympo-sium on intelligent autonomous vehicles (IAV), Vol. 33.
Siadat, A., Kaske, A., Klausmann, S., Dufaut, M. and Husson, R., 1997. An optimized segmentation method for a 2d laser-scanner applied to mobile robot navigation. In: Proceedings of the 3rd IFAC symposium on intelligent components and instruments for control applications, Citeseer, pp. 153–158.
Vosselman, G., 2014. Design of an indoor mapping system using three 2d laser scanners and 6 DOF SLAM.ISPRS Annals of Pho-togrammetry, Remote Sensing and Spatial Information Sciences II(3), pp. 173–179.