1
mrrrnnn11
0000073554STUDY ON WATER DEMAND AND CAP A CITY AT UMP GAMBANG CAMPUS
NUR F AEZAH BINTI HARITH
Report submitted in partial fulfillment of the requirements for the award of Bachelor of Civil Engineering
Faculty of Civil Engineering and Earth Resources UNIVERSITI MALAYSIA P AHANG
v
ABSTRACT
The vision of University Malaysia Pahang is to be a world class university. But, that does not mean a sophisticated place have no problem with the scarcity of water. There are a lot of weaknesses to be covered before turn into a world class university. The water supply and the water demand do not accommodate. The interviews and questionnaire were the.research method in the study area. Some data were als0 collected from the Department of Development and Asset Management. Interviews weredone towards particular party in study area. The respondent was randomly selected and assumed that, they represent the entire population of the study area. The data then were interpreted using Microsoft Excel. The water supply was the major problem of the occurrence of water shortage. The water capacity at UMP Gambang campus can be accommodated with the water demand required. The water shortage only occurred before 2010.The water supply, capacity and demand are directly proportional.
Vl
ABSTRAK
Visi Universiti Malaysia Pahang adalah menjadi sebuah universiti bertaraf dunia. Tetapi,ini tidak bermaksud bahawa tempat yang canggih tiada masalah kekurangan air. Ada banyak yang kelemahan yang perlu diperbaiki sebelum menjadi sebuah university bertaraf dunia. Bekalan air dan permintaan air tidak serasi. Temuduga dan kajian soalan adalah bentuk kajian. Beberapa data juga diambil dari Jabatan Pembangunan dan Pengurusan Harta(JPPH). Temuduga dijalankan ke atas _pihak berwajib. Responden dipilih secara rawak dan mereka dianggap jumlah keseluruhan kawasan kajian. Data yang dikumpul akan di interpretasi menggunakan Microsoft Excel. Bekalan air adalah masalah utama kekurangan air. Kapasiti air di UMP Gambang dapat menampung permintaan air.kekurangan air hanya terjadi sebelum 2010. Bekalan air, kapasiti dan permintaan adalah berkadar terus.
vu TABLE OF CONTENTS Page SUPERVISOR'S DECLARATION 11 STUDENT'S DECLARATION 111 ACKNOWLEDGEMENTS lV ABSTRACT v ABSTRAK Vl TABLE OF CONTENTS vu LIST OF TABLES
x
LIST OF FIGURES XU CHAPTER I INTRODUCTION 1.1 Introduction 1 1.3 Problem Statement 2 1.3 Objectives 3 1.4 Scope of Study 3 1.5 Significance of Study 4CHAPTER2 LITERA TT.JR:E REVIEW
2.1 Introduction 5
2.2 Population in the World 6
2.1.1 Water profile in Malaysia 7
2.3 Water Sources Collection 9
2.3.1 Natural collector (dam and lake) 10
2.3.2 Ice caps and glacier 10
2.3.3 Groundwater table 11
2.4 Growing Water Shortage 13
2.4.1 Singapore-Malaysia disputes 14
2.6 2.7 2.8 2.9
Water Supply
Effect When Insufficient of Water Public Consideration
Summary
CHAPTER3 RESEARCH METHODOLOGY
3.1 Introduction 1.2 Study Area 3.3 Research Method 3.4 Data Collection 3.4. l Interviews 3.4.2 Questionnaire 3.5 Data Interpretation
3.6 Data Collection for Water Demand Study
3.6.1 Agencies responsible for data collection 3.7 Water Supply Resources
3.8 Water Demand Estimation Method
3.9 Tank System at UMP Gambang to Contain Water Capacity
3.10 Summary
CHAPTER4 RESULTS AND DISCUSSION
4.1 4.2 4.3 4.4 4.5 4.6 4.7 Introduction
Data Analysis and Result
4.2. l Population recorded at UMP Gambang Water Demand in UMP Gambang
Existing of Tank and Water Capacity in UMP Gambang
4.4.l Tank identification Water Supply Flow
4.5.1 Water supply in 2007 to 2009 (LeparHilir water tank) 4.5.2 Water supply in 2010 (Bukit Sulai water tank)
Questionnaire Summary 16 17 18 19 26 26 27 28 30 30 30 31 32 32 32 36 38 41 44 45 46 51 56 Vlll
CHAPTERS CONCLUSION AND RECOMMENDATIONS 5.1 5.2 Conclusion Recommendation REFERENCES APPENDICES A Questionnaire form 57
58
59 64 ix6
2.2 Population in the World
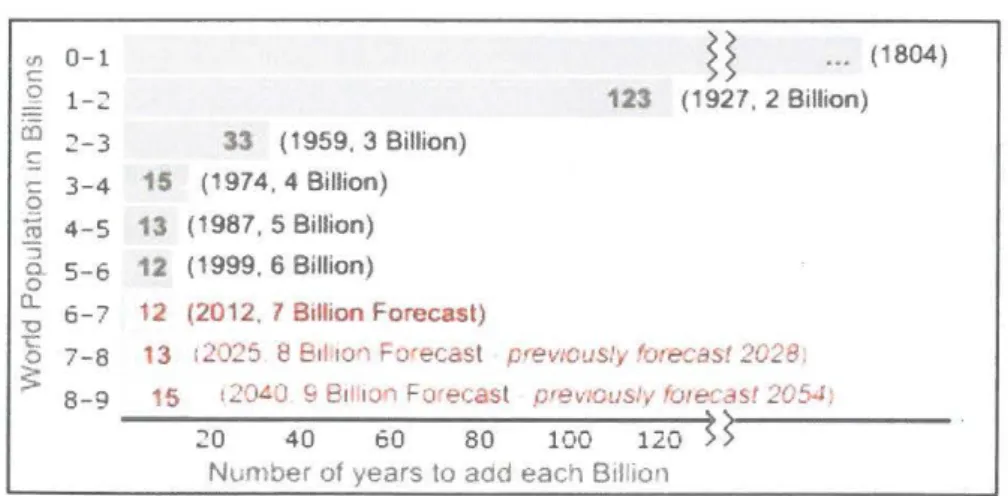
As of 22 December 2011, the world population is estimated by the United States Census Bureau to be 6.983 billion. Eurek Alert: World Population to surpass 7 Billion in 2011. Earth's population will reach seven billion on 31 October, a milestone that offers unprecedented challenges and opportunities to all of humanity, according to UNFP A, the United Nations Population Fund.
According to papers published by the United States Census Bureau, the world population hit 6.5 billion (6,500,000,000) on 24 February 2006. This was about 12 years after world population reached 5 billion in 1987, and 6 years after world population reached 5.5 billion in 1993. Researcher, Carl Haub, calculated that a total of over 100 billion people have probably been born in the last 2000 years.
</) 0-1 c Q 1 -"' ~ C:D 2-3 ~ ~ § 3-4 <O 4-5 :; a. 5-6 0 0. 6-7 -0 -c: 0 7-8 ~ 8-9
Table 2.1. World population
33 (1959, 3 Billion) 15 (1974. 4 Billion) 13 (1987, 5 Billion) 12 (1999. 6 Billion) 12 (2012, 7 Billion Forecast) ~ ~ ••• (1804) 123 (1927, 2 Billion)
13 120~5 8 81110·' Forecast previously fu:ecas! 2028
15 120~:.J 9 81' 1::J'"I Fo·ecast pre~·1cus1.,, fo1ecast 2054:
20 40 60 80 100 120 ~
>---Number of years to aad each Billion
Xl
4.17 Duration of water shortage 49
4.18 Aspects of water supply 50
4.19 Main cause of water shortage 51
4.20 Water shortage will solve with addition of water tank 52
4.21 Increasing population affected the water shortage 53
4.22 Responsible particular party 54
4.23 Secondary source of water 55
4.24 Effective ways while water shortage 55
XU
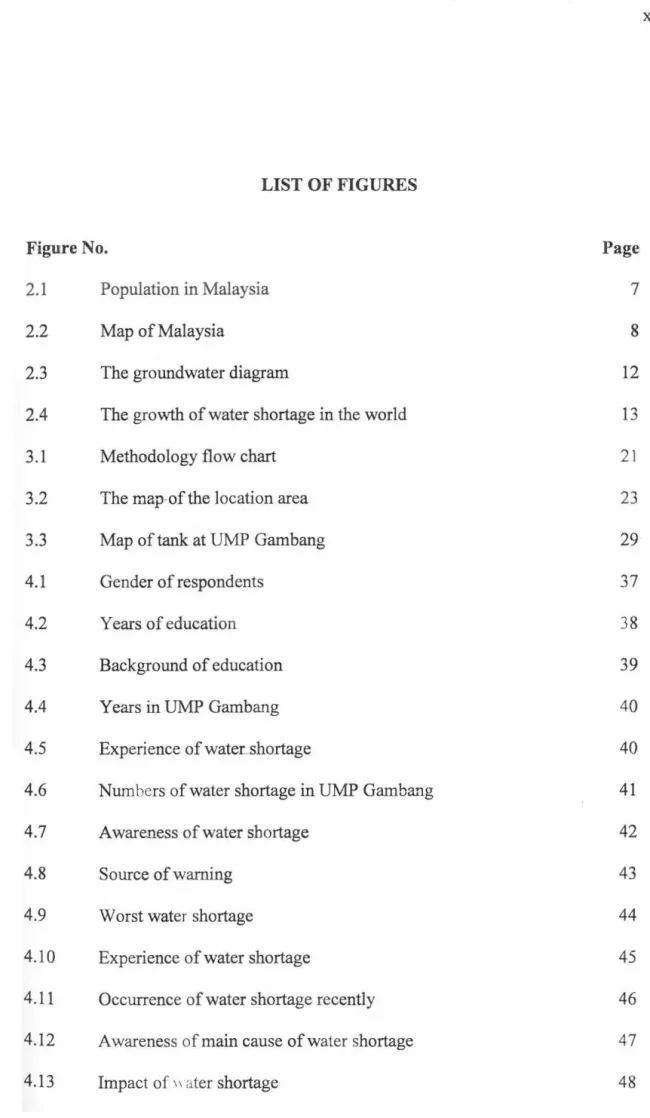
LIST OF FIGURES
Figure No. Page
2.1
Population in Malaysia7
2.2
Map of Malaysia8
2.3
The groundwater diagram12
2.4
The growth of water shortage in the world13
3
.
1
Methodology flow chart21
3.2
The map-of the location area23
3.3
Map of tank at UMP Garn bang29
4.1
Gender of respondents37
4
.2
Years of education3
8
4.3
Background of education39
4.4
Years in UMP Gambang40
4
.5
Experience of water_shortage40
4
.
6
Numbers of water shortage in UMP Gamba..'lg41
4.7
Aware...ness of water shortage42
4.8
Source of warning43
4.9
Worst water shortage44
4.10
Experience of water shortage45
4
.11
Occurrence of water shortage recently4
6
4.12
Awareness of main cause of water shortage47
Xlll
4.14 Duration of water shortage 49
4.15 Aspects of water supply 50
4.16 Main cause of water shortage 51
4.17 Water shortage will solve with addition of water tank 52
4.18 Increasing population affected the water shortage 53
4.19 Responsible particular party 54
4.20 Secondary source of water 55
4.21 Effective ways while water shortage 56
CHAPTER!
INTRODUCTION
1.1 RESEARCH BACKGROUND
Water demand is simply defined as the estimation of the water requirement for population towards fresh water. Basic of water demand will able to accommodate water for population per day to meet their basic requirement such for hygiene and meals. So, it is transparently showed that water demand is totally related to the population density. Hence, the increasing number in population in certain places represent to a high need of water demand.
From the National Water Resources Study, domestic and industrial water demand for Peninsular Malaysia will increase 3-fold from 9543 MLD (3483 million m3/yr) in 2000 to 31,628 MLD (11,543 million m3/yr) in 2050. By 2020, it is expected to increase by 2-fold. On a Peninsular Malaysia-wide basis, during periods of severe drought, the average natural or unregulated flows can barely meet the planned demand in 2050 of 31,628 MLD. Several dams form impounding reservoirs have been identified for new source works required for augmentation of water supply over the next 50 years. Long term projections of water demand are necessary in order to quantify requirements for future needs, and for development of new water resources, protection of potential catchments areas and rivers and for design of treatment facilities and distribution works.
2
The key components of demand for water supply include water consumption by the domestic, industrial, commercial and institutional sectors. In addition to this, the total amount of water that needs to be produced, and hence the total water demand includes provisions for water lost as a result of leakages between the source (treatment plant) and end users of consumers. According to the research by World Committee for Water (2003), population at all cities will increase into three fold in every 30 years.
Hence, by approaching year 2040 about 2.5 million populations at about 29 countries will face insufficient of water supply.
Besides water demand, the water capacity also has a great influence to impact the water requirement toward people. Water capacity defined as the measurement of water that received by people to meet their need toward clean water. In general, water capacity should be greater than water demand in order to proper achieved the requirement of water to population. Insufficient water capacity will also cause water crisis. Some issues in Malaysia are commonly related so the water supplies problems.
The insufficient of water supply in certain places can lead into the water crisis because of the failure to meet the water requirement for peoples. A comparison between water demand and water capacity is important in order to identify any insufficient of water. Therefore, a calculation for water demand and water capacity will be conducted to enable the objective of this study to be achieved. The water capacity should be more than the water demand to avoid any problem regarding water shortage.
1.2 PROBLEM STATEMENT
Scarcity of water :
• Population increasing at the study area • Low water supply
3
Water pressure :
• Pressure of water cannot reach to higher floor
1.3 OBJECTIVES
Generally, this study will focus on the research about the water demand. Thus, the water capacity will be related too and a new tank that meets the water demand will be recommended. Besides that, the alternative is to overcome the water demand position. The following are the objective of this study:
i. To identify the volume of the water demand and capacity at UMP Gambang
campus.
ii. To analyze the water demand and crisis for making a suggestion in future plan.
1.4 SCOPE OF STUDY
This study will focus on the water demand where represent to the requirement of the water toward consumer. The area of study is at University Malaysia Pahang (UMP) which located at Gambang, Kuantan, Pahang Darul Makmur. The· specific of study area will be from the backyard of the girl's hostel (Kolej Kediaman 3) to the lecture hall (Block Z). The water demand has been taken semester by semester in a year especially on the early semester for new students.
Through interviews and information gathering from the BPPH (Department of Development and Asset Management), BPA (Department of Academic Management) UMP and consumer in UMP Gambang campus the data has been collected. The
4
interview will be done towards 100 respondent of the area. The respondent will be selected randomly, and assumed that they represent the entire population of the study area. In this study, water demand computes by using table and a related equation. The
calculation of the water must include the population in the area and sum of water used
for the population. The total of the water demand should less than water capacity or
water supply.
1.5 SIGNIFICANCE OF STUDY
The important of this study can be interpreted based on the objectives of this study. It is including knowing the volume of the water requirement at UMP and also the volume of water storage at UMP from year 2007 until 2010.
Besides that, it will also show how water demand is directly proportional to the water capacity at UMP. Therefore, this study of water demand and water capacity will be solved during the scarcity of water.
CHAPTER2
LITERATURE REVIEW
2.1 INTRODUCTION
Malaysia, like the rest of the world, is faced with a growing population. The population of Peninsular Malaysia will be more than double its size from 18.1 million in 2000 to 38 million in 2050 as reported in the National Water Resources Study (2000). Population growth and socio-economic development are currently driving a rapid increase in water demand. Rural to urban migration is also evident with a relative large number of the population concentrated in urban areas where high economic activities exist. The rapid growth in population, increasing economic development and improvements in the standards of living resulted in increased demand for water supply.
The challenge here is not only to provide adequate water for the increased demand but also to stimulate development in rural areas to relieve migration into and lessen pressures in the urban areas27% of the respondent knows the cause of water shortage problems. Majority of the respondent said that the water shortage occur because of the piping is too old and cannot resist the water flow and can be broken at any time. A few of them said that the water demand is more than water capacity. So, there is water shortage. Some of them said that the size of the water tank in UMP Gambang is not enough. Three of them said it was because of the low water pressure from the Lepar Hilir water tank.
6
2.2 Population in the World
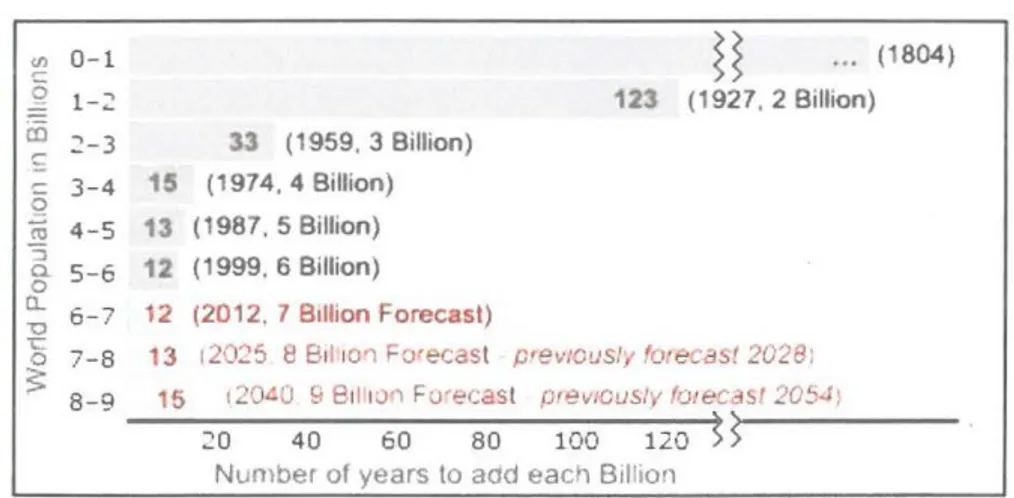
As of 22 December 2011, the world population is estimated by the United States Census Bureau to be 6.983 billion. Eurek Alert: World Population to surpass 7 Billion in 2011. Earth's population will reach seven billion on 31 October, a milestone that offers unprecedented challenges and opportunities to all of humanity, according
to UNFP A, the United Nations Population Fund.
According to papers published by the United States Census Bureau, the world population hit 6.5 billion (6,500,000,000) on 24 February 2006. This was about 12
years after world population reached 5 billion in 1987, and 6 years after world
population reached 5.5 billion in 1993. Researcher, Carl Haub, calculated that a total
of over 100 billion people have probably been born in the last 2000 years.
U'l 0-1
-
q 1-~ iii 2-3 -Q 3-4 !I) 4-5 -=:; a. 5-6 0 0... 6-7 "O "C 0 7-8 ;s=: 8-9Table 2.1. World population
n
...
(1804) 123 (1927. 2 Billion) 33 (1959, 3 Billion) 15 (1974, 4 Billion) 13 (1987. 5 Billion) 12 (1999, 6 Billion) 12 (2012. 7 B11hon Forecast)13 120~5 8 81110·1 Fu'ecast previous/1 'o:&;.a5! 2028; 15 120<:8 & 8111.J~ Fu·f:cast prev1Cu51i fOf&CdSI 205-1!
20 40 60 80 100 120 ~
>---Number of years to aeld each 81lilon
Population
l.'1d:,ur tSV'"at~s oftt:e rts1dent :>e;x.ola:,Ofl ~ JOI.I 2;!.1 201.1 1;1.1 101.1 ; l.t 0 1960 1965 1970 197; 1980 1985 1990 1995 2000
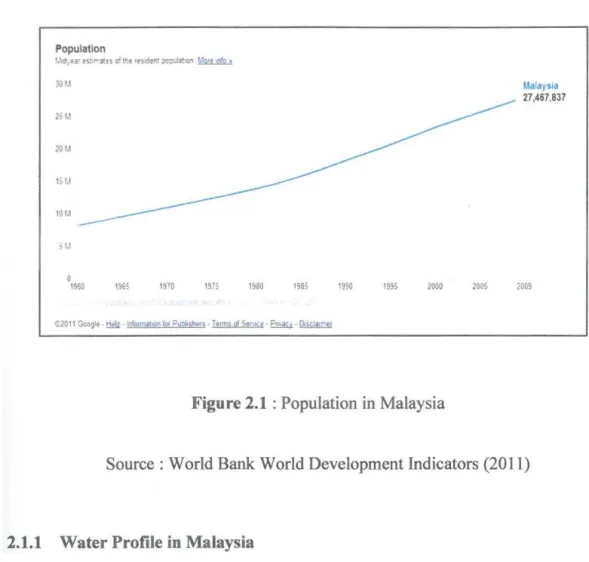
Figure 2.1 : Population in Malaysia
2005
Malaysia
27,467,837
2009
Source: World Bank World Development Indicators (2011)
2.1.1 Water Profile in Malaysia
7
The water profile of Malaysia is dominated by a supply regime of copiously flowing rivers and a widespread series of dams for surface water storage. Demand includes the growing human population, industry and agriculture, of which rice farming is the most water intensive crop. Water pollution from sanitary domestic sewage sources as well as industry are major challenges for the country, with the recent and on going growth of the population and the country's industrial base.
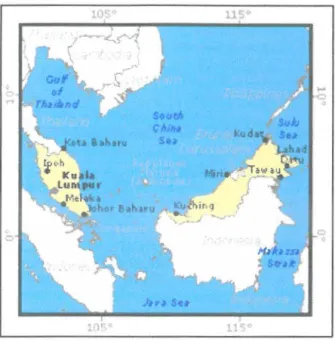
Malaysia is situated in Southeast Asia. It consists of two regions: peninsular Malaysia in the west lying between Thailand and Singapore, and the states of Sabah and Sarawak located in the east on the island of Borneo. The two regions are separated by the South China Sea. The total land area of the country is 328,550
square kilometres (km2). Malaysia is a federal country, divided into 13 states plus the
10
Figure 2.2 : Map of Malaysia Source : F AO (2009)
...
0 0 0 0Table 2.2: National Water Resource Study (Peninsular Malaysia)
Demand Unit 1998 2000 2010 2020 2030 2040 {mil} Domestic m1/yr 1,833 2,029 2,987 3,862 4,606 5,251 Industry ml/yr 1,260 1,454 2,592 3,561 4,330 5,016 Both m1/yr 3,093 3,483 5,578 7,423 8,936 10,267 Irrigation m1/yr 7,350 7,350 6,517 6,517 6,132 6,132 TOTAL m1/y_r 10,443 10,833 12,095 13,940 15,068 16,399
Source: Geologic Survey Water Supply, 2000
8 2050 5,904 5,639 11,543 6,132 17,675
The water use by community normally related to the population. On the average, water demand will estimate 150 gallon per person per day but individual communities may vary widely from this average. These fluctuations will have a considerable effect upon distribution system design. Average per capita use will be affected by the factors listed below. Raja Nazrin said a growing population coupled
9 with the fast pace socio economic and industrial development especially over last three decades, had imposed greater demands on water supply (The Star, 2008).
Table 2.3 : Factors influence water consumption
Climate Quality
Variable
Economic level of consumption Cost
Metering the household Pressure in system Industry
Effect
Wann climate increase consumption Improved quality increased consumption Consumption increase with income Small : very high cost may decreased Metering decreased use
Low pressure decrease use
Dependent on industry : may cause large increase in average consumption
Source : The Star (2008)
2.3 WATER SOURCES COLLECTION
Peninsular Malaysia is drained by a dense network of rivers and streams (there are about 150 major river basins), the longest being the Pahang River which follows a course of 434 km before reaching the South China Sea. It drains a catchment area of 29,000 km2• Other major rivers that also drain into the South China Sea are the
Kelantan, Terengganu, Dungun, Endau, and Sedili rivers. Major river basins in the east of Malaysia tend to be larger than those in peninsula Malaysia. Malaysia's longest river is the Rajang River (563 kilometers) in Sarawak.
Out of an annual rainfall volume of 990 cubic kilometers (km\ 360 km3 (36 percent) are lost to evapotranspiration. The total surface runoff is 566 km3, and about
64 km3 (7 percent of the total annual rainfall) contribute to groundwater recharge. However, about 80 percent of the groundwater flow returns to the rivers and is therefore not considered an additional resource. The total internal water resources of Malaysia are estimated at 580 km3/year. Major floods occurred in 1967, 1971, 1973
IO
and 1983. Some 29,000 km2 are considered as flood-prone areas, affecting about 2.7 million people. The average annual economic damage caused by floods was estimated at US$40 million in 1980.
2.3.1 Natural collector (dam and lake)
On the west coast of peninsular Malaysia, the low gradient has resulted in large
extensions of tidal flats and swamps. One of the swamp lakes is Lake Tasek Bera in
Pahang State, with an area of 61.5 km2.
Malaysia has a total of 56 dams, of which 32 are more than 15 m high. The gross theoretical hydropower potential of peninsular Malaysia is 123,000 gigawatt hours per year (GWh/year), and that of Sabah and Sarawak together is I07,000 GWh/year. In 1995, the total hydropower generation was about 5,800 GWh, or 30 percent of all power production in Malaysia.
2.3.2 Ice caps and glacier
Even though glacier may harm people, they are a big item when we talk about
the world's water supply. Almost IO percent of the world's land mass is currently covered with glaciers, mostly in places like Greenland and Antarctica. Glaciers are important features in the hydrologic cycle and affect the volume, variability, and water quality of runoff in areas where they occur.
The researchers concluded that glaciers and ice caps are currently contributing about 60 percent of the world's ice to the oceans and the rate has been markedly accelerating in the past decade, said Emeritus Professor Mark Meier of CU-Boulder's Institute of Arctic and Alpine Research, lead study author. The contribution is
presently about IOO cubic miles of ice annually --a volume nearly equal to the water
in Lake Erie --and is rising by about three cubic miles per year. There are a few facts about ice caps and
glacier:-• Glaciers store about 69% of the world's freshwater, and if all land ice melted the seas would rise about 70 meters (about 230 feet).
11
• During the last ice age (when glaciers covered more land area than today) the sea level was about 400 feet lower than it is today. At that time, glaciers covered almost one-third of the land.
• During the last warm spell, 125,000 years ago, the seas were about 18 feet higher than they are today. About three million years ago the seas could have been up to 165 feet higher.
• North America's longest glacier is the Bering Glacier in Alaska, measuring 204 kilometers long.
• Glacial ice can be very old-in some Canadian Arctic icecaps, ice at the base is over I 00 000 years old.
• The land underneath parts of the West Antarctic Ice Sheet may be up to 2.5 kilometers below sea level, due to the weight of the ice.
• Antarctic ice shelves may calve icebergs that are over 80 kilometers long. • The Kutiah Glacier in Pakistan holds the record for the fastest glacial surge.
In 1953, it raced more than 12 kilometers in 3 months, averaging about 112 meters per day.
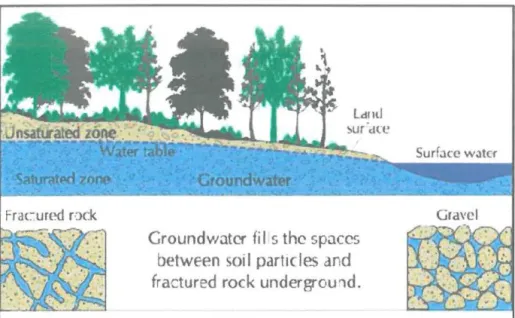
2.3.3 Groundwater table
At the groundwater table the water pressure is equal to atmospheric pressure. Below the groundwater table, the water is under hydrostatic pressure, which is greater than the atmospheric pressure, and it increases with depth just like in a pool. Above the groundwater table capillary suction prevails and the water pressure is less than atmospheric.
Compared to water in a pool, the groundwater table corresponds to the water surface in the pool. Unlike the soil, a pool does not have capillaries above the water surface and there is no water hanging above it. In a soil, the zone above the water table is called unsaturated (or vadose) zone. Depending on the moisture content of the unsaturated zone, there is more or less air in it. Below the groundwater table no air present, unless entrapped or dissolved in the water.
12
Groundwater is water that is found underground in cracks and spaces in soil, sand and rocks. The area where water fills these spaces is called the saturated zone of a geologic formation. The top of this zone is called the water table. The water table may be only a meter below the ground's surface or it may be hundreds of meters down.
Groundwater fi I s the spaces
betwEen soil particles dnd
fractured rock undergrou1d.
1111·..:, fOP1:11~·{-J·1·l.'' C,11'llo_..:h1l""•:lf"1',11111tJl~t(! 1· lb( (,!'>.1J1ch"c'1
1"Ff-l1t11!tlltJ'
Figure 2.3: The groundwater diagram
Sources : US Geological Survey (2003)
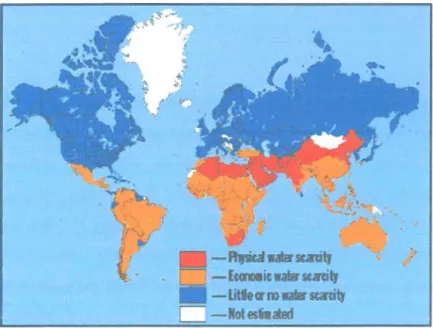
?.4 GROWING WATER SHORTAGE
Nowadays, there are many of country has involve to the water crisis. But United Nations (UN) stressed only the continental of Africa and Asia which is more expose to water shortage. The ranking of the water shortage among five main continental in the world is based on the UM research (1998). The UN also added that Africa and Asia is the continental which expose to the long dry season and have the highest number of population in the world.
13
According to a new report released by the Natural Resources Defense Council, more than one-third of all counties in the lower 48 states will likely be facing very serious water shortages by 2050. That is just 40 years away. As water becomes scarcer and as big global corporations lock up available supplies, the price of water is almost certainly going to skyrocket. This will put even more economic pressure on average Malaysian.
ti
=
-R.a"*sunitt
-&armic.-sc.nitJ -litttcrno_.uq [J-llotest.allclFigure 2.4: The growth of water shortage in the world Source: FAO (2001)
In Malaysia, about 37.5% rate of growing water shortage are identified. It is the maximum rate achieved since year 1998 which is the initial step to become one of the progressive countries in the world. Identified that the sudden growing of population in Malaysia are causes the water shortage during that year.
2.4.l Singapore - Malaysia Disputes
Singapore and Malaysia have a long standing conflict over water supplies. The first water agreement was signed between His Highness the Sultan and Sovereign Ruler of the State and Territories of Johor and the Municipal Commissioners of the
14
Town of Singapore on 5 December 1927. This agreement is no longer in force. The Malaysian government has stated that the agreements were signed during a different time and that the price should increase. They cite the example of water sold by China to Hong Kong in the past, which was approximately $8 per 1,000 imperial gallons (4,500 L). However, this price comparison is not directly applicable because while China has borne the cost of constructing and maintaining the infrastructure to provide water to Hong Kong, Singapore paid for all the costs of the reservoirs in Johor, the
dams, pipelines, plant, equipment, etc. and Singapore continues to pay all the costs of
operating and maintaining this infrastructure.
As of 2003, about 40% of Singapore's water came from Malaysia. This proportion has been decreasing as Singapore has pursued its Four Tap Strategy of sourcing water from rainwater, recycling, desalination, and importation. As new desalination and recycling plants come online and new dams are built to create additional reservoirs, Singapore's dependence on imported water decreases. With decreasing dependence, the potential for water conflicts is reduced. By 2010, Singapore had constructed five Newater plants, a desalination plant and a new water barrage to increase rainwater supply. The Newater/Desalination plants have the capability to supply 40% of Singapore's water needs as at 20 IO. Due to the limit of rainwater catchment, new investment is being planned with a tender for 2nd and larger desalination plant to be constructed by 2013. Singapore's water needs are anticipated to double in the next 50 years. Planned Newater output will triple to meet 50% of needs by year 2060 whilst desalination investment will raise output to meet 30% of needs. By the expiry of the 1962 water agreement in 2061, the necessity for Malaysia water import should be eliminated. On 31 August 2011, the 1961 water agreement expired and the waterworks and facilities were handed over to the Johor state government. The handover included the Skudai and Gunung Pulai water treatment plants, which were built and managed by PUB for 50 years, as well as two pump houses in Pontian and Tebrau.