For your convenience Apress has placed some of the front
matter material after the index. Please use the Bookmarks
and Contents at a Glance links to access them.
Contents at a Glance
Preface ...
xiii
About the Authors ...
xv
About the Technical Reviewer ...
xvii
Acknowledgments ...
xix
Introduction ...
xxi
Chapter 1: “Big Data” in the Enterprise
■
...
1
Chapter 2: The New Information Management Paradigm
■
...
25
Chapter 3: Big Data Implications for Industry
■
...
45
Chapter 4: Emerging Database Landscape
■
...
73
Chapter 5: Application Architectures for Big Data
■
and Analytics ...
107
Chapter 6: Data Modeling Approaches for Big Data
■
and Analytics Solutions ...
155
Chapter 7: Big Data Analytics Methodology
■
...
197
Chapter 8: Extracting Value From Big Data: In-Memory Solutions,
■
Real Time Analytics, And Recommendation Systems ...
221
Chapter 9: Data Scientist
■
...
251
Introduction
You may be wondering—is this book for me? If you are seeking a textbook on Hadoop, then clearly the answer is no. This book does not attempt to fully explain the theory and derivation of the various algorithms and techniques behind products such as Hadoop. Some familiarity with Hadoop techniques and related concepts, like NoSQL, is useful in reading this book, but not assumed.
If you are developing, implementing, or managing modern, intelligent applications, then the answer is yes. This book provides a practical rather than a theoretical treatment of big data concepts, along with complete examples and recipes for solutions. It develops some insights gleaned by experienced practitioners in the course of demonstrating how big data analytics can be deployed to solve problems.
If you are a researcher in big data, analytics, and related areas, then the answer is
yes. Chances are, your biggest obstacle is translating new concepts into practice. This book provides a few methodologies, frameworks, and collections of patterns from a practical implementation perspective. This book can serve as a reference explaining how you can leverage traditional data warehousing and BI architectures along with big data technologies like Hadoop to develop big data solutions.
If you are client-facing and always in search of bright ideas to help seize business opportunities, then the answer is yes, this book is also for you. Through real-world examples, it will plant ideas about the many ways these techniques can be deployed. It will also help your technical team jump directly to a cost-effective implementation approach that can handle volumes of data previously only realistic for organizations with large technology resources.
Roadmap
This book is broadly divided into three parts, covering concepts and industry-specific use cases, Hadoop and NoSQL technologies, and methodologies and new skills like those of the data scientist.
Part 1 consists of chapters 1 to 3. Chapter 1 introduces big data and its role in the enterprise. This chapter will get you set up for all of the chapters that follow. Chapter 2 covers the need for a new information management paradigm. It explains why the traditional approaches can’t handle the big data scale and what you need to do about this. Chapter 3 discusses several industry use cases, bringing to life several interesting implementation scenarios.
CHAPTER 1
“Big Data” in the Enterprise
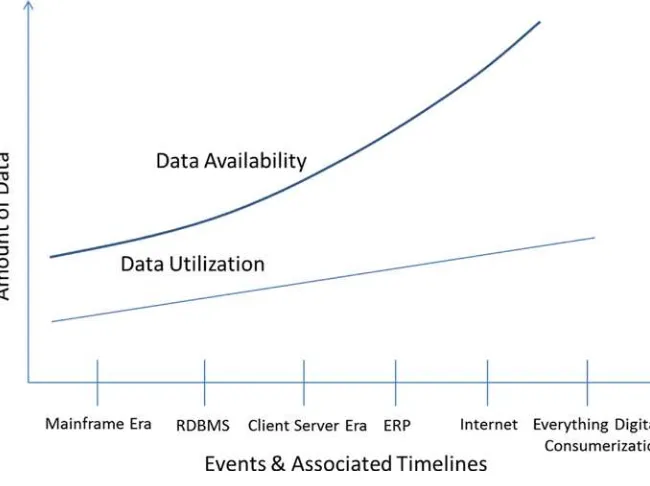
Humans have been generating data for thousands of years. More recently we have seen an amazing progression in the amount of data produced from the advent of mainframes to client server to ERP and now everything digital. For years the overwhelming amount of data produced was deemed useless. But data has always been an integral part of every enterprise, big or small. As the importance and value of data to an enterprise became evident, so did the proliferation of data silos within an enterprise. This data was primarily of structured type, standardized and heavily governed (either through enterprise wide programs or through business functions or IT), the typical volumes of data were in the range of few terabytes and in some cases due to compliance and regulation requirements the volumes expectedly went up several notches higher.
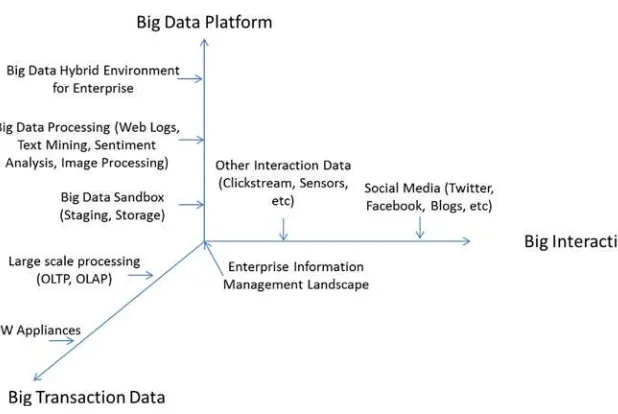
Big data is a combination of transactional data and interactive data. While technologies have mastered the art of managing volumes of transaction data, it is the interactive data that is adding variety and velocity characteristics to the ever-growing data reservoir and subsequently poses significant challenges to enterprises.
The ubiquity of the Internet has dramatically changed the way enterprises function. Essentially most every business became a “digital” business. The result was a data explosion. New application paradigms such as web 2.0, social media applications, cloud computing, and software-as-a-service applications further contributed to the data explosion. These new application paradigms added several new dimensions to the very definition of data. Data sources for an enterprise were no longer confined to data stores within the corporate firewalls but also to what is available outside the firewalls. Companies such as LinkedIn, Facebook, Twitter, and Netflix took advantage of these newer data sources to launch innovative product offerings to millions of end users; a new business paradigm of “consumerism” was born.
Data regardless of type, location, and source increasingly has become a core business asset for an enterprise and is now categorized as belonging to two camps: internal data
(enterprise application data) and external data (e.g., web data). With that, a new term has emerged: big data. So, what is the definition of this all-encompassing arena called “big data”?
To start with, the definition of big data veers into 3Vs (exploding data volumes, data getting generated at high velocity and data now offering more variety); however, if you scan the Internet for a definition of big data, you will find many more interpretations. There are also other interesting observations around big data: it is not only the 3Vs that need to be considered, rather when the scale of data poses real challenges to the traditional data management principles, it can then be considered a big data problem. The heterogeneous nature of big data across multiple platforms and business functions makes it difficult to be managed by following the traditional data management principles, and there is no single platform or solution that has answers to all the questions related to big data. On the other hand, there is still a vast trove of data within the enterprise firewalls that is unused (or underused) because it has historically been too voluminous and/or raw (i.e., minimally structured) to be exploited by conventional information systems, or too costly or complex to integrate and exploit.
Big data is more a concept than a precise term. Some categorize big data as a volume issue, only to petabyte-scale data collections (> one million GB); some associate big data
Figure 1-1. Transforming raw data into action-guiding wisdom
Collecting
Organizing
Summarizing Analyzing
Synthesizing Decision Making
Actionable Insight
Knowledge
Information
CHAPTER 1 ■ “BIG DATA” IN THE ENTERPRISE
with the variety of data types even if the volume is in terabytes. These interpretations have made big data issues situational.
The pervasiveness of the Internet has pushed generation and usage of data to unprecedented levels. This aspect of digitization has taken a new meaning. The term “data” is now expanding to cover events captured and stored in the form of text, numbers, graphics, video, images, sound, and signals.
Table 1-1 illustrates the measures of scale of data.
Table 1-1. Measuring Big Data
1000 Gigabytes (GB) = 1 Terabyte (TB)
1000 Terabytes = 1 Petabyte (PB)
1000 Petabytes = 1 Exabyte (EB)
1000 Exabytes = 1 Zettabyte (ZB)
1000 Zettabytes = 1 Yottabyte (YB)
Is big data a new problem for enterprises? Not necessarily.
Big data has been of concern in few selected industries and scenarios for some time: physical sciences (meteorology, physics), life sciences (genomics, biomedical research), financial institutions (banking, insurance, and capital markets) and government (defense, treasury). For these industries, big data was primarily a data volume problem, and to solve these data-volume-related issues they had heavily relied on a mash-up of custom-developed technologies and a set of complex programs to collect and manage the data. But, when doing so, these industries and vendor products generally made the total cost of ownership (TCO) of the IT infrastructure rise exponentially every year.
CIOs and CTOs have always grappled with dilemmas like how to lower IT costs to manage the ever-increasing volumes of data, how to build systems that are scalable, how to address performance-related concerns to meet business requirements that are becoming increasingly global in scope and reach, how to manage data security, and privacy and data-quality-related concerns. The polystructured nature of big data has made the concerns increase in manifold ways: how does an industry effectively utilize the poly-structured nature of data (structured data like database content, semi-structured data like log files or XML files and unstructured content like text documents or web pages or graphics) in a cost effective manner?
We have come a long way from the first mainframe era. Over the last few years, technologies have evolved, and now we have solutions that can address some or all of these concerns. Indeed a second mainframe wave is upon us to capture, analyze, classify, and utilize the massive amount of data that can now be collected. There are many instances where organizations, embracing new methodologies and technologies, effectively leverage these poly-structured data reservoirs to innovate. Some of these innovations are described below:
Search at scale
•
Multimedia content
•
Sentiment analysis
Enriching and contextualizing data
•
Data discovery or exploratory analytics
•
Operational analytics or embedded analytics
•
In this chapter, we will briefly discuss these use cases; there are several more such use cases, which will be discussed in later chapters.
Search at Scale
In the early days of the Internet, search was primarily used to page through simple lists of results, matching the search objective or key words. Search as a technology has evolved immensely since then. Concepts like iteratively refining a search request by selecting (or excluding) clusters or categories of results, parametric search and guided navigation, type-ahead query suggestions, auto-spelling correction and fuzzy matching (matching via synonyms, phonetics, and approximate spelling) have revolutionized effective means of searching and navigating large volumes of information.
Using natural language processing (NLP) technologies and semantic analysis, it is possible to automatically classify and categorize even big-data-size collections of unstructured content; web search engines like Google, Yahoo!, and Bing are exploiting these advances in technologies today.
Multimedia Content
Multimedia content is fascinating, as it consists of user-generated content like photos, audio files, and videos. From a user perspective this content contains a lot of information: e.g., where was the photo taken, when it was taken, what was the occasion, etc. But from a technology perspective all this metadata needs to be manually tagged with the content to make some meaning out of it, which is a daunting task. Analyzing and categorizing images is an area of intense research. Exploiting this type of content at big data scale is a real challenge. Recent technologies like automatic speech-to-text transcription and object-recognition processing (Content-Based Image Retrieval, or CBIR) are enabling us to structure this content in an automated fashion. If these technologies are used in an industrialized fashion, significant impacts could be made in areas like medicine, media, publishing, environmental science, forensics, and digital asset management.
Sentiment Analysis
CHAPTER 1 ■ “BIG DATA” IN THE ENTERPRISE
Companies have started leveraging sentiment analysis technology to understand the voice of consumers and take timely actions such as the ones specified below:
Monitoring and managing public perceptions of an issue, brand,
•
organization, etc. (called reputation monitoring)
Analyzing reception of a new or revamped service or product
•
Anticipating and responding to potential quality, pricing,
•
or compliance issues
Identifying nascent market growth opportunities and trends in
•
customer demand
Enriching and Contextualizing Data
While it is a common understanding that there is a lot of noise in unstructured data, once you are able to collect, analyze, and organize unstructured data, you can then potentially use it to merge and cross-reference with your enterprise data to further enhance and contextualize your existing structured data. There are already several examples of such initiatives across companies where they have extracted information from high-volume sources like chat, website logs, and social networks to enrich customer profiles in a Customer Relationship Management (CRM) system. Using innovative approaches like Facebook ID and Google ID, several companies have started to capture more details of customers, thereby improving the quality of master data management.
Data Discovery or Exploratory Analytics
Data discovery or exploratory analytics is the process of analyzing data to discover something that had not been previously noticed. It is a type of analytics that requires an open mind and a healthy sense of curiosity to delve deep into data: the paths followed during analysis are in no pre-determined patterns, and success is heavily dependent on the analyst’s curiosity as they uncover one intriguing fact and then another, till they arrive at a final conclusion.
This process is in stark contrast to conventional analytics and Online Analytical Processing (OLAP) analysis. In classic OLAP, the questions are pre-defined with additional options to further drill down or drill across to get to the details of the data, but these activities are still confined to finite sets of data and finite sets of questions. Since the activity is primarily to confirm or refute hypotheses, classic OLAP is also sometimes referred to as Confirmatory Data Analysis (CDA).
It is not uncommon for analysts cross-referencing individual and disconnected collections of data sets during the exploratory analysis activity. For example, analysts at Walmart cross-referenced big data collections of weather and sales data and discovered that hurricane warnings trigger sales of not just flashlights and batteries (expected) but also strawberry Pop Tarts breakfast pastries (not expected). And they also found that the top-selling pre-hurricane item is beer (surprise again).
In 2004, with hurricane Frances approaching, Walmart analysts analyzed their sales data from their data warehouse; they were looking for any tell-tale signs of sales that happened due to the recently passed hurricane Charley. They found beer and pastries were the most-purchased items in a pre-hurricane timeframe, and they took action to increase supplies of these products stores in Frances’s path.
The fascinating aspect of Walmart’s example is imagining what could happen if we leverage machine-learning algorithms to discover such correlations in an automated way.
Operational Analytics or Embedded Analytics
While exploratory analytics are for discovery and strategies, operational analytics are to deliver actionable intelligence on meaningful operational metrics in real or near-real time. The realm of operational analytics is in the machine-generated data and machine-to-machine interaction data. Companies (particularly in sectors like telecommunications, logistics, transport, retailing, and manufacturing) are producing real-time operational reporting and analytics based on such data and significantly improving agility, operational visibility, and day-to-day decision making as a result.
Dr. Carolyn McGregor of the University of Ontario is using big data and analytics technology to collect and analyze real-time streams of data like respiration, heart rate, and blood pressure readings captured by medical equipment (with electrocardiograms alone generating 1,000 readings per second) for early detection of potentially fatal infections in premature babies.
Another fascinating example is in the home appliances area. Fridges can be embedded with analytics modules that sense data from the various items kept in the fridge. These modules give readings on things like expiry dates and calories and provides timely alerts either to discard or avoid consuming the items.
Realizing Opportunities from Big Data
Big data is now more than a marketing term. Across industries, organizations are assessing ways and means to make better business decisions utilizing such untapped and plentiful information. That means as the big-data technologies evolve and more and more business use cases come into the fray, the need for groundbreaking new approaches to computing, both in hardware and software, are needed.
As enterprises look to innovate at a faster pace, launching innovative products and improve customer services, they need to find better ways of managing and utilizing data both within the internal and external firewalls. Organizations are realizing the need for and the importance of scaling up their existing data management practices and adopting newer information management paradigms to combat the perceived risk of reduced business insight (while the volume of data is increasing rapidly, it is also posing an interesting problem). So an organization’s ability to analyze that data to find meaningful insights is becoming increasingly complex.
CHAPTER 1 ■“BIG DATA” IN THE ENTERPRISE
extract value from very large volumes of a wide variety of data, by enabling high-velocity capture, discovery, and/or analysis.”
Big data technology and capability adoption across different enterprises is varied, ranging from web 2.0 companies such as Google, LinkedIn, and Facebook (their business being wholly dependent on these technologies) to Fortune 500 companies embarking on pilot projects to evaluate how big data capability can co-exist with existing traditional data management infrastructures. Many of the current success stories with big data have come about with companies enabling analytic innovation and creating data services, embedding a culture of innovation to create and propagate new database solutions, enhancing existing solutions for data mining, implementing predictive analytics, and machine learning techniques, complemented by the creation of new skills and roles such as data scientists, big data architects, data visualization specialists, and data engineers leveraging NoSQL products, among others. These enterprises’ experiences in the big data landscape are characterized by the following categories: innovation, acceleration, and collaboration.
Innovation
Innovation is characterized by the usage of commodity hardware and distributed processing, scalability through cloud computing and virtualization, and the impetus to deploy NoSQL technologies as an alternative to relational databases. Open-source solution offerings from Apache such as the Hadoop ecosystem are getting into
mainstream data management, with solution offerings from established companies such as IBM, Oracle, and EMC, as well as upcoming startups such as Cloudera, HortonWorks, and MapR. The development of big data platforms is perhaps the logical evolution of this trend, resulting in a comprehensive solution across the access, integration, storage, processing, and computing layers. Enterprises will continue to establish big data management capabilities to scale utilization of these innovative offerings, realizing growth in a cost- effective manner.
Acceleration
Enterprises across all industry domains are beginning to embrace the potential of big data impacting core business processes. Upstream oil and gas companies collect and process sensor data to drive real-time production operations, maintenance, and reliability programs. Electronic health records, home health monitoring, tele-health, and new medical imaging devices are driving a data deluge in a connected health world. Emerging location-based data, group purchasing, and online leads allow retailers to continuously listen, engage, and act on customer intent across the purchasing cycle. Mobile usage data for telecom service providers unlock new business models and revenue streams from outdoor ad placements.
The imperative for these enterprises is to assess their current Enterprise Information Management (EIM) capabilities, adopt and integrate big data initiatives and embark on programs to enhance their business capabilities and increased competitiveness.
Collaboration
Collaboration is the new trend in the big data scenario, whereby data assets are
commoditized, shared, and offered as a product of data services. Data democratization is a leading motivator for this trend. Large data sets from academia, government, and even space research are now available for the public to view, consume, and utilize in creative ways. Data.gov is an example of a public service initiative where public data is shared and has sparked similar initiatives across the globe. Big data use cases are reported in climate modeling, political campaign strategy, poll predictions, environment management, genetic engineering, space science, and other areas.
Data aggregators, data exchanges and data markets such as those from InfoChimps, Factual, Microsoft Azure market place, Axciom and others have come up with data service offerings whereby “trusted” data sets are made available for free or on a subscription basis. This is an example where data sets are assessed with an inherent value as data products.
Crowdsourcing is a rapidly growing trend where skilled and passionate people collaborate to develop innovative approaches to develop insights and recommendation schemes. Kaggle offers a big data platform for predictive modeling and analytic competitions effectively making “data science a sport.” Visual.ly offers one of the largest data visualization showcases in the world, effectively exemplifying the collective talent and creativity of a large user base.
The possibilities for new ideas and offerings will be forthcoming at a tremendous rate in the coming years. As big data technologies mature and become easier to deploy and use, expect to see more solutions coming out especially merging with the other areas of cloud, mobile, and social media.
There is widespread awareness of the revenue and growth potential from enterprise data assets. Data management is no longer seen as a cost center. Enterprise information management is now perceived to be a critical initiative that can potentially impact the bottom line. Data-driven companies can offer services like data democratization and data monetization to launch new business models.
Note
■
Data democratization, the sharing of data and making data available to anyone
that was once available only to a select few, is leading to creative usage of data such as
data mashups and enhanced data visualization. Data monetization (i.e., the business model
of offering data sets as a shareable commodity) has resulted in data service providers such
as data aggregators and data exchanges.
CHAPTER 1 ■ “BIG DATA” IN THE ENTERPRISE
New Business Models
There is a growing awareness and realization that big data analytics platforms are enabling new business models that were previously not possible or were difficult to realize.
Utilizing big data technologies and processes holds the promise for improving operational efficiencies and generation of more revenues from new and/or enhanced sales channels.
Enterprises have already realized the benefits obtained by managing enterprise data as an integral and core asset to manage their business and gain competitive advantage from enhanced data utilization and insight.
Over the years, tremendous volumes of data have been generated. Many enterprises have had the foresight not to discard these data and headed down the path to establish enhanced analytical capabilities by leveraging large-scale transactional, interaction data and lately social media data and machine-generated data. Even then, Forrester estimates that only 1 to 1.5 percent of the available data is leveraged. Hence, there is the tantalizing picture of all the business opportunities that can come about with increased utilization of available data assets and newer ways of putting data to good use.
New Revenue Growth Opportunities
The big data age has enabled enterprises of all sizes ranging from startups to small business and established large enterprises to utilize a new generation of processes and technologies. In many instances the promise of overcoming the scalability and agility challenges of traditional data management, coupled with the creative usage of data from multiple sources, have enterprise stakeholders taking serious notice of their big data potential.
McKinsey’s analysis (summarized in Figure 1-2) indicates that big data has the potential to add value across all industry segments. Companies likely to get the most out of big data analytics include:
Financial services: Capital markets generate large quantities of
•
stock market and banking transaction data that can help in fraud detection, maximizing successful trades, etc.
Supply chain, logistics, and manufacturing: With RFID sensors,
•
handheld scanners, and on-board GPS vehicle and shipment tracking, logistics and manufacturing operations produce vast quantities of information to aid in route optimization, cost savings, and operational efficiency.
Online services and web analytics: Firms can greatly benefit from
•
increasing their customer intelligence and using it for effective cross-selling/up.
Energy and utilities: “Smart grids” and electronic sensors
•
attached to machinery, oil pipelines and equipment generate streams of incoming data that can be used for preventive means to avoid disastrous failures.
Media and telecommunications: Streaming media, smartphones,
•
When big data is distilled and analyzed in combination with traditional enterprise data, enterprises can develop a more thorough and insightful understanding of their
Health care and life sciences: Analyzing electronic medical records
•
systems in aiding optimum patient treatment options and analyzing data for clinical studies can heavily influence both individual patients’ care and public health management and policy.
Retail and consumer products: Retailers can analyze vast
•
quantities of sales transaction data and understand the buying behaviors, as well as make effective individual-focused customized campaigns by analyzing social networking data.
Volume of Data
Velocity of Data
Variety of Data
Under -Utilized Data (‘Dark Data’)
Big Data Value Potential
Banking and Securities
High High Low Medium High
Communications & Media Services
High High High Medium High
Education Very Low Very Low Very Low High Medium
Government High Medium High High High
Healthcare Providers
Medium High Medium Medium High
Insurance Medium Medium Medium Medium Medium
Manufacturing High High High High High
Chemicals & Natural Resources
High High High High Medium
Retail High High High Low High
Transportation Medium Medium Medium High Medium
Utilities Medium Medium Medium Medium Medium
CHAPTER 1 ■ “BIG DATA” IN THE ENTERPRISE
business, which can lead to enhanced productivity, a stronger competitive position, and greater innovation—all of which can have a significant impact on the bottom line.
For example, collecting sensor data through in-home health-care monitoring devices can help analyze patients’ health and vital statistics proactively. This is especially critical in case of elderly patients. Health-care companies and medical insurance companies can then make time interventions to save lives or prevent expenses by reducing hospital admissions costs.
The proliferation of smart phones and other GPS devices offers advertisers an opportunity to target consumers when they are in close proximity to a store, a coffee shop, or a restaurant. This opens up new revenue for service providers and offers many businesses a chance to target new customers.
Retailers usually know who buys their products. Use of social media networks and web-log files from their e-commerce sites can help them understand who didn’t buy and why they chose not to. This can enable much more effective micro customer segmentation and targeted marketing campaigns, as well as improve supply chain efficiencies.
Companies can now use sophisticated metrics to better understand their
customers. To better manage and analyze customer information, companies can create a single source for all customer interactions and transactions. Forrester believes that organizations can maximize the value of social technologies by taking a 720-degree view of their customers instead of the previous 360-degree view. In the telecom industry, applying predictive models to manage customer churn has long been known as a significant innovation; however, today the telecom companies are exploring new data sources like customers’ social profiles to further understand customer behavior and perform micro-segmentations of their customer base. Companies must manage and analyze their customers’ profiles to better understand their interactions with their networks of friends, family, peers, and partners. For example, using social relationships the company can further analyze whether customer attrition from their customer base is also influencing similar behavior from a host of other customers who have social connections with the same customer. By doing this kind of linkage analysis companies can better target their retention campaigns and increase their revenue and profit.
Note
■
What the “720-degree customer view” involves is compiling a more comprehensive
(some might say “intrusive”) portrait of the customers. In addition to the traditional
360-de-gree view of the customer’s external behavior with the world (i.e., their buying, consuming,
influencing, churning, and other observable behaviors), you add an extra 360 degrees of
internal behavior (i.e, their experiences, propensities, sentiments, attitudes, etc.) culled from
behavioral data sources and/or inferred through sophisticated analytics. (Source:
Targeted
Marketing: When Does Cool Cross Over to Creepy?
James Kobielus October 30, 2012.)
Taming the “Big Data”
benefits. Figure 1-3 provides an illustration of how the evolution of big data happened over different timelines.
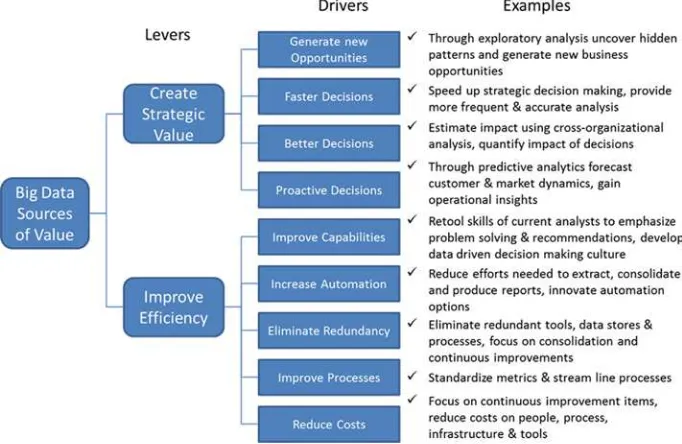
Another key aspect of leveraging big data is to also understand where it can be used, when it can be used, and how it can be used. Figure 1-4 is an illustration of how the value drivers of big data are aligned to an organization’s strategic objectives.
CHAPTER 1 ■ “BIG DATA” IN THE ENTERPRISE
In some industries big data has spurred entirely new business models. For example, retail banking has started to exploit social media data to create tailored products and offerings for customers in capital markets; due to the onset of algorithmic trading, massive amounts of market data are getting captured, which in turn is helping the regulators to spot market manipulation activities in real time. In the retail sector, big data is expediting analysis of in-store purchasing behaviors, customer footprint analysis, inventory optimization, store layout arrangement—all in near-real time.
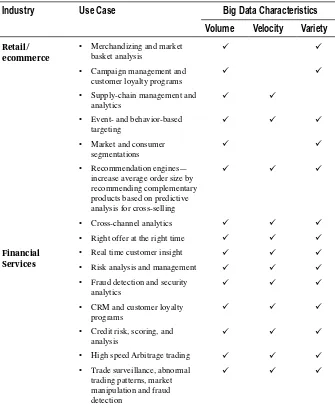
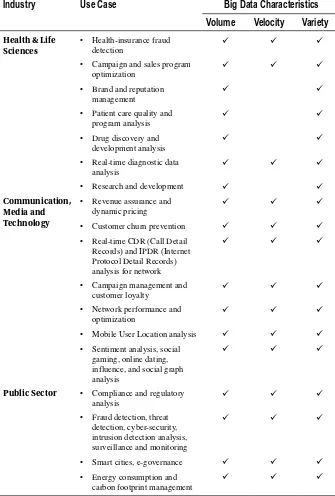
While every industry uses different approaches and focuses on different aspects from marketing to supply chain, almost all are immersed in a transformation that leverages analytics and big data (see Figure 1-5).
Figure 1-5. Industry use cases for big data
Yet few organizations have fully grasped what big data is and what it can mean for the future. At present most of the big data initiatives are at an experimental stage. While we believe no organization should miss the opportunities that big data offers, the hardest part is knowing how to get started. Before you embark on a big data initiative, you should get answers to the following four questions to help you on your transformation journey:
Where will big data and analytics create advantages for
•
the company?
How should you organize to capture the benefits of big data
•
and analytics?
What technology investments can enable the analytics
•
capabilities?
How do you get started on the big data journey?
Where Will Big Data and Analytics Create Advantages
for the Company?
Understanding where big data can drive competitive advantage is essential to realizing its value. There are quite a number of use cases, but some important ones are customer intimacy, product innovation, and operations efficiency.
Big data puts the customer at the heart of corporate strategy. Information on social-media platforms such as Facebook is particularly telling, with users sharing nearly 30 billion pieces of content daily. Organizations are collecting customer data from interactive websites, online communities, and government and third-party data markets to enhance and enrich the customer profiles. Making use of advanced analytics tools, organizations are creating data mash-ups by bringing together social-media feeds, weather data, cultural events, and internal data such as customer contact information to develop innovative marketing strategies.
Let’s look at few other real-world examples of how big data is helping on customer intimacy. US retailer Macy’s is using big data to create customer-centric assortments. Moving beyond the traditional data analysis scenarios involving sell-through rates, out-of-stocks, or price promotions within the merchandising hierarchy, the retailer with the help of big data capabilities is now able to analyze these data points at the product or SKU level at a particular time and location and then generate thousands of scenarios to gauge the probability of selling a particular product at a certain time and place: ultimately optimizing assortments by location, time, and profitability.
Online businesses and e-commerce applications have revolutionized customized offerings in real time. Amazon has been doing this for years by displaying products in a “Customers who bought this item also bought these other items” kind of format. Offline advertising like ad placement and determining the prime time slots and which TV programs will deliver the biggest impact for different customer segments are fully leveraging big data analytics.
Big data was even a factor in the 2012 US Presidential election. The campaign management team collated data from various aspects like polling, fundraising, volunteers, and social media into a central database. Then they were able to assess individual voters’ online activities and ascertain whether campaign tactics were producing results. Based on the data analysis, the campaign team developed targeted messaging and communications at individual voter levels which prompted exceptionally high turnout: this was considered one of the critical factors in Obama’s re-election.
CHAPTER 1 ■ “BIG DATA” IN THE ENTERPRISE
Some data, once captured, can enable long-established companies to generate revenue and improve their products in new ways. GE is planning a new breed of “connected equipment,” including its jet engines, CT scanners, and generators armed with sensors that will send terabytes of data over the Internet back to GE product engineers. The company plans to use that information to make its products more efficient, saving its customers billions of dollars annually and creating a new slice of business for GE.
Finally, imagine the potential big data brings to running experiments—taking a business problem or hypothesis and working with large data sets to model, integrate, analyze, and determine what works and what doesn’t, refine the process, and repeat. This activity for online webpages is popularly referred to as A/B testing, Facebook runs thousands of experiments daily with one set of users seeing different features than others; Amazon offers different content and dynamic pricing to various customers and makes adjustments as appropriate.
Operations efficiency: At an operational level, there are a lot of machine- generated data that offer a variety of information-rich interactions, including physical product movements captured through radio frequency identification (RFID) and micro-sensors. Machine-generated data, if captured and analyzed during real time, can provide significant process improvement opportunities across suppliers, manufacturing sites, customers, and can lead to reduced inventory, improved productivity, and lower costs.
For example, in a retail chain scenario, it is quite common to have detailed SKU inventory information to identify overstocks at one store that could be sold in another. However, without a big data and analytics platform, the retail chain is constrained to only identify the top 100 overstocked SKUs. By establishing a big data and analytics platform, the detailed SKU level analysis can be done on the entire data set (several terabytes of operational data) and create a comprehensive model of SKUs across thousands of stores. The chain can then quickly move hundreds of millions of dollars in store overstocks to various other stores, thereby reducing the inventory cost at some stores while increasing sales at other stores and overall net gains for the retail chain.
How Should You Organize to Capture the Benefits
of Big Data and Analytics?
Big data platforms provide a scalable, robust, and low-cost option to process large and diverse data sets; however, the key is not in organizing and managing large data sets but to generate insights from the data. This is where specialists such as data scientists come into the picture, interpreting and converting the data and relationships into insights.
Data scientists combine advanced statistical and mathematical knowledge along with business knowledge to contextualize big data. They work closely with business managers, process owners, and IT departments to derive insights that lead to more strategic decisions.
how many times it happened. In the initial level, most of the analysis is reactive in nature and looks backward into historical data. The analysis performed at this level does not have repeatability and in most cases is ad-hoc in nature; the data management platforms and analyst teams are set up on an as-needed basis. The next level of maturity is
“Repeatable and Defined:” at this level, you start looking into unique drivers, root causes, cause-effect analysis as well as performing simulation scenarios like “What-If.” At this level, the data management platforms are in place and analysts’ teams have a pre-defined role and objectives to support. The next level is “Optimized and Predictive”: at this level, you are doing deeper data analysis, performing business modeling and simulations with a goal to predict what will happen.
Figure 1-6. Analytics process maturity
While the analytics process maturity levels help organizations to identify where they are at present and then gives them a road map to get to the desired higher levels of maturity, another critical component in the transformational journey is the organization model. You can have the best tools installed and the best people in your team, but if you do not have a rightly aligned organizational model, your journey becomes tougher.
CHAPTER 1 ■“BIG DATA” IN THE ENTERPRISE
In a “decentralized” model, each business or function will have its own analytics team: for example, sales and marketing will have their own team, finance will have their own team, etc. On the one hand, this enables rapid analysis and execution outcomes, but on the other hand the insights generated are narrow and restrictive to that business function only, and you will not reap the benefit of a broader, game-changing idea. In addition, the focus and drive for analytics is not driven top down from the highest level of sponsorship; as a result, most analytics activities happen in bursts with little to no strategic planning or organizational commitments.
The “shared services” model addresses a few of the shortcomings of the
decentralized model by bringing the analytics groups into a centralized model. These “services” were initially governed by bygone systems, existing functions or business units, but with a clear goal to serve the entire organization. While these were standardized processes, the ability to share best practices and organization-wide analytics culture is what makes the shared services model superior to the decentralized model. Insight generation and decision making could easily become a slow process: the reason is that there was no clear owner of this group, and it is quite common to see conflicting requirements, business cases, etc.
The “independent” model is similar to the “shared services” model but exists outside organizational entities or functions. It has direct executive-level reporting and elevates analytics to a vital core competency rather than an enabling capability. Due to the highest level of sponsorship, this group can quickly streamline requirements, assign prioritizations and continue on their insight generation goals.
Figure 1-7. Analytics organization models
A centralized analytics unit ensures a broader sweep of insight generation objectives for the entire business. It also addresses another critical area: skills and infrastructure. Many of the roles integral to big data and analytics already exist in most organizations; however, developing a data-driven culture and retaining the rare skills of a data scientist, for instance, are critical to the success of the transformation journey.
What Technology Investments Can Enable
the Analytics Capabilities?
Big data and analytics capabilities necessitate transformation of the IT architecture at an appropriate cost. For the last decade or so, organizations have invested millions of dollars in establishing their IT architectures, but for the reasons discussed earlier in this chapter and further influenced by the very changing nature of the data, those investments needs to be critically evaluated. This requires leveraging the old with the new. Unlike the enterprise architecture standards, which are stable and time tested, the big data and analytics architectures are new and still evolving, hence it is all the more important to critically review all the options that exist to make the correct technology investments.
As the complexity of data changes from structured to unstructured, from “clean” in-house data to “noise infected” external data, and from one-dimensional transactional data flow to multi-dimensional interaction data flow, the architecture should be robust and scalable enough to efficiently handle all of these challenges.
CHAPTER 1 ■ “BIG DATA” IN THE ENTERPRISE
Each one of these layers are further grouped to reflect the market segments for new big data and analytics products:
• Vertical applications, or product suites, consist of a single vendor providing the entire stack offering. Examples are Hadoop Ecosystem, IBM Big Data Insight, Oracle Exalytics, SAP BI and HANA, among others.
• Decision support products specialize in traditional EDW and BI suites.
• Reporting and visualization tools are new, and they specialize in how to represent the complex big data and analytics results in an easy-to-understand and intuitive manner.
• Analytics services specialize on sophisticated analytics modules, some of them could be cross-functional like claims analytics or customer churn, while some could be very deep in specific areas like fraud detection, warranty analytics, among others.
• Parallel distributed processing and storage enable massively parallel processing (MPP), in-memory analytics for more structured data.
• Loosely structured storage captures and stores unstructured data.
• Highly structured storage captures and stores traditional databases, including their parallel and distributed manifestations.
How Do You Get Started on the Big Data Journey?
For every successful big data implementation, there is an equally successful change management program. To bring the point home, let’s discuss the case of a hypothetical traditional big-box retailer. The company had not seen positive same-store sales for years, and the market was getting more competitive. A member of the executive team complained that “online retailers are eating our lunch.” Poor economic conditions, changing consumer behaviors, new competitors, more channels, and more data were all having an impact. There was a strong push to move aggressively into e-commerce and online channels. The retailer had spent millions of dollars on one-off projects to fix the problems, but nothing was working. Several factors were turning the company toward competing on analytics: from competitors’ investments and a sharp rise in structured and unstructured data to a need for more insightful data.
Transforming analytical capabilities and big data platform begins with a well-thought-out, three-pronged approach (see Figure 1-9).
Figure 1-9. Big data journey roadmap
CHAPTER 1 ■ “BIG DATA” IN THE ENTERPRISE
but also provide a shield to future crises. The company planned to set up an analytics organization with four goals in mind:
Deliver information tailored to meet specific needs across the organization.
Build the skills needed to answer the competition.
Create a collaborative analytical platform across the organization.
Gain a consistent view of what is sold across channels and geographies.
Build future-state capability scenarios. The retailer was eager to develop scenarios for future capabilities, which were evaluated in terms of total costs, risks, and flexibility and determined within the context of the corporate culture. For example, is the business data driven? Or is the company comfortable with hypothesis-based thinking and experimentation? Both are the essence of big data. The company critically reviewed their existing IT architecture in the context of crucial business opportunities, such as leveraging leading-edge technologies and providing a collaboration platform, integrating advanced analytics with existing and new architecture, and building a scalable platform for multiple analytic types. The new technology architecture was finalized to enable the following five key capabilities:
Predicting customers’ purchasing and buying behaviors.
•
Developing tailored pricing, space, and assortment at stores.
•
Identifying and leveraging elasticity, affinities, and propensities
•
used in pricing.
Optimizing global data sourcing from multiple locations and
•
business units.
Define benefits and road map. Armed with these capabilities, the next questions revolve around cost-benefit analysis and risks to be mitigated. Does the company have skills in-house or would it be more cost effective to have external resources provide the big data analytics, at least initially? Would it make financial sense to outsource, or should the company persist with internal resources? For each one, do the company and the analytics team have a clear view of the data they need? All these mean significant investment: is there a ROI plan prepared with clear milestones?
The company, in its transformation journey, is now positioned to realize four key benefits from its big data and analytics strategy:
Delivers consistent information faster and more inexpensively.
•
Summarizes and distributes information more effectively across
•
the business to better understand performance and opportunities to leverage the global organization.
Develops repeatable and defined BI and analytics instead of every
•
group reinventing the wheel to answer similar questions.
Generates value-creating insights yet to be discovered through
•
advanced analytics.
End Points
The massiveness of data and the complex algorithms it requires is an important issue; but it isn’t the most important one. To manage big data you don’t have to set up a massive scale of hardware infrastructures anymore; cloud services have given us the capability to run very large server clusters at a low startup cost. Open-source projects from Google and Yahoo have created big data platforms such as the Hadoop ecosystem, enabling processing of massive amounts of data in a distributed data-processing paradigm. These technology evolutions have accelerated a new class of data-driven startups, it has reduced both marketing costs and the time it takes for these startups to flourish. And it has allowed startups that were not necessarily data driven to become more analytical as they evolved, such as Facebook, LinkedIn, Twitter, and many others.
Data issues can happen with even less than a terabyte of data. It is not uncommon to see teams of database administrators employed to manage the scalability and performance issues of EDW systems, which are not even on a big data scale as we discussed earlier. The big issue is not that everyone will suddenly operate at petabyte scale; a lot of companies do not have that much data. The more important topics are the specifics of the storage and processing infrastructure and what approaches best suit each problem. How much data do you have, and what are you trying to do with it? Do you need to do offline batch processing of huge amounts of data to compute statistics? Do you need all your data available online to serve queries from a web application or a service API? What is your enterprise information management strategy and how does it co-exist with the big data realm?
References
Snapshot of data activities in an internet minute: Go-Globe.com
MAD Skills: New Analysis Practices for Big Data: VLDB ’09, August 24-28, 2009, Lyon, France
The next frontier of innovation, competition and productivity: Mckinsey.com
Bringing Big Data to the Enterprise, IBM, 2012
A Comprehensive List of Big Data Statistics, Wikibon Blog, 1 August 2012 eBay Study: How to Build Trust and Improve the Shopping Experience, KnowIT
CHAPTER 1 ■ “BIG DATA” IN THE ENTERPRISE
Big Data Meets Big Data Analytics, SAS, 2011
Big Data’ Facts and Statistics That Will Shock You, Fathom Digital Marketing, 8 May 2012 IT Innovation Spurs Renewed Growth at www.atkearney.com
Big Data Market Set to Explode This Year, But What is Big Data?, Smart Planet, 21 February 2012
Corporations Want Obama’s Winning Formula, Bloomberg Businessweek, 21 November 2012
Mapping and Sharing the Consumer Genome, The New York Times, 16 June 2012 GE Tries to Make Its Machines Cool and Connected, Bloomberg Businessweek,
6 December 2012
GE’s Billion-Dollar Bet on Big Data, Bloomberg Businessweek, 26 April 2012 The Science of Big Data at www.atkearney.com
Data Is Useless Without the Skills to Analyze It, Harvard Business Review, 13 September 2012
MapReduce and MPP: Two Sides of the Big Data Coin, ZDNet, 2 March 2012 Hadoop Could Save You Money Over a Traditional RDBMS, Computerworld UK,
10 January 2012
The New Information
Management Paradigm
The ubiquitous nature of data and the promises it has shown for enterprises
necessitates a new approach to enterprise information management.
What Is Enterprise Information Management?
For an enterprise to carry out its functions, it needs an ecosystem of business applications, data platforms to store and manage the data, and reporting solutions to provide a view into how the enterprise is performing. Large enterprises with multiple strategic business focus areas need many such applications, and as often seen, over the years the enterprise landscape gets into a spaghetti-like situation where it becomes incomprehensible to articulate which application and which data store does what! Various reasons can be attributed to such a state: lack of enterprise-wide data standards, minimal metadata management processes, inadequate data quality and data governance measures, unclear data archival policies and processes, so on.
In order to overcome this problematic situation, enterprise information management as an organization-wide discipline is needed. Enterprise Information Management (EIM) is a set of data management initiatives to manage, monitor, protect, and enhance the information needs of all the stakeholders in the enterprise. In other words, EIM lays down foundational components and appropriate policies to deliver the right data at the right place at the right time to the right users.
CHAPTER 2 ■ THE NEW INFORMATION MANAGEMENT PARADIGM Enterprise Data Models & Data Stores
Governance
Figure 2-1. Enterprise information management framework
The entire framework of EIM has to exist in a collaborative business and IT
environment. EIM in a small company or in a startup may not require the same approach and rigor as EIM in a large, highly matured and/or advanced enterprise. The interactions between the components will vary from industry to industry and will be largely
governed by business priorities; following a one-size fits all kind of approach to EIM implementation may amount to overkill in many situations. But in general, the following are key components any data-driven enterprise must pay attention to.
1. Business Model: This component reflects how your organization operates to accomplish its goals. Are you metrics driven? Are you heavily outsourced, or do you do everything in-house? Do you have a wider eco-system of partners/suppliers or do you transact only with a few? Are your governance controls and accountability measures centralized, decentralized, or federated? The
manner in which you get your business objectives successfully implemented down to the lowest levels is your business model.
EIM by definition covers all enterprise information,
including reports, forms, catalogs, web pages, databases, and spreadsheets: in short, all enterprise- related structured and unstructured data. All enterprise content may be valuable, and all enterprise content can pose risk. Thus enterprise information should be treated as an asset.
3. Enterprise Technology and Architecture: Every enterprise has a defined set of technology and architectures upon which business applications are developed and deployed. Although technology and architecture are largely under the IT department’s purview, business requirements and priorities often dictate which technology and architecture to follow. For example, if the company’s business is primarily through online applications, then the enterprise technologies and architectures will have a heavy footprint of web-centric technology and architectures. If the company decides they would like to interact with their customers through mobile channels, then you need to make provisions for mobility as well. The choice of technologies and architectures also reflects the type of industry the business belongs to. For example, in the financial services industry where data security and privacy is of utmost concern, it is normal for companies to invest in only a few enterprise-scale platforms, whereas for the retail industry such measures may not be required. So, you will see a plethora of technologies and architectures, including open source systems. The extent to which organizations deploy various technologies and architectures is also a component of EIM.
4. Organization and Culture: Who is responsible for managing your data? Is it business or IT or both? If you want your enterprise data to be treated as an asset, you need to define an owner for it. You will need to implement positions and accountabilities for the information being managed. You cannot manage inventory without a manager, and you cannot tackle information management without someone accountable for accuracy and availability.
EIM helps in establishing a data-driven culture within the enterprise. Roles like data stewards further facilitate the data-driven culture, where right from the CxO levels to the lowest level, people in your organization use data to make informed decisions as opposed to gut-feel decisions.
5. Business Applications: How data is used is directly
CHAPTER 2 ■THE NEW INFORMATION MANAGEMENT PARADIGM
Your transactional applications, operational applications, and decision support applications are all considered to be business applications. You just don’t go on creating various types of business applications blindly. The company’s business priorities and road maps serve as a critical input to define what kind of business applications need to be built and when. These inputs are then fed into the EIM program to determine what technology and architectures are required, how they will be governed, who will use them, and so on.
6. Enterprise Data Model and Data Stores: Enterprise business applications can’t run by themselves, so they will need data models and data stores. It is not uncommon to find numerous data models and data stores in an enterprise setup. Too many data models and data stores can cause severe challenges to the enterprise IT infrastructure and make it inefficient; but at the same time, too few data models and data stores will put the company at the risk of running its business optimally. A balance needs to be achieved, and EIM helps in defining policies, standards, and procedures to bring some sanity to the enterprise functioning.
7. Information Lifecycle Management: Data and content have a lifecycle. It gets created through transactions and interactions and is used for business-specific purposes; it also gets changed and manipulated following business specific rules, and it gets read and analyzed across the enterprise and then finally reaches a stage where it must be archived for later reference or purged, as it has attained a “use by” state.
EIM defines the data policies and procedures for data usage and thus
balances the conflict of retiring data versus the cost and risk of keeping data
forever.
Information lifecycle management, if properly defined, also helps in addressing the following common questions:
What data is needed, and for how long?
•
How can my business determine which data is most valuable? Are
•
we sure about the quality of the data in the organization?
How long should we store this “important” data?
•
What are the cost implications of collecting everything and
•
storing it forever? Is it even legal to store data in perpetuity?
Who is going to go back multiple years and begin conducting new
•
analysis on really old data?
I don’t understand the definitions of data elements, where will I
•
find the metadata information?
There are several important considerations around data quality, metadata
management, and master data management that need to be taken into account under the purview of information lifecycle management. A key component of EIM is to establish data lineage (where data came from, who touched it, and where and how it is used) and data traceability (how is it manipulated, who manipulated it, where it is stored, when it should be archived and/or purged).
This function of EIM is extremely valuable for any enterprise. Its absence creates data silos and unmanageable growth of data in the enterprise. In short, you need to know full lineage, definitions, and rules that go with each type of data.
Lack of appropriate data hampering business decision making is an acceptable fact; however, poor data quality leading to bad business decisions is not at all acceptable. Therefore monitoring and controlling the quality of data across the enterprise is of utmost importance. But how do we monitor the quality of data? Using metrics, of course. That means we need a process for defining data quality metrics. Below is a high-level approach to defining DQ metrics your EIM program should follow:
Define measurable characteristics for data quality. Examples
•
are: state of completeness, validity, consistency, timeliness, and accuracy that make data appropriate for a specific use.
Monitor the totality of features and characteristics of data that
•
define their ability to satisfy a given purpose.
Review the processes and technologies involved in ensuring
•
the conformance of data values to business requirements and acceptance criteria.
The end result is a set of measurement processes that associate data quality scores against each business critical data entity. These scores help in quantifying conformance to data quality expectations. Scores that do not meet the specified acceptability thresholds indicate non-conformance.
Closely associated with data quality is the concept of master data management (MDM). MDM comprises a set of processes, governance, policies, standards, and tools that consistently define and manage the master data (i.e. non-transactional data entities) of an organization (which may include reference data).
CHAPTER 2 ■ THE NEW INFORMATION MANAGEMENT PARADIGM
Data quality measures provide means to fix data related issues already
existing in the organization whereas MDM, if implemented properly,
prevents data-quality-related issues from happening in the organization.
Metadata management deals with the softer side of the data-related issues, but it is one of the key enablers within the purview of information lifecycle management. The simplest definition of metadata is “data about data.” In other words, metadata can be thought of as a label that provides a definition, description, and context for data. Common examples include relational table definitions and flat file layouts. More detailed examples of metadata include conceptual and logical data models.
A famous quote, sometimes referred to as “Segal’s Law,” states that: “A man with one watch knows what time it is. A man with two watches is never sure.” When it comes to the metrics used to make (or explain) critical business decisions, it is not surprising to witness the “we have too many watches” phenomenon as the primary cause of the confusion surrounding the (often conflicting) answers to common business questions, such as:
How many customers do we have?
•
How many products did we sell?
•
How much revenue did we generate?
•
Therefore, another example of metadata is providing clear definitions of what the terms “customers,” “products,” and “revenue” actually mean.
Metadata is one of the most overlooked aspects of data management, and yet it is the most difficult initiative to implement. Metadata can potentially encompass many levels; from a single data element on the database to a more complex entity, such as customer, for example, which will be a composite of other elements and/or entities.
Note
■
The topic of information lifecycle management and especially data quality, master
data management and metadata management are itself separate chapters on their own.
Here we have given brief overviews about these important concepts as they relate to data
and its management.
9. Governance: Governance is primarily a means to ensure the investments you are making in your business and IT are sustainable. Governance ensures that data standards are perpetuated; data models and data stores are not mushrooming across the enterprise, roles like data stewards are effective, and they resolve conflicts related to data arising within business silos. Most importantly, governance, if enforced in the right spirit, helps manage your data growth and cost impact optimally.
As you can see, there are many components in the EIM framework that must interact with each other in a well-orchestrated manner. When we were discussing EIM, we had mostly discussed data in a generic sense to include all possible types of data and all possible types of data sources (internal data sources as well as external data sources). EIM is at a framework level and does not necessarily anticipate what needs to be done when you are dealing with different kinds of data, especially when we refer to big data characteristics like volume, velocity, and variety.
There are several challenges (some new and some are old, but their impacts are magnified) when we start looking at the finer details of big data and how they impact the EIM framework. Does this mean we will need a radically different approach for the enterprise information management framework?
New Approach to Enterprise Information
Management for Big Data
The current approach to EIM has some fundamental challenges when confronted with the scale and characteristics of big data. Below, we will first discuss a few areas related to the very nature of big data and how it is impacting the traditional information management principles.
Type of Data: Traditional information management approaches have focused primarily on structured data. Structured data is stored and managed in data repositories such as relational databases, object databases, network databases, etc. However, today a vast majority of the data being produced is unstructured. By some estimates, about 85 percent to 90 percent of the total data asset is unstructured. This vast amount of unstructured data often goes underutilized because of the complexities involved in the parsing, modeling, and interpretation of the data.
In the big data scenario, the EIM needs to manage all kinds of
•
data, including traditional structured data, semi-structured, unstructured and poly-structured data, and content such as e-mails, web-page content, video, audio, etc.
CHAPTER 2 ■ THE NEW INFORMATION MANAGEMENT PARADIGM
database systems. While these data modeling approaches were suitable to managing data at scale and that for structured data only, the big data realm has thrown in additional challenges of variety exposing the shortcomings in the technology architecture and the performance of relational databases.
The cost of scaling and managing infrastructure while delivering
•
a satisfactory consumer experience for newer applications such as web 2.0 and social media applications has proven to be quite steep. This has led to the development of “NoSQL” databases as an alternative technology with features and capabilities that deliver the needs of the particular use case.
Data Integration: For years, traditional data warehousing and data management approaches has been supported by data integration tools for data migration and transportation using Extract-Transform-Load (ETL) approach. These tools run into throughput issues while handling large volumes of data and are not very flexible in handling semi-structured data.
To overcome these challenges in the big data scenario, there has
•
been a push toward focusing on extract and load approaches (often referred to as data ingestion) and applying versatile but programmatically driven parallel transformation techniques such as map-reduce.
Data integration as a process is highly cumbersome and iterative especially when you want to add new data sources. This step often creates delays in incorporating new data sources for analytics, resulting in the loss of value and relevance of the data before it can be utilized. Current approaches to EDW follow the waterfall approach, wherein until you finish one phase, you can’t move on to the next phase.
While this approach has its merits to ensure the right data sources
•
are picked and the right data integration processes are developed to sustain the usefulness of the EDW. In big data scenario, the situation is completely different; one has to ingest a growing number of new data sources, many of them are very loosely defined and probably have no definitions at all, thereby posing significant challenges to the traditional approach of the EDW development lifecycle. In addition, there is a growing need from the business to analyze and get quick insightful and actionable results; they are not ready to wait!