INTEGRITY, UNETHICAL BEHAVIOR, AND TENDENCY OF FRAUD
Gugus Irianto[email protected] and [email protected] Nurlita Novianti
Kristin Rosalina Yuki Firmanto
Faculty of Economics & Business, Universitas Brawijaya
ABSTRAK
Tujuan dari penelitian ini adalah untuk menganalisis pengaruh integritas, dan sistem kompensasi terhadap perilaku tidak etis, dan pengaruh perilaku tidak etis terhadap kecenderungan kecurangan keuangan. Sampel yang digunakan dalam penelitian ini adalah staf bagian keuangan, dan pengadaan barang dari suatu lembaga pendidikan tinggi. Hasil penelitian menunjukkan bahwa integritas tidak berpengaruh pada perilaku tidak etis, sementara sistem kompensasi memiliki pengaruh terhadap perilaku tidak etis. Hasil lain menunjukkan bahwa lingkungan yang beretika dapat mendorong keputusan yang dilandasi oleh prinsip-prinsip etika daripada keputusan yang didasarkan pada kepentingan pribadi; atau dengan kata lain tendency kecurangan keuangan dapat dikurangi manakala berada dalam lingkungan yang beretika. Hasil penelitian ini selanjutnya dapat diartikan bahwa sistem yang baik, integritas, dan lingkungan yang beretika adalah faktor penentu perilaku etis seseorang.
Kata kunci: integritas, sistem kompensasi, perilaku tidak etis, kecurangan keuangan
ABSTRACT
The purpose of this research is to analyze the influence of integrity, and compensation systems on unethical behavior, and the influence of unethical behavior on tendency of fraud. The sample used in this research is the staff of financial, and procurement divisions of a higher educational institution. The result of the research indicates that integrity has no influence on unethical behavior, whilst compensation systems have an influence on unethical behavior. The other result shows that ethical environment could drive decision based on ethical principles rather than personal interest. In other words, the tendency of fraud may be reduced by the existence of ethical environment. The results of the study may be further interpreted that appropriate system, integrity, and ethical environment are determinant to ethical behavior.
Keywords: integrity, compensation systems, unethical behavior, financial fraud.
INTRODUCTION
Phenomenon and discussion of unethical behavior and fraud both in public and private sectors have been apparent for years. Irianto (2003), for example, explored and described various issues related to such phenomenon from rationalization, role of independent auditor’s in detecting fraud, to the implications to accounting educations. Recently, various cases of fraud which were done by public officials in Indonesia have become the main discussion topic in various media. The facts showed that during 2004
KPK (Corruption Eradication Commission) on 2009 shows that the integrity level of Indonesia in general is 6,50. This number can be considered low since it is only 0,5 above the minimum integrity standard set by KPK. The number is also much low compare to other country like Korea, which integrity number reaches 9 (KPK, 2009:6).
Based on the data from Corruption Perception Index released by Transparency
International, until 2009 Indonesia is
included in the country with the highest corruption level in the world with only 2,81 for the corruption perception index number out of 10 as the highest number (Tran- sparency International, 2005). Although finan- cial statement fraud in public sector, which is reflected the frequency of corruption by public officials has been rooted, a compre- hensive theoretical and empirical study about it in Indonesia is not that brisk as it has been in other countries.
The phenomenon of unethical behavior is already ingrained in our nation. Unethical behavior has actually been happening since being in the educational environment. Unethical behavior that occurs varies, ranging from the behavior or actions that are unethical (ethical misconduct) until the case against the law. This is what triggers the assertion that unethical behavior in the educational environment is a predictor of unethical behavior in the workplace (Sierles et al., 1980 as cited by Irianto, 2003). Furthermore, concerning the unethical behavior of public officials, which later on leads to fraud action, agency theory espoused by Jensen and Meckling (1976) considered being appropriate in describing the phenomenon. Agency theory is connec- ted to agent integrity toward principal, and intended to solve two problems happened within agency relation. One of them is the
1www.ti.or.id “Transparency International Corruption Perceptions Index 2009.” January, 1, 2011.
problem appears when the interest or purpose of the principal and agent are in contrary, and when the principal undergoes a difficulty to trace what exactly the agent do. Those two problems appear in agency cannot be separated from the opportunist behavior of the agent which later on will lead to how high is the integrity of an agent toward his responsible to the principal. Integrity of an agent will be questioned when his motive and interest are different with what the principal wants. As a result, in the practice, the agent is not always act according to the principal’s interest. In the end, different will, motivation and utility between agent and principal can trigger the possibility of the occurrence of unethical behavior and tendency of fraud in financial statement done by the agent toward the resources owned by the principal.
Brass et al. (1998) stated that unethical behavior is caused by two major factors, which are individual factor and organi- zational factor. Individual factor, for example, consists of locus of control and
cognitive moral development which lead to
behavior integrity. While organizational
The agency problem can also be happened if the principal has difficulty tracing back what the agent exactly has done. This situation is called information asymmetry. It is also related to the level of the information credibility given by the agent to the principal. To solve agency problems, the management of the company should implement the right accounting pri-n ciples. People pri-need ipri-nformatiopri-n credibility (IAI, 2001). Nicholson (1997: 487-489) recor- ded that action done by the management is influenced by the situation of information asymmetry.
Unethical behavior and tendency of fraud in financial statement is also caused by attitude and moral responsibility of com- pany. A company has a moral and social responsibility (Keraf, 1998: 119), which in operational level is represented by the management. Unethical behavior and tendency of fraud in a company depends on the morality of the management. From the previous elaboration, we can see that unethical behavior and tendency of fraud is a major problem happening in public sector in Indonesia. Considering the issues, this research is done to analyze the influence of integrity and the compensation system on unethical behavior, and the influence of unethical behavior on tendency of fraud.
Problems of the Study
Based on the elaborated background, problems of this study are presented as follow: (1) Does integrity have influence on unethical behavior?; (2) Does compensation system have influence on unethical beha- vior?; (3) Does unethical behavior have influence on tendency of fraud?
Purposes of the Study
The purposes of this study are as follow: (1) To analyze the influence of integrity on unethical behavior; (2) To analyze the influence of compensation system on unethical behavior; (3) To analyze the influence of unethical behavior on tendency of fraud.
THEORETICAL REVIEW Principal-Agent Theory
The fundamental tenet of principal-agent theory is the existence of contract between principal and agent (Jensen dan Meckling, 1976; Broadbent et al, 1996). The relation between principal and agent is often called agency relation. Principal as the owner of the resources delegates some of his authorities to the agent to manage the resources owned by the principal. The purpose of this authority delegation is to maximize the profit for the principal. Furthermore, Jensen and Meckling (1976) stated that basically in the attempt to maximize profit, every single person act according to their own interest and so does agent. In carrying out its function, agent does not always act to give the best interests for principal.
The appearance of agency model between principal and agent later on causes the information asymmetry problem between those two parties. The information asymmetry occurs because principal under- goes limitation of controlling mechanism to monitor the performance of the agent and it is worsened by the less transparent and accountable behavior of the agent (Jain, 2001). Furthermore, according to Shah (2007) in Shah (2007), the information asymmetry problem appeared enables agent to act opportunistically in order to fulfill their own needs.
mation asymmetry between principal and agent like these later on will lead agent to do corruption. In this case, corruption means the behavior of agent which is taking advantage of the principal’s resources to maximize his own personal prosperity.
In relation to this research, the agency model developed by the principal-agent theory is the appropriate model to describe the phenomenon of unethical behavior and tendency of fraud in financial statement which is caused by opportunistic behavior done by public officials (Jain, 2001), especially education service provider institution like university. Shah (2007) in Shah (2007) stated that in public sector area, what principal means in principal-agent relation model is the community (in this research context, it is identical with university students), while public officials (staff of university) play the role as agent. Public officials as agent are given mandate to manage the resources owned by the principal. The prosperity of principal (specifically university students and general ly the community) will greatly depend on the behavior and decision made by public officials as agent to manage the resources entrusted to him (Laswad et al., 2001).
Integrity
Integrity word is derived from Latin word “integrate” which means complete. Other word for complete is without flaw, perfect and without cover. It means that what is in the heart and what is spoken, what is in the mind and what is done is the same. Based on Wikipedia.com, integrity is a concept of consistency of actions, values, methods, measures, principles, expectations, and outcomes. In ethics, integrity is regarded as the honesty and truthfulness or accuracy of one's actions. Integrity can be regarded as the opposite of hypocrisy, in that it regards internal consistency as a virtue, and suggests that parties holding
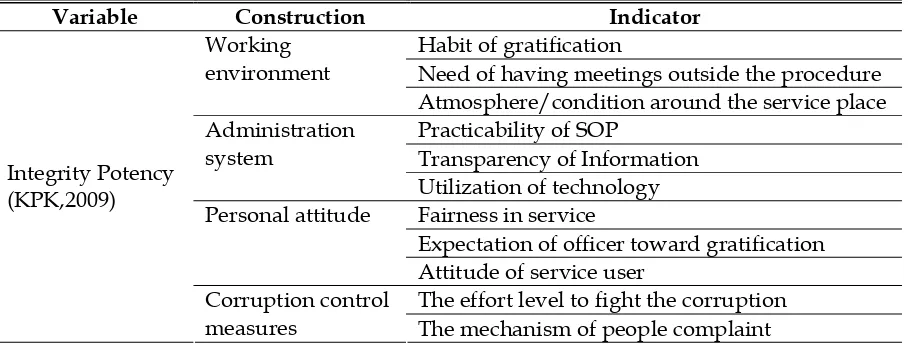
apparently conflicting values should account for the discrepancy or alter their beliefs. Integrity is one of the composer components of public integrity value. There are four constructions used to compose integrity (KPK, 2009):
a. Working Environment
Working environment has potency to support the practice of corruption; working environment in public service sector is not an exception. Based on the facts in the field, the habit of gratification and the involve- ment of broker will significantly decrease the integrity value. However, the atmo- sphere/situation of the service environ- ment, the facilities available, and also the presence of meetings outside the procedures are also the factors that will decrease the integrity value.
b. Administration System
The transparency of information and the easiness of service or practicality of SOP and also the utilizing of information technology are the sub-indicators adminis- tration system which must be achieved in order to fulfill the integrity standard of public sector.
c. Personal Attitude
The negative personal attitude both of service officers and service users is one of the supporting factors of corruption in public service. There are three important things in assessing personal attitude and the relation with integrity value in this survey, that are fairness of treatment from service officer toward service user, whether there is expectation of gratification from officer and the attitude of service user itself at the time of service process.
d. Corruption Control Measures
Compensation system
Compensation system is the deter- minant of the amount of salary standard and other facilities (beside prosperity as basic salary) as the right of employees based on their own interpretation (Thoyibatun, et al., 2009). Employee compensation system plays such a key role because it is at the heart of the employment relationship, being of critical importance to both employees and employers. Appropriate compensation becomes the most important element for the employees’ performance and also the success of the organization (Luthans, 1998 as cited by Wilopo, 2006). Hereby is the construction that builds the variable of compensation system which is developed by Gibson, (1997: 182 – 185) (Table2).
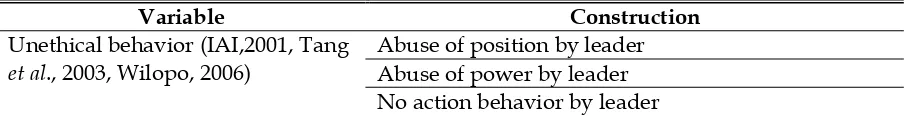
Unethical Behavior
Unethical behaviors occur in all areas of society, business, government, education, etc. Unethical behavior is something difficult to understand, which answers depend on the complex interaction between situation and personal characteristic of the doer.
Although it is difficult in accounting context, and the connection with market is often unclear, however, epitomizing beha- vior needs consideration in order to improve the quality of the decision and reduce the cost related to information and to improve the availability information for the market (Hendriksen (1992) as citied by Wilopo (2006). Refer to the dimension of deviate behavior at work of Wilopo (2006), and Tang et al., (2003) in the research explained about the indicator of deviate or unethical behavior in company. Based on several comprehension of unethical beha vior, thus a construction is made as follow (Table 3).
Tendency of Fraud
Fraud is a white-collar crime rife in recent periods. Fraud has become public attention since the accounting scandal of Enron Corp. Basically, fraud can happen anytime, anywhere and by anyone. This is
in accordance with the statement of Albrecht et al (2006) that "just about everyone can be dishonest".
Every human being must have a purpose and needs of each in her life. To achieve the goals or meet their needs, one can use any means, whether honest or dishonest. Therefore, Singleton et al (2006) defines fraud as a strategy to achieve personal or organizational goals and to meet human needs in ways that are not honest.
Besides that, Albrecht et al (2006) explained that fraud is a generic term, and embraces all of the multifarious means which human ingenuity can devise, which are resorted to by one individual, to get an advantage over another by false represent- tation. No definite and invariable rule can be laid down as general proposition in defining fraud, as it includes surprise, trick, cunning, and unfair ways by which another is cheated. The only boundaries defining it are those which limit human knavery.
However, IAI have different statement to definition fraud. IAI (2001) explained accounting fraud as (1) misstatement occurs from a fraud in financial reporting, that is misstatement or deliberate omission of number or disclosure in financial report to deceive the user of financial report and (2) misstatement occurs from incorrect hand- ling toward assets which is related to the stealing of assets of the entity causing financial report presentation which is not suitable with the accounting principles.
This research used the definition of fraud used by IAI (2001) that is mis- statement occurs from fraud in accounting reporting such as intentionally omit a number or disclosure in accounting repot to deceive the report users. IAI stated, not explicitly, that accounting fraud is a crime.
Table 1
Construction that forms Integrity
Variable Construction Indicator
Habit of gratification
Need of having meetings outside the procedure Working
environment
Atmosphere/condition around the service place Practicability of SOP
Transparency of Information Administration
system
Utilization of technology Fairness in service
Expectation of officer toward gratification Personal attitude
Attitude of service user
The effort level to fight the corruption Integrity Potency
(KPK,2009)
Corruption control
measures The mechanism of people complaint
Table 2
Construction which forms Compensation system
Variable Construction
The type of performance standard used as the determinant foundation of compensation The foundation of job promotion
The socialization of honorarium standard and promotion Compensation system (Gibson,
1997, Wilopo, 2006)
The ethics and physical work standard
assets or profit can be done in several schemes that are (1) fraud in assessment of assets, (2) fictitious income, (3) concealing company liabilities and expenditures, (4) difference in income admission, and (5) fraud in revealing financial report infor- mation.
The opinion of Wells above is not far different from Schilit’s (1993) statement as quoted by Soselisa and Mukhlasin (2008) which identified seven major categories of
shenaginans (other term of Accounting
Fraud) that are (1) admitting early income, (2) admitting fictitious income, (3) adding up income with one-time gains, (4) diver- ting current expenditure to the previous or next period, (5) not revealing all liabilities, (6) diverting current income to the next period, and (7) diverting future expen-
Table 3
Construction which forms Unethical Behavior
Variable Construction
Abuse of position by leader Abuse of power by leader Unethical behavior (IAI,2001, Tang
et al., 2003, Wilopo, 2006)
No action behavior by leader
DEVELOPMENT OF HYPOTHESIS The Influence of Integrity and Compensation system on Unethical Behavior
Integrity and compensation system is part of the organization of mutual support. A compensation system that is designed so well if not supported by the integrity of the individual can also hinder the performance of the organization. Integrity is an impor- tant element in the operation of an organization. Maesschalck (2004) stated that a person’s integrity has influence toward unethical behavior. Beside integrity, compensation system is also an important thing to be observed in order to find out the factors which influence unethical behavior.
Compensation system is still considered a very important part of employee performance and organizational success. This is also supported by Zairi et al (2010) which states that when employees are compensated, assessment, and recognition that they deserve more likely to appreciate the organization, or to behave ethically. But different results were found in the study of Dallas (2002) and Tang et al., (2003) this suggests that the addition of compensation to employees tend to increase the sense of greed so that employees will feel "less" and eventually an unethical act. Besides that, in Wilopo (2006) and Thoyibatun et al (2010) studies found that compensation system doesn’t effect to unethical behavior. Based on the elaboration above, thus hypothesis is formulated as follow:
H1 : Integrity has influenced on unethical behavior
H2 : The suitability of compensation system has negative influenced on unethical behavior.
The Influence of Unethical Behavior on Tendency of fraud
Unethical behavior and fraud in fact just a term that describes non-compliance with regulations. But in social life it is said that unethical behavior is not necessarily true fraud. Unethical behavior that violates the law is called a fraud. However, the fact that occurs in the various frauds it always starts from unethical behavior (Dallas, 2002). This is also supported by CIMA (2002) as citied by Wilopo (2006) which states that company with low ethics standard is likely to have high accounting fraud risk. Further in the study of Carpenters and Reimers (2005) also found that unethical behaviors are caused by ourselves, as well as others around us can drive a person to perform acts of fraud. This research was supported in Wilopo (2006) which stated that unethical behavior causes accounting tendency of fraud. Based on the elaboration above, thus the hypo- thesis can be formulated as follow:
H3 : Unethical behavior has positive influence on tendency of fraud
Type of Research
Table 4
Construction which form Tendency of fraud
Variable Construction
Misstatement Misimplementation
Misappropriation of Assets Tendency of fraud
(IAI,2001, Wells, 2005, Wilopo, 2006, Thoyibatun, 2010)
Misuse of commodities receipt
factors or more in a situation (Sekaran and Boogie, 2010). According to Jogiyanto (2004) explanatory research is a research which tries to explain the phenomenon that exists. This research will explain the influence of integrity (working environment, adminis- tration system, personal attitude, and fraud prevention), compensation system on unethical behavior and tendency of fraud.
RESEARCH METHOD Population and Sample
Populatin is a compilation of elements which we can use to make several conclusions (Cooper and Emory, 1996:218). Population which is taken in this research is the whole staff or employees working in one of the educational institute in Malang which does the function of public service. The population in this research covers the whole staff in administration department both in faculty and study program. The reason of the choosing of the university sector in this research is based on the main reason that in the previous researches, it was only based on private organization (company) samples which were profit oriented, while university is one of the organization types in public sector which purpose is to give service to community especially in education field. Another reason is that by observing only one type of business, it will prevent the industrial effect factor which can influence the research result. The choosing of location in Malang is based on the consideration that it is close to the researchers’ place, and there
is a limitation of time and cost from the researchers’ side.
This research is done based on samples. The basic idea in the sampling is that by selecting part of the elements – population element, conclusion about the whole population can be gained (Cooper and Emory, 1996:214). Indriantoro and Supomo (2002) defined sample as a part of element– population element. In determining the number of the samples, it is based on the opinion of Sekaran and Boogie (2010:60) that is the number of sample for corre- lational research is ≥ 30 or ≤ 500. Meanwhile, the method of sampling is included in the nonprobability sampling type with judgement sampling method. Judgement sampling method is a method involving choices of subject which have the most strategic place or position which provide the information needed (Sekaran and Boogie, 2010:70). Jogiyanto (2004:79) suggested that judgement sampling method is the method which uses certain consi- deration or criteria in choosing the samples.
The criteria used in choosing samples are: (1) Administrative staff or employees in a higher educational institution; (2) Having experience in financial and procurement activity.
Data Gathering Method
The survey method which is done is collecting data by using question- naire as data gathering tool. Surveying is asking questions to people and recording the answers to be analyzed (Cooper and Emory, 1996:287). Questionnaire is a technique in gathering data through written questions with written answers (Indriantoro and Supomo, 2002:154).
From the survey method using questionnaire, a data will be derived. This data is called primary data. Primary data is a research data obtained directly from the original source or not from mediator (Indriantoro and Supomo, 2002:146). The primary data in this research is obtained by sending the arranged questionnaire to be answered by the respondents. The resear- chers spread the questionnaire directly and explain the research in a glance, and also explain the respondents how to fill the questionnaire. The researchers give at least 2 weeks for the respondents to fill in the questionnaire; considering the activities of the respondents, it is not possible for the respondents to fill it in short time. Besides that, the researchers are also contacting by phone to remind the respondents and accelerate the returning of the question- naire.
Before spreading out the questionnaire to the sample, researchers will do pre-test like: (1) Controlling the questionnaire; putting some items of negative questions in order to get unbiased result from the questionnaire; (2) Discussing the meaning of each indicator with both lecturers and staff
After doing the pre-test, the next step of the researchers is running pilot test. Trial of the pilot test is run in order to find out the validity and reliability of the instrument. Validity trial will be run with minimum amount of 30 questionnaires.
Research Variable and Measurement
This research is using two kinds of variables; that are dependent variable and independent variable. Independent variable is the variable which explains or influences
the other variable (Indriantoro and Supomo, 2002:63). In this research the independent variables are:
1. Integrity (X1)
Integrity is one of the elements which build the public integrity value. There are four indicators used to build integrity. Those are Working Environ- ment, Administration System, Personal Attitude, and Corruption Control Measures (KPK, 2009)
2. Compensation system (X2)
research instrument which validity has been developed and tested by the previous researcher.
Measurement scale is an agreement used as a reference to determine the length of interval in the measurement instrument, so that if the measurement instrument is used, it will produce quantitative data. The scale used in this research is Likert Scale. Likert scale is used to measure attitude, opinion, and perception of a person or community about social phenomenon (Sugiono, 2002:86). In this research, Likert scale is used in independent, dependent and intervening variable. The method of the measurement is by confronting a respondent with a question and later the respondent will be asked to answer the question with: “strongly disagree (STS), disagree (TS), neutral (N), agree (S) strongly
agree (SS).” The answer will be given score from 1 until 5 (Ghozali, 2001:41).
Hypothesis Test
The instrument used in hypothesis test which is formulated in this research is Multiple Linear Regression Method (Ghozali, 2001:149) with the help of SPSS 16. The research model is shown in Picture 1.
To analyze those variables, statistic method with level of significance α = 0.05 is used; which means error degree is 5%.
ANALYSIS AND DISCUSSION Data gathering Result
The respondents used in this research are staff or employees working in one of the educational institutes in Malang which does the function of bureaucracy and public service, and have been chosen according to determined criterias.
Picture 1 Research Model
With equation as follow:
UB = α + β1 I + β2 CS + ε TF = α + β3 UB + ε
Notes:
UB : Unethical behavior TF : Tendency of fraud I : Integrity
CS : compensation system
Ε : error
Working Environment
Administration system
Personal Attitude
Corruption Control Measures
Unethical Behavior
Compensation System Integrity Working
Environment Integrity
Tendency of Fraud Administration
system
Unethical Behavior
Tendency of Fraud
Personal
Attitude Compensation
System
As mentioned in the previous chapter, this resarch is using survey method, which is spreading questionair among the whole staff. The process of data gathering takes aprroximately one month by spreading the research questionair directly.
The number of questionair spreaded among the staff is 100 questionairs. However, the number of questionairs returned is 82, while 18 questionairs are not returned. After being checked, 33 questionairs cannot be used because there are some data which are not completely filled or there are bias in the answers. Therefore, the respond rate in this research is 82% and the questionairs that can be processed are 49 and it is used as the samples in this research (Table 5).
To find out the overview of the respondents who become the research data, the tables below will give complete explanation based on certain composition. Table 6 below shows the composition of the respondents based on gender.
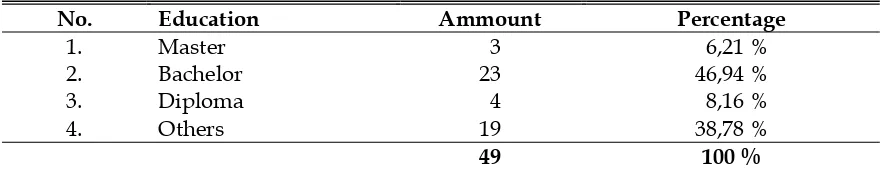
Table 7 shows the composition of the respondents who become the research object based on last education obtained.
The composition of the respondents who become the research object based on the length of working period is shown in table 8.
Validity and Reliability Test Result
The validity and reliability of the data gathering result from the respondents needs to be tested using validity and reliability test of research instrument.
Table 5
Sample and Respond Rate
Total sample
Total unreturned questionair Returned questionair
Invalid questionair Valid questionair
100 18
82
33
49
Respond rate Usable respond rate
82 % 49 % Source: Primary data (processed)
Table 6
The composition of the respondents based on gender
No. Gender Ammount Percentage
1. 2.
Men Women
29 20
59,18 % 40,82 %
49 100 %
Table 7
The composition of the respondents based on education
No. Education Ammount Percentage
1. 2. 3. 4.
Master Bachelor Diploma Others
3 23 4 19
6,21 % 46,94 % 8,16 % 38,78 %
Table 8
The composition of the respondents based on the length of working period
No. Length of working period
Ammount Percentage
1. 2. 3.
< 1 year 1 < x < 3 years > 3 year
2 4 43
4,08 % 8,16 % 87,76 %
49 100 %
Research instrument is stated valid and reliable if the correlation coefficient (r) produces probability value less than 0,05 and Cronbach Alpha more than 0,6.
The table 9 shows the result of the validity and reliability test toward Variable Unethical Behavior (Y1).
The result of the test on the table above shows all question items produce correlation coefficient (r) with probability less than 0,05 so it can be concluded that all question items are valid. The test also results Cronbach Alpha
number for 0,811 (more than 0,6) so that
instrument is stated reliable.
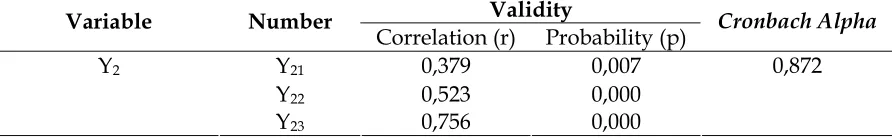
The table 10 shows the result of validity and reliability test toward Variable Tendency of fraud (Y2). The test result on the table 10 shows all question items produce correlation coefficient (r) with probability smaller than 0,05 so it can be concluded that all question items are valid. The test results Cronbach Alpha for 0,872 (bigger tahn 0,6) so that the instrument is stated reliable.
Table 9
The result of the validity and reliability test toward Unethical Behavior (Y1)
Validity Variable Number Correlation
(r) Probability (p)
Cronbach Alpha
Y1 Y11 0,731 0,000
Y12 0,842 0,000
Y13 0,797 0,000
0,811
Y14 0,618 0,000
Y15 0,809 0,000
Source: Primary data (processed)
Table 10
The result of validity and reliability test toward Variable Tendency of fraud (Y2)
Validity Variable Number
Correlation (r) Probability (p) Cronbach Alpha
Y2 Y21 0,379 0,007
Y22 0,523 0,000
Y23 0,756 0,000
0,872
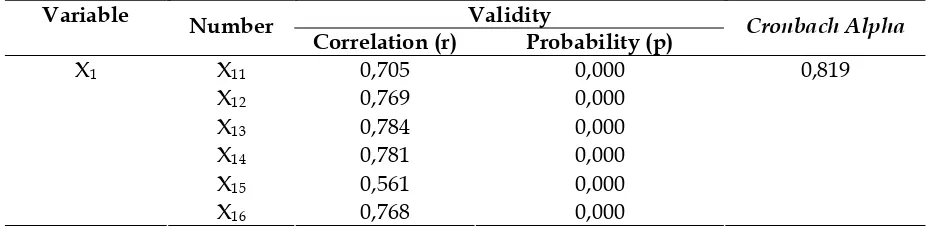
The table 11 below shows the result of the validity and reliability test toward Variable Compensation system (X1). The result of the test above shows that all question items produce correlation coeffi- cient (r) with probability smaller than 0,05 so it can be concluded that all question items are valid. The test results Cronbach Alpha for 0,819 (bigger than 0,6) so that instrument is stated reliable.
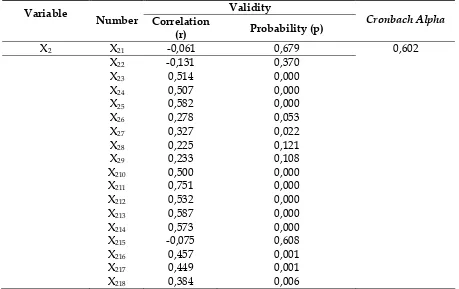
The table 12 shows the result of the validity and reliability test toward Variable Integrity (X2).
The test result on the table above shows that there are several items which have probability above 0,05 or 0,1. Thus, the researchers take out those question items from the questionair. After it has been taken out, then all question items produce correlation coefficient (r) with probability smaller than 0,05 so that it is concluded that all question items are valid. The reduction of the question numbers in this variable also causes Cronbach Alpha to become 0,767. The test results Cronbach Alpha for 0,767 (bigger than 0,6) so that instrument is stated reliable.
Classical Assumption Test
The hypothesis test is done by using Multiple Linear Regression Test. In test using ordinary least squares/OLS method, best linier unbiased estimator/BLUE is needed from the assessor (Gujarati, 1997:44). A series of tests can be done so that the regression equation which is made can
fulfill this BLUE requirements, that are normality test, multicolinearity test, and heteroscedascity test. Considering there are two regression models in this research, so the classical assumption test is differen- tiated into two.
Normality Test Result
Gujarati (1997:67) wrote that the classical normal linear regression assumes the normality of data with several reasons, that are: (1) Obtain unbias prediction model, and also own minimum variants; (2) Obtain consistent model, by increasing the number of the sample to become unlimited, the assessor refers to the real population value.
The purpose of normality test is to examine whether the intervening or residual variable in the regression model has normal distribution because the T-test and F-test assume that the residual number is following the normal distribution (Ghozali, 2001:110). The normality test done toward unstandardized residual number of regression model by using One Sample Kolmogorov-Smirnov Test. Data is categorized to have normal distribution if it produces number of asymptotic significance > α=5%. The result of the test is represented in the table 13.
Tabel 13
The result of One Sample Kolmogorov-Smirnov Test
Regression Model
Kolmogorov-Smirnov Z
Regression Model I 0,276
Regression Model II 0,440
Tabel 11
The result of the validity and reliability test toward variable compensation system (x1)
Validity Variable Number
Correlation (r) Probability (p) Cronbach Alpha
X1 X11 0,705 0,000
X12 0,769 0,000
X13 0,784 0,000
X14 0,781 0,000
X15 0,561 0,000
X16 0,768 0,000
0,819
Tabel 12
The result of the validity and reliability test toward variable integrity (x2)
Validity Variable
Number Correlation
(r) Probability (p)
Cronbach Alpha
X2 X21 -0,061 0,679
X22 -0,131 0,370
X23 0,514 0,000
X24 0,507 0,000
0,602
X25 0,582 0,000
X26 0,278 0,053
X27 0,327 0,022
X28 0,225 0,121
X29 0,233 0,108
X210 0,500 0,000
X211 0,751 0,000
X212 0,532 0,000
X213 0,587 0,000
X214 0,573 0,000
X215 -0,075 0,608
X216 0,457 0,001
X217 0,449 0,001
X218 0,384 0,006
Source: Primary data (processed)
Based on the test result toward residual number, the entire regression model produce Asymptotic Significance number bigger than 0,05. That result shows that the data has normal distribution.
Multicolinearity Test Result
Multicolinearity test is used to examine whether there is a correlation between independent variables. It uses a method to detect the existence of multicolinearity by using VIF (variance inflation factor) number; VIF number smaller than 10 (VIF<10) shows that there is no multi- colinearity with other dependent variables. The multicolinearity test is represented in the table 14 below.
Based on the test result on the table above, VIF number in the entire regression model produce numbers smaller than 10.
This result shows that there is no multicolinearity between independen.
Tabel 14
The result of multicolinearity test
No. Variable VIF
1. Regression Model I
Integrity (X1 ) 1,571
Compensation system (X2)
1,571
2. Regression Model II Unethical Behavior (Y1 )
1,000
Heteroscedasticity Test
thus there is heteroscedasticity. The way to detect whether there is heteoscedasticity or not is by seeing the existence of a certain pattern in the graph scatterplot at around the number of X and Y. t variables.
If there is a certain pattern, so there is heteroscedasticity. Based on the test result toward heteroscedasticity in the entire regression model, it can be seen that there is no certain pattern at the formed graph. Based on the result, it can be concluded that there is no heteroscedasticity in the regression model used.
Hypothesis Test Result
Hypothesis of this research is tested by using Multiple Linear Regression method. Multiple Linear Regression method is used to examine the direct influence of integrity and compensation system on unethical behavior, and unethical behavior on tendency of fraud.
The regression analysis result (F-test) for model I, and II is as follow (Table 15).
Tabel 15
The regression analysis result (F-test)
Model F R R
Square Sig
I 5,546 0,441 0,194 0,007 II 5,829 0,460 0,125 0,003
The regression analysis result (F-test) for model I on the 15 above shows the number of R Square = 0,194. This number shows that variation of unethical behavior (Y1) which can be explained with regression equation is 19,4%, while the rest for 80,6% can be explained by other variables outside the model. From table 4.11, it can be seen that the value of Fhitung of the regression analysis is 5,546 and the value of the alpha significant (probability number) is 0,007<0,05, so integrity variable (X1), and compensation system (X2) simultaneously have significant influence on unethical behavior (Y1). This result shows that the model can be used to predict unethical behavior.
The same thing is also discovered in the model II. The table 4.11 above shows the number of R Square = 0,125. This number shows that the variation of tendency of fraud (Y2) which can be explained by regression equation is 12,5% while the rest 87,5% can be explained by other variable outside the model. From table 4.11 it can be seen that the value of Fhitung the regression analysis is 5,829 and the value of the alpha significant (probability number) is 0,003<0,05, so that unethical behavior variable (Y1) simultaneously has significant influence on tendency of fraud (Y2).
This result shows that the model can be used to predict tendency of fraud. This research result is in line with the research result of Carpenter and Reimers (2005), and Wilopo (2006).
Next, t-test is used to test whether the independent variable individually has significant influence toward dependent variable. The t-test result is as follow:
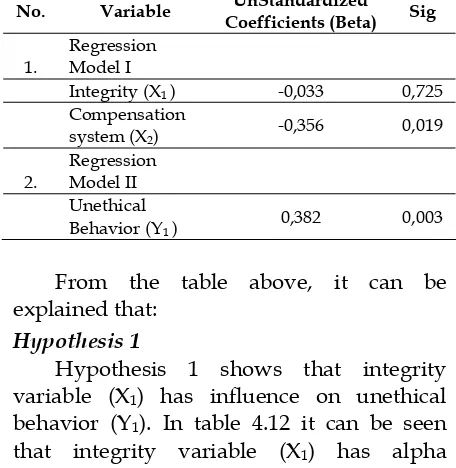
Tabel 4.12
The regression analysis result (T-test)
No. Variable UnStandardized
Coefficients (Beta) Sig
1.
Regression Model I
Integrity (X1 ) -0,033 0,725
Compensation
system (X2) -0,356 0,019
2.
Regression Model II Unethical
Behavior (Y1 ) 0,382 0,003
From the table above, it can be explained that:
Hypothesis 1
Hypothesis 2
Hypothesis 2 shows that compensat-ion system variable (X2) has negative influence on unethical behavior (Y1). In table 4.12, it can be seen that compensation variable (X2) has alpha significant number 0,019>0,05, and beta number -0,356, so that compensation system (X2) has negatif influence on unethical behavior (Y1). Based on the result, therefore Hypothesis 2 is accepted.
Hypothesis 3
Hypothesis 3 shows that unethical behavior variable (Y1) has influence on tendency of fraud (Y2). In table 4.12, it can be seen that unethical behavior (Y1) has alpha significant number 0,003>0,05, and beta number 0,382, so that unethical behavior (X1) has positive influence on tendency of fraud (Y2). Based on the result, thereforeHypothesis 3 is accepted.
Discussion of The Research Result The Influence of Integrity on Unethical Behavior
Integrity refers to the quality of a person’s characteristic which refers to the consistency between acts, values, steps taken, sizes used, principles held, expectation to aim, until the outcome which comes up. Integrity involves honesty and trust as the motivation of every action (Ssonko, 2010). Carter (1996) as referred by Ssonko (2010) stated that integrity needs 3 steps, that are able to see which right and wrong, act according to what it has observed (about the right and wrong), and also stated openly that we have acted according to our understanding of the right and wrong.
When the discussion of integrity is connected with organization environment, what becomes the next problem is the correlation between behavior integrity of each individual in the organization with the implemented system in the organization.
Ssonko (2010) explained that no matter how good a person’s behavior and how great the amount of compensation (salary) given to a person, it does not simply reduce the unethical behavior from each individual in the organization if the implemented system is not supporting. We can take what happen in most of governmental institutes (public sector). In case of the accountability of the state owned property, there are several outgoing items which apparently cannot be formally accounted when in fact the outgoing is used for the institute operational activities. This kind of condition later on will lead the related public officials to look for cracks so that they can manage to make the unaccountable outgoing to be accountable formally, even though in the process they have to run through the ways which are considered violating the honesty principles (unethical). Several steps considered to be violating the ethics principles are falsifying expenditure evidence or adding (mark-up) some amount to other outgoing in which it can be accounted for formally. These kinds of problem will bring public officials to ethics dilemma conflict.
had integrity values. Those Nazi soldiers believed that what they did was something appropriate with their beliefs, had clear purposes, and the outcome would also give advantages for some communities. These kinds of problem which later on will make the connection between integrity and unethical behavior become something proble- matic.
The Influence of Compensation system on Unethical Behavior
The result of this research is in line with the previous research done by Luthans (1998), Van Rijckeghem and Weder (1997). However, what needs to be stressed further is that by increasing the salary of public officials it is not simply able to reduce corruption without any improvement in the implemented system. Without any supportive and transparent standard operating procedure (SOP), the salary remuneration policy of public officials cannot optimally reduce unethical behavior from the public officials itself; it even tends to cause inefficiency and ineffectiveness in the use of the state’s money.
The opinion above is in line with the research result of Bebchuk and Fried (2003) which stated that unethical behavior is not only influenced by the amount of the compensation (salary) received by agent from the principal, but also, which need to be observed, how the scheme and design of the compensation (salary) is made. It is based on the opinion which stated that the awarding of adequate incentive for agent (manager) is an important thing that can stimulate the performance of agent, create effectiveness in costing, and also can lead to the fulfillment of the purpose (profit) of the principal.
The Influence of Unethical Behavior on Tendency of fraud
The result of this research is in line with the research result of Dallas (2002), Carpenters and Reimers (2005), and also Wilopo (2006). Further, this research result is also reinforced by the experimental
research done by Booth and Schultz (2004) who discovered that a string influence of ethical environment can reduce manager’s behavior in making decision based on his own interest (for example, continuing project, which actually is already failed, only for his own interest to get bonus). In other words, from the research result we can see the connection between environments which upholds the ethics principles with the making decision process of the manager. The strong influence of the ethical environment leads the manager to uphold the ethics principles in every process of making decision. The existence of environment which upholds ethics values can avert opportunistically behavior of a manager under the circumstances of agency problems and direct the manager to uphold the interest of company or organization.
CONCLUSIONS AND SUGGESTIONS
The important findings of this study are that integrity has no influence on unethical behavior, whilst compensation system has influenced toward unethical behavior. Those findings, to some extent, are in line with previous study by Ssonko (2010), although Ssonko believed that unethical behavior could not be reduced without implemented and appropriate systems beyond compensation systems. The second finding of this study is also parallel to the previous study by Luthans (1998), and Van Rijckeghem and Weder (1997). That study indicated the importance of compensation system to reduce unethical behavior. Finally, this research confirmed that ethical environment could drive decision based on ethical principles rather than personal interest. In other words, the tendency of fraud may be reduced by the existence of ethical environment. The overall results of the study may be further interpreted that appropriate system, integrity, and ethical environment are determinant toward ethical behavior.
results of this study may difficult to be avoided. In addition, the value of r square is relatively low, which indicates that different independent variable may need to be used in the future research. Such study may follow the study of Ashkanasy et al. (2003). Researcher believes that different approach to this study may produce different results. Experimental method was used by Booth and Schultz (2004) and produced different results. Other research such as by Brass et al. (1998) which used different model also proved differently. A naturalistic research approach could be exercised to observe in depth phenomena of similar research in the near future.
REFERENCES
ACFE. 2010. Report to The Nations on Occupational Fraud and Abuse: 2010
Global Fraud Study. www.acfe.com.
Accessed on 16 Agustus 2010.
Albrecht, W. S., C. C. Albrecht., and C. D. Albrecht. 2006. Fraud Examination. 2nd ed. Thomson South-Western.
Ashkanasy, N. M., S. Falkus, and V. J. Callan. 2000. Predictors of Ethical Code Use and Ethical Tolerance in the Public Sector. Journal of Business Ethics 25(3): 237-253.
Bebchuk, L. A, and J. M. Fried. 2003. Executive Compensation as an Agency Problem. Journal of Economic Perspectives
17(3): 71–92.
Brickley, J. A., and C. M. James. 1987. The Takeover Market, Corporate Board Composition and Ownership Structure: The Case Banking. The Journal of Law and Economics 30(2): 161-180.
Booth, P. and A. K. Schulz. 2004. The Impact of an Ethical Environment on Managers’ Project Evaluation Judgments Under Agency Problem Conditions. Accounting, Organizations and Society 29(2): 473–488.
Brass, D. J, K. D. Buterfield, and B. C. Skaggs. 1998. Relationship and Unethical Behavior: A Social Network Perspective. Academic and Management Review 23(1): 14-31.
Broadbent, J., M. Dietrich, and R. Laughlin. 1996. The Development of Principal-Agent, Contracting and Accountability Relationships in The Public Sector: Conceptual and Cultural Problems.
Critical Perspectives on Accounting 7(1): 259-284.
Buckley, M. R., D. S. Wiese, and M. G. Harvey. 1998. An Investigation into Dimensions of Unethical Behavior.
Journal of Education for Bussiness 73(5): 284-290.
Carpenter, T. and J. Reimers. 2005. Unethical and Fraudulent Financial Reporting: Applying the Theory of Planned Behavior. Journal of Business Ethics 60: 115–129.
Church, B. K., J. McMillan, and A. Schneider. 2001. Factors Affecting Internal Auditors’ Consideration of Fraudulent Financial Reporting during Analytical Procedures. Auditing: A Journal of Practice & Theory, 20(1): 65-80. Chartered Institute of Management
Accountants. 2002. Risk Management: A
Guide to Good Practice. CIMA
Publishing. London.
Committee of Sponsoring Organizations of The Treadway Commission (COSO). 2002. Fraudulent Financial Reporting 1987-1999: An Analysis of U.S. Public
Companies. COSO. New York.
Cooper, D. and C. William Emory. 1996.
Metode Penelitian Bisnis. Erlangga.
Jakarta
Ghozali, I. 2001. Aplikasi Analisis Multivariate
dengan Program SPSS. Badan Penerbit
UNDIP. Semarang.
Gibson, I. and Donnelly. 1997. Organisasi: Perilaku, Struktur, Proses Jilid 1 dan 2. Binarupa Aksara. Jakarta.
Gujarati, D. 1997. Basic Econometrics. McGraw-Hill, Inc. Sumarno Zain (penterjemah) Ekonometrika Dasar.
Erlangga. Jakarta.
Ikatan Akuntan Indonesia, 2001. Standar
Pemeriksaan Akuntan Publik. SA Seksi
316. Pertimbangan Atas Kecurangan dalam Audit Laporan Keuangan.
Indriantoro, N. and B. Supomo. 2002.
Metodologi Penelitian Bisnis untuk Akuntansi dan Manajemen.
BPFE.Yogyakarta.
Irianto, G. 2003. Skandal Korporasi dan Akuntan. Lintasan Ekonomi XX(2): 104-110.
Jain, A. K. 2001. Corruption: A Review.
Journal of Economic Surveys 15(1): 1320-1346
Jensen and W. H. Meckling. 1976. Theory of The Firm: Managerial Behavior, Agency Costs and Ownership Structure. Journal of Financial Economics 3: 305-360.
Jogiyanto, H. M. 2004. Metodologi Penelitian Bisnis. BPFE. Yogyakarta.
Kartikasari, R. and G. Irianto. 2009. Penerapan Model Beneish dan Altman dalam Pendeteksian Kecurangan Laporan Keuangan. Jurnal Akuntansi Multi Paradigma 1(1): 155-172.
Keraf, A. 1998. Etika Bisnis: Tuntutan dan Relevansinya. Kanisius. Yogyakarta.
Komisi Pemberantasan Korupsi. 2009. Integritas Sektor Publik Indonesia tahun 2009. www.kpk.go.id. Accessed on 6 September 2011.
Laswad, F., R. Fisher, and P. Oyelere. 2001. Public Sector Financial Disclosure on The Internet: A Study of New Zealand Local Authorities. Discussion Paper No. 92. Commerce Division, Lincoln University.
Luthans, F. 1998. Organizational Behavior. 8th ed. Irwin McGraw-Hill. Boston.
Maesschalck, J. 2004. The Impact of New Public Management Reforms on Public Servants’ Ethics: Towards A Theory.
Journal of Public Administra-tion 82(2): 465-489.
Nicholson, W. 1997. Intermediate Microeco-nomics and Its Application. 7th ed. The Dryden Press. Orlando.
Parry, K. W. and S. B. Proctor-Thomson. 2002. Perceived Integrity of Trans-formational Leaders in Organisational Settings. Journal of Business Ethics 35(2): 75-96.
Robinson, S. L. and R. J. Bennet. 1995. A Typology of Deviant Workplace Behaviors: A Multidimensional Scaling Study. Academy of Management Journal
38(2): 555-572.
Sekaran, U. and Bougie, R. 2010. Research Method for Business. 5th ed. John Wiley and Sons, Inc. USA.
Shah, A. 2007. Tailoring The Fight Against Corruption to Country Circum-stances. in A. Shah (Ed.) Performance Accountability and Combating Corruption.
The World Bank. Washington DC. Singarimbun, M. and Effendi. 1995. Metode
Penelitian Survei. Penerbit LP3ES.
Jakarta.
Soselisa, R. and Mukhlasin. 2008. Pengaruh Faktor Kultur Organisasi, Manajemen, Strategik, Keuangan, dan Auditor terhadap Kecenderungan Kecurangan Akuntansi: Studi pada Perusahaan Publik di Indonesia. Paper presented at the Simposium Nasional Akuntansi XI. Pontianak.
Sugiono. 2002. Metode Penelitian Bisnis.
Cetakan Keempat. CV Alfabeta. Bandung.
Tang, T. L. P. and R. K. Chiu. 2003. Income, Money Ethic, Pay Satisfaction, Commitment, and Unethical Behavior: Is The Love of Money The Root of Evil for Hong Kong Employees?. Journal of Business Ethics 46: 13-20.
Thoyibatun, S., M. Sudarma, and E. G. Sukoharsono. 2010. Analysing The Influence of Internal Control Compliance and Compensation System Against Unethical Behavior and Accounting Fraud Tendency (Studies at State University in
East Java). Paper presented at the
Simposium Nasional Akuntansi XII. Palembang.
Troy C., M. A. Domino, and S. P. Landry. 2009. Exploring Accounting Fraud in The Subsidiary Environment. Journal of Business & Economics Research 7(1): 13-21.
Van Rijckeghem, C., and B. Weder. 1997. Corruption and The Rate of Temptation: Do Low Wages in The Civil Service Cause Corruption? IMF Working Paper. WP/97/73.
Wilopo. 2006. Analisis Faktor-Faktor yang Berpengaruh terhadap Kecenderungan Kecurangan Akuntansi: Studi pada Perusahaan Publik dan Badan Usaha Milik Negara di Indonesia. Paper presented at the Simposium Nasional Akuntansi IX. Padang.
Wilopo. 2010. Etika Profesi: Telaah pada Profesi Akuntan, Kasus-Kasus
Kecurangan. Working papers,
presented at the Kuliah Tamu Program Doktor Ilmu Manajemen Pascasarjana Fakultas Ekonomi Universitas Brawijaya. Malang, 21 April.
Zairi, M., Y. Jarar , and Aspinwall. 2010. A Reward, Recognition, and Appraisal System for Future Competitiveness: A UK Survey of Best Practices. Working
paper, www.ecbpm.com.