Abstract
Hazard deaggregation is required in seismic hazard analysis in order to determine the controlling magnitudes and distances for particular return periods of earthquakes. These magnitude and distance are required for physical interpretation of the results from probabilistic seismic hazard analysis and to take certain engineering decisions. This paper presents a development of hazard deaggregation for Indonesia. The deaggregation process is started by calculating the ground shaking with hazard level 10% probability of exceedance in 50 years. In this study, the deaggregation hazard map was analyzed using total probability method and by applying three dimen-sional (3-D) source models and recent seismotectonic parameters. Three source models were used in this analy-sis, namely: subduction zones, transform fault zones and background source zone. Indonesian earthquake source models were constructed and published attenuation relations to calculate the peak ground acceleration for rock site conditions were used in the analysis. The recurrence rates and sizes of historical earthquakes on known and inferred faults and across zones were determined from modified earthquake catalog. The results of this study are deaggregation hazard maps of Indonesia for 10% probability of exceedance in 50 years.
Keywords: Hazard analysis, deaggregation analysis, distance, magnitude.
Abstract
Deagragasi hazard diperlukan dalam analisis seismic hazard untuk menentukan jarak dan magnitude kendali untuk perioda ulang gempa tertentu. Jarak dan magnitude ini digunakan untuk interpretasi fisik terhadap hasil dari analisis seismic hazard probabilistik dan untuk mengambil keputusan tentang hal yang bersifat keteknikan. Paper ini memberikan hal berupa pengembangan deagregasi hazard untuk Indonesia. Proses deagregasi dimulai dengan menghitung goncangan tanah dengan level hazard 10% probabilitas terlampaui dalam jangka waktu 50 tahun. Dalam studi ini, deagregasi hazard diananlisis menggunakan metoda probabilitas total dengan mengaplikasikan model sumber gempa tiga dimensi dan parameter seimotektonik terbaru. Tiga model sumber gempa digunakan dalam analisis ini yaitu sumber gempa zona subduksi, transform fault dan sumber background. Model sumber gempa Indonesia telah dikembangkan dan fungsi atenuasi yang terpublikasi digunakan untuk menghitung percepatan tanah puncak untuk kondisi site batuan. Ukuran dan laju keberulangan gempa-gempa histori pada fault yang sudah dikenal maupun fault yang keberadaanya masih dalam dugaan dan juga pada zona yang lain ditentukan dari katalog gempa yang telah dimodifikasi. Hasil dari studi ini adalah berupa peta deagregasi hazard untuk Indonesia dengan 10% probabilitas terlampaui dalam jangka waktu 50 tahun
Kata-kata Kunci: Analisis hazard, analisis deaggregasi, jarak, magnitude.
Hazard Deaggregation for Indonesia
L.L. Makrup
Departement of Civil Engineering, Indonesian Islamic University, Jl. Kaliurang KM 14,5 Yogyakarta, Indonesia.
E-mail: [email protected]
Masyhur Irsyam
Departement of Civil Engineering, Institute of Technology Bandung, Jl. Ganesa 10 Bandung, Indonesia
E-mail: [email protected]
I Wayan Sengara
Center for Disaster Mitigation, Institute of Technology Bandung, Jl. Ganesa 10 Bandung, Indonesia E-mail: [email protected]
Hendriyawan
Departement of Ocean Engineering, Institute of Technology Bandung, Jl. Ganesa 10 Bandung, Indonesia E-mail: [email protected]
1. Introduction
Indonesia has relatively high potential to stroke by great earthquakes, because in the western and southern of this country lay the subduction earthquake zones that known as the zones that can produce the greatest earthquake (Kramer, 1996; Petersen et al., 2004). The earthquake can give the high seismic hazard in vicinity of the zones. The zones are Sumatran and Java subduction zones. These subduction zones continue chain to Banda Sea and Seram Island in Maluku Province. There are also other subduction zones in eastern Indonesia, as North Sulawesi, West Molucca, East Molucca, Philippine, and New Guinea. The Sumatra subduction zone defines as one of the most active plate tectonic margins in the world, accommodating about 49 mm/year (Zachariasen et al., 1999) of oblique north-westward convergence between the Eurasian and Indian/Australian plates
(McCaffrey, et al., 1991; Prawirodirdjo, et al., 2000)
(Figure 1). Large subduction zone (plate interface) earthquakes occurred in 1833 (M 9.0 ± 0.2), 1861 (M 8.5), 2000 (Mw 7.9), and 2004 (Mw 9.2) (Petersen et al., 2004). On the other hand Java subduction zone plat boundary was less active than Sumatra subduction zone. The plat boundary moved more aseismic, so that great earthquakes in this zone are rarer.
The Java subduction zone plat boundary was also called as Java-Sumba zone. Java-Sumba zone encom-passes the shallow Sunda trench subduction system south of Sumba, Sumbawa, Lombok, Bali, and Java. Along this section of the Sunda trench system, the Australian plate converges north-northeastward and subducts beneath the Sunda plate with a relative plate velocity of about 6 cm/year. Within the Java-Sumba zone, earthquakes producing damage from shaking or tsunamis have originated as the result of thrust-faulting on the plate interface and as the result of faulting within the Australia or Sunda plates. The largest interface thrust earthquakes in the Java-Timor zone since 1900 were the shocks of 1994 June 2 (Mw 7.8) and 2006 July 17 (Mw 7.7), both of which produced destructive tsunamis but neither of which caused damage from shaking. The 1994 and 2006 earthquakes were of an unusual type of earthquake, commonly called "tsunami earthquake". The tsunami earthquakes produce relatively low-levels of the high-frequency energy that would cause shaking damage to buildings, but, considering their magnitudes, "tsunami earthquakes" are unusually efficient at generating tsu-nami waves (Dewey J.W., 2006).
Although the seismological evidence is clear that the Java-Sumba zone can produce interplate thrust-fault earthquakes with magnitudes approaching Mw 8.0, there is not strong evidence that the zone can produce interplate thrust-fault earthquakes with magnitudes much larger than Mw 8.0. Since the mid-nineteenth
century, there have been no cataloged earthquakes of Mw 8.0 or larger in the Java-Sumba zone that appear likely to have been due thrust-faulting on the interface (Newcomb and McCann, 1987). The other subduction zones in Eastern Indonesia also the same as Java subduction zone, less active than Sumatra subduction zone.
The next zones in Indonesia are transform-fault zones (shallow crustal zones). The island of Sumatra have the fault was called the great Sumatran fault. The fault was identified and mapped (Sieh and Natawidjaja, 2000). The Sumatran fault accommodates a large component of relative plate motion that cannot be accommodated by slip on the thrust-fault interface between the Australian and Sunda plates (McCaffrey, 1991). The largest historical earthquakes attributed to the Sumatran fault occurred in 1892 (M about 7.7) and 1943 (M of about 7.6) (Prawirodirdjo, et al., 2000; Sieh and Natawidjaja, 2000).
The island of Java and other islands were indicated have transform fault. The faults are Cimandiri, Bumiayu, Semarang, Yogyakarta, in Java, Palukoro, Poso of Sulawsi, Sorong, Yapen, Membramo of Papua and others. The faults were not studied and known best yet. As an example, destructive earthquake M 6.3 in Yogyakarta, (2006) was intraplate earthquake in Sunda plat was occurred at a fault was suspected as a Yogyakarta fault.
Indonesia with dense population lay on risk area of earthquake hazard need to have seismic hazard map in many types. One of the hazard maps is deaggregation hazard map. Hazard deaggregation is required in seis-mic hazard analysis in order to determine the control-ling magnitudes and distances for particular return periods of earthquakes. These magnitude and distance are required for physical interpretation of the results from probabilistic seismic hazard analysis and to take certain engineering decisions. The values of magni-tude and distance can be used as a basis to account for (predicting) acceleration time-history of that magni-tude and distance. The acceleration time-history can be used as a basis to dynamic structure analysis of the structures that will be built in Indonesia or to assess back the structures safety of existing buildings hazard from the future earthquakes.
2. Source Model
2.1 Earthquake catalogue
frequency of future larger shocks that control the hazard. In most parts of the world, however, the seis-mic record is too short to include a complete sample of these larger, rarer shocks (Petersen et al., 2004). For this study, we compile a new catalog of instrumen-tally recorded earthquakes by combining four preexist-ing catalogs: (1) BMG (the Bureau of Meteorology and Geophysics) catalog, (2) the EHB (Engdahl, van der Hilst, and Buland) catalog, (3) the ISC (Bulletins of the International Seismological Centre) catalog, and (4) the PDE (Preliminary Determination of Epicenters catalogs of the US Geological Survey) catalog. None of these catalogs alone is considered complete enough to use as a basis for the hazard analysis. The combined four cata-logs cover an area from 90E to 142E longitude and 12S to 10N latitude.
A basic assumption of seismic hazard methodology is that earthquake sources are independent. Thus, catalogs that are used to estimate future seismic activity must be free of dependent events such as foreshocks and after-shocks (Petersen, et al., 2004). Gardner and Knopoff (1974) procedure was used here to eliminate foreshocks and aftershocks from the catalog. Based on visual inspection of a Southern California earthquake catalog, Gardner and Knopoff identified durations, T, and
dimensions, L, of aftershock sequences as functions of
main shock magnitude, M, and fit least-upper-bound envelopes to the data of the form: log T or log L= aM+b, where a and b are constants defining the num-ber of earthquakes and the slope of the function respec-tively. Following each earthquake in the chronologi-cally ordered catalog, was scanned for events within a [T(M),L(M)] window. If an event with magnitude less than or equal to M is found, it is marked for deletion as an aftershock. If an event with magnitude greater than M is found, the original earthquake is marked for dele-tion as a foreshock (Petersen, et al., 2004). Computer program (SHAP) of Hendriyawan, et al., (2005) was used here also to marked duplicates, foreshocks and aftershocks earthquakes then deletion them and com-pleteness the data.
2.2 Source zones
The source models were developed using earthquake catalogs, tectonic boundaries, and fault information. Source zones are defined on the basis of the distribu-tion and focal mechanisms of the cataloged earth-quakes, and on the locations of the earthquakes with respect to the boundaries of major tectonic plates. The source zones used in this study are: (1) the shallow earthquakes near the subduction zone (megathrust
zone, depth ≤ 50 km), (2) shallow seismicity in
trans-form fault (shallow crustal area), (3) deep earthquakes associated with subduction zone (benioff zone, depth > 50 km), and (4) shallow seismicity associated with
back arc area (Figure 1). We estimated the magnitude
of the largest earthquake in each source zone based on historical or geological evidence. The maximum magni-tude is generally set at greater M 7.0 because we have observed earthquakes of that size that have not occurred on known faults. Typically the maximum magnitude is also higher than the historical magnitude because we are calculating the long-term hazard using a catalog that spans a relatively short time period. It would be surpris-ing if future earthquakes did not have magnitudes greater than those observed in the zones during the past 36 years (Petersen, et al., 2004).
Shallow seismicity along subduction zones: The sub-duction zones are enough active features in Indonesia. The Sumatra subduction zone, as an example, has rup-tured more than 237 independent events with magni-tude greater than or equal to M 5 until year of 2004 (Petersen, et al., 2004). The largest of these events was M 9.2, which occurred on December 25, 2004 near Simeuleu Island, Aceh, Sumatra (USGS summary map, February 2005).
Shallow seismicity in fault transform: This zone encom-passes all of faults in Indonesia. As an example the great Sumatran fault, more than forty-two events with magnitude greater than or equal to M 5 have occurred during more than the last 36 years. This zone has not been as productive as the Sumatra subduction zone (Petersen, et al., 2004).
Deep seismicity along subduction zones (depth > 50 km): The deep earthquakes are thought to be related to the subduction process and in particular the bending stresses within the subducting slab. This zone has been relatively productive, producing 114 M 5 and greater earthquakes during the more than last 36 years (Petersen, et al., 2004).
Shallow seismicity associated with back arc area: The zones encompass some of back arc area as Flores and Wetar back arc.
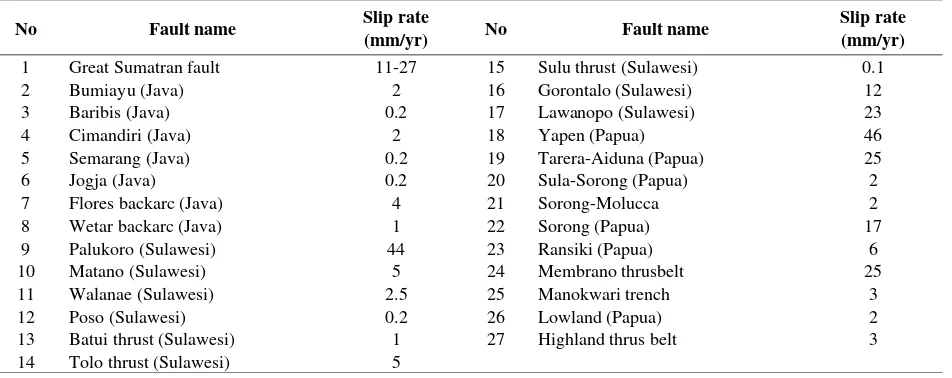
The following table is slip rates of faults used in this
study (Table 1).
3. Fault Source
3.1 Transform fault zones
F
ig
u
re 1.
Earth
q
u
ake so
u
rce zo
n
es an
d
seismic p
a
ra
m
e
ter
s
(d
ro
w
n
b
ased
o
n
Irsyam
et al
., 2009
No Fault name Slip rate
(mm/yr) No Fault name
Slip rate (mm/yr)
1 Great Sumatran fault 11-27 15 Sulu thrust (Sulawesi) 0.1
2 Bumiayu (Java) 2 16 Gorontalo (Sulawesi) 12
3 Baribis (Java) 0.2 17 Lawanopo (Sulawesi) 23
4 Cimandiri (Java) 2 18 Yapen (Papua) 46
5 Semarang (Java) 0.2 19 Tarera-Aiduna (Papua) 25
6 Jogja (Java) 0.2 20 Sula-Sorong (Papua) 2
7 Flores backarc (Java) 4 21 Sorong-Molucca 2
8 Wetar backarc (Java) 1 22 Sorong (Papua) 17
9 Palukoro (Sulawesi) 44 23 Ransiki (Papua) 6
10 Matano (Sulawesi) 5 24 Membrano thrusbelt 25
11 Walanae (Sulawesi) 2.5 25 Manokwari trench 3
12 Poso (Sulawesi) 0.2 26 Lowland (Papua) 2
13 Batui thrust (Sulawesi) 1 27 Highland thrus belt 3
14 Tolo thrust (Sulawesi) 5
Table 1. Faults slip rate (Irsyam, et al., 2009)
uncertainty (±M0.25) was applied to the characteristic earthquake magnitude and maximum magnitude of Gutenberg-Richter distribution.
3.2 Subduction zone
In over the world, the subduction zone has been the focus of several large and great earthquakes. As an example the great Sumatra earthquake M9.2 December 2004 was occurred on Sunda subduction plate boundary (i.e. Sumatra subduction zone). To account for hazard of the great and smaller earth-quakes along the zones we use seismicity with magni-tude range between 5 and 9.20 for all subduction zones. We modeled the hazard by Gutenberg-Richter magni-tude frequency relation (Gutenberg-Richter, 1944).
4. Atenuation Relations
The earthquakes considered in this analysis are generated in different tectonic environments for rock site conditions. However, earthquake ground motions have been shown to vary dramatically between these different environments. Therefore, we have applied several different attenuation relations to account for these different tectonic environments. Ground-motion prediction equations, or attenuation relations, relate ground motions to a given magnitude, distance from the source to the site, fault type, soil condition, and tectonic environment. The prediction equations have been developed for earthquakes associated with four types of tectonic environments: (1) crustal interplate, (2) crustal intraplate, (3) subduction interface, and (4) deep within the subducting slab (Petersen, et al., 2004).
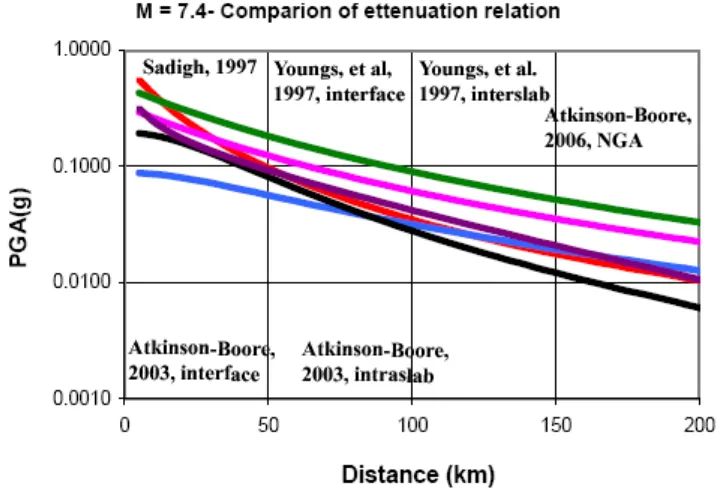
Figure 2 shows estimates of the median value of the peak horizontal ground acceleration for earthquakes generated in different tectonic environments. Interplate crustal earthquakes are generated near plate margins where the crust is relatively hot and plate interactions result in frequent earthquakes. Intraplate crustal
earth-quakes occur well away from the plate margins where
the crust is cooler and thicker. Figure 2 shows that
ground motions from crustal interplate events tend to attenuate faster (Sadigh et al., 1997) than ground motions from crustal intraplate events as seismic waves travel more efficiently in cooler crust. Earth-quakes in the interior of plates also tend to have higher stress drops than earthquakes near the plate margin, resulting in higher ground motions. Accordingly, for the same magnitude and distance, ground motions observed in intraplate environments are generally higher than ground motions in interplate environments. Subduction-related earthquakes tend to produce lower ground motions than crustal earthquake ground motions near the source, but attenuate more slowly as the ground motions propagate away from the source (Youngs, et al., 1997). Deep earthquakes tend to have higher ground motions compared to the interface earth-quakes near the source (Petersen, et al., 2004).
4.1 Crustal fault (interplate/intraplate)
The 1996 US National Seismic Hazard Maps, three attenuation relations were used to calculate the ground motions from shallow crustal interplate earthquakes
(Petersen, et al., 2004). Attenuation relations were
Boore et al. (1997), Campbell (1997), and Sadigh, et
al., (1997).
For seismic hazard map of Sumatra and Malaysian Peninsula, Petersen et al. (2004) selected Sadigh et el. (1997) for calculating the ground motions from shallow crustal interplate earthquakes.
The 2008 Seismic hazard map of Southeast Asia,
Petersen et al. (2008) selected attenuation relations
Figure 2. Comparison of attenuation relations (drown based on attenuation equations of Sadigh et al., 1997; Youngs et al., 1997, Atkinson and Boore, 2003 and Boore and Atkinson NGA, 2007)
and Silva el al. (2005, wt. 0.1) to calculated ground motion from intraplate earthquakes (wt mean weight-ing). Base on study result by Petersen et al., and other, above, in this study we used Sadigh et al., (1997, wt 0.5) Boor and Atkinson (2007, wt 0.5) to calculated the ground motion for the crustal fault to computed seismic hazard and to developed deaggregation map for Indonesia.
4.2 Subduction zone earthquakes (interface/ intraslab)
Several ground-motion prediction equations have been developed for subduction zone earthquakes. Attenua-tion equaAttenua-tions of Youngs et al. (1997) were used in the US National Seismic Hazard Maps (Petersen, et al., 2004). This attenuation relation selected by Petersen et al., (2004) to developed Sumatra and Malaysian Peninsula hazard map. Petersen et al., (2008) used
Young et al. (1997, wt 0.25), Atkinson and Boore
(2003, wt 0.25) and Zhao et al. (1997, wt 0.5) to developed Southeast Asia Hazard map. Base on above study we selected Young et al. (1997, wt 0.5), Atkinson and Boor (2003, wt 0.5) to calculated seis-mic hazard and developed deaggregation hazard map for Indonesia.
5. Hazard Analysis
Probabilistic seismic hazard analysis is a tool which commonly has been used to predict seismic hazard. The analysis was started with calculated probability of a particular value x will be exceeded a ground motion
parameter X. Total probability theorem is the best man-ner to calculate the probability, and is given as:
λX(x) is called as annual rate of exceedance. Frequency
{λX(x)} of x will be exceeded by X, can be calculated
as following below:
where Ni is rate of earthquake occurrence.
Relation of λX(x) versus seismic parameters is called
seismic hazard curve. The hazard curve can be used easily with Poisson process to account for a seismic parameter with particular probability. For this study, seismic hazard of Indonesia was calculated with 10% probability of exceedance for horizontal peak ground acceleration. Calculation was executed by employed seismic hazard computer program that was developed in Institute of Technology Bandung, Indonesia.
6. Deaggregation Analysis
Probabilistic seismic hazard analysis calculates the earthquake threat based on aggregate result from all possible seismic occurrences and ground motion. The nature of analysis is such that most likely magni-tude and source-to-site distance that will create the
∫
∫
∫
>
=
m l r
ML R L
M
X
x
f
m
f
l
P
X
x
m
r
f
r
m
l
drdldm
P
(
)
(
)
R(
)
(
)
|
,
)
| R(
,
,
)
(1)
∑
∑
=
=
i X i i
i X
X
(
x
)
λ
(
x
)
N
P
(
x
)
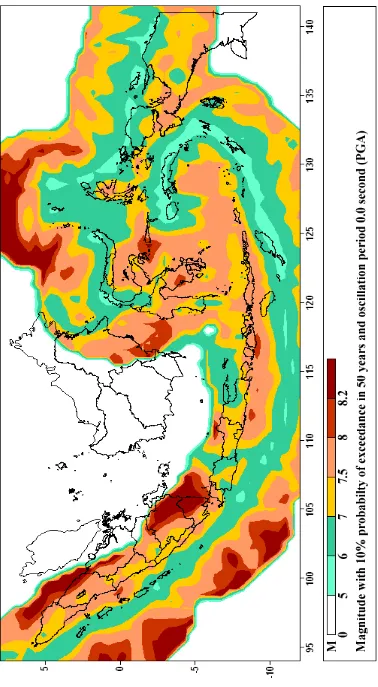
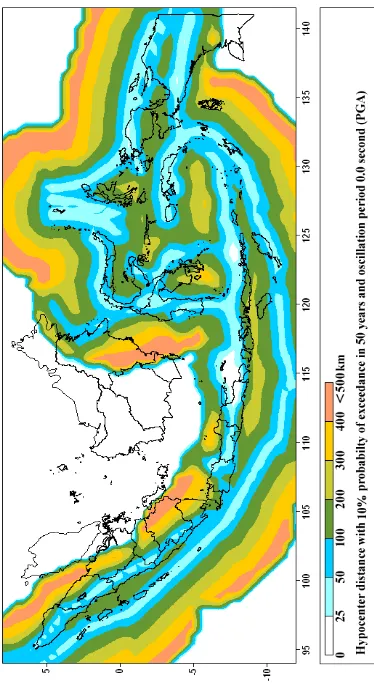
largest risk is not clear. As a result the PSHA lack the idea of a single, dominant M-R (magnitude-distance), design earthquake (Nicolaou, A.S., 1998). To make up which earthquakes are contributing most (dominant) to the hazard in Indonesia, the hazard was deaggregated to account for the sources that contribute at hazard levels of 10% probability of exceedance in 50 years. Deaggregation is statistical decomposition of a hazard to show the relative contribution by magnitude, distance, and ground motion deviations (McGuire, 2004). Result of this deaggregation was performed on
deaggregation map of Indonesia in Figure 3 to 4.
7. Conclusion
1. The hazard across Indonesian islands is relatively high, mainly in the bigger islands as Sumatra, Java, Sulawesi and Papua.
2. It is caused the islands proximity to earthquake-generating structures: transform faults and or subduction plate boundary.
3. In this analysis we have considered contour maps of hipocenter distance and magnitude (deaggregation map) with PGA period. These may be important to account for artificial time history at a site in the future.
4. The maps have been developed employing up-to date PSHA methology and most recent seismotec-tonic input as have been used by experts to devel-oped seismic hazard zonation maps before.
5. The maps could be considered as a pilot because we have never found the such maps for Indonesian islands yet, especially in Indonesia.
References
Atkinson, G.M. and Boore, D.M., 2003, Empirical Ground-Motion Relations for Subduction-Zone Earthquakes And Their Application to Cascadia and Other Regions, Bulletin of the Seismological Society of America, v. 93, p. 1703-1729.
Atkinson, G.M. and Boore, D.M., 2006, Ground Motion Prediction Equations for Earthquakes in Eastern North America, Bulletin of the Seismological Society of America, v. 96, p. 2181 -2205.
Boore D.M. & Atkinson G.M. NGA Next Generation Attenuation, 2007, Ground Motion Relations for Geometric Mean Horizontal Component of Peak and Spectral Ground Motion Parameters, PEER Report, Pacific Earthquake Engineering Research Center, California, USA: College of Engineering University of California, Berkeley, May.
Boore, D.M., Joiner, dan Fumal., 1997, Equations for Estimating Horizontal Response Spectra and Peak Acceleration from Western North American Earthquakes: A Summary of Recent Work, Seismological Research Letters, Volume 68 Januari/Pebruary, Seismological Society of America
Campbell, K.W., 1997, Empirical Near-Source Attenuation Relationships for Horizontal and Vertical Components of Peak Ground Acceleration, Peak Ground Velocity, and Pseudo-Absolute Acceleration Response
Spectra, Seismological Research Letters,
Volume 68 Januari/Pebruary, Seismological Society of America
Campbell, K.W., 2002, Prediction of Strong Ground Motion Using the Hybrid Empirical Method and its Use in The Development of Ground-Motion (Attenuation) Relations in Eastern North America, Bulletin of the Seismological Society of America, v. 93, p. 1012-1033.
Dewey J.W., 2006, Seismic Source Model for Thailand, Malaysia, Singapore and Western Indonesia, Unpublished.
Frankel, A., Mueller, C., Barnhard, T., Perkins, D., Leyendecker, E.V., Dickman, N., Hanson, S., Hopper, M., 1996, National Seismic Hazard Map: Documentation June. Open-File Rep-U.S. Geol. Surv. 96-532
Gardner, J.K., Knopoff, L., 1974, Is the Sequence of Earthquakes in Southern California, with After-shocks Removed, Poissonian?Bull. Seismol. Soc. Am. 64, 1363–1367.
Gutenberg, B. & Richter, C.F., 1944, Frequency of Earthquake in California, Bulletin of the Seismological Society of America, Vol.34, No. 4, pp. pp. 1985-1988.
Hendriyawan, Adnan A., Marto, A., Irsyam, M., 2005, The Development of Software for Seismic Hazard Study, Seminar Penyelidikan Kejuruteraan Awam (SEPKA), Universiti Teknologi Malaysia, 5-6 July.
Kramer S.L., 1996, Geotechnical Earthquake Engineering. New Jersey: Prentice Hall.
McCaffrey, R., 1991, Slip Vectors and Stretching of The Sumatran Fore Arc, Geology, v. 19, p. 881-884.
McGuire R. K. 2004, Seismic Hazard and Risk
Analysis. Earthquake Engineering Research
Institute MNO-10.
Newcomb, K.R., and McCann, W.R., 1987, Seismic History and Seismotectonics of the Sunda arc: Journal of Geophysical Research, v. 92, p. 421-439.
Nicolaou, A.S., 1998, A GIS Platform for Earthquake Risk Analysis. A Dissertation Submitted to the Faculty of the Graduate School of State University of New York at Buffalo USA in Partial Fulfillment of the Requirement for the Degree of Doctor of Philosophy, August.
Petersen M.D., et.al., 2004, Probabilistic Seismic Hazard Analysis for Sumatra, Indonesia and Across the Southern Malaysian Peninsula. Elsevier.
Petersen M.D., et.al., 2008, Probabilistic Seismic Hazard for Sooutheast Assia. International Conference of Earthquake Engineering and Disaster Mitigation, Jakarta, April 14, 15.
Prawirodirdjo, L., Bock, Y., Genrich, J.F., Puntodewo SSO, Rais, J., Subarya, C., Sutisna, S.. 2000, One Century of Tectonic Deformation Along the Sumatran Fault From Triangulation and Global Positioning System surveys. Journal of Geophysical Research; 105:28343–28361.
Sadigh K., Chang C.Y., Egan J.A., Makdisi F., Young R.R., 1997, Attenuation Relationships for Shallow Crustal Earthquake Based on California Strong Motion Data, Seismological Research Letters, Volume 68 Januari/Pebruary, Seismological Society of America
Sieh, K., Natawidjaja, D., 2000, Neotectonics of the Sumatran fault, Indonesia. J. Geophys. Res. 105, 28295–28326.
Silva, W., et al., 2005, US. Nuclear Regulatory Commission Report.
Somerville, P., Collins, N., Abrahamson, N., Graves, R. and Saikia, E., 2001, Ground Motion Attenuation Relations for the Central and Eastern United States, Final Report to U.S. Geological Survey.
Tavakoli, B., and Pezeshk, S., 2005, Empirical-Stochastic Ground-Motion Prediction for Eastern North America. Bulletin of the Seismological Society of America, v. 95, p. 2283-2296.
Toro, G., et al., 2005, U.S. Nuclear Regulatory Commission Report.
Wells, D.L., Coppersmith, K.J., 1994, New Empirical Relationships Among Magnitude, Rupture Length, Rupture Width, Rupture Area, and Surface Displacement. Bull. Seismol. Soc. Am. 84, 974–1002.
Youngs, R.R. and Coppersmith, K.J., 1985, Implications of Fault Slip Rates and Earthquake Recurrence Models to Probabilistic Seismic Hazard Estimates, Bulletin of the Seismological Society of America, Vol. 75, No. 4, pp. 939-964
Youngs, R.R., Chiou, S.J, Silva W.J., 1997, Strong Ground Motion Attenuation Relationships for Subduction Zone Earthquakes, Seismological Research Letters, Volume 68 Januari/Pebruary, Seismological Society of America
Zachariasen, J., Sieh, K., Taylor, F.W., Edwards, R.L., Hantoro, W.S., 1999, Submergence and Uplift Associated with the Giant 1833 Sumatran Subduction Earthquake: Evidence from Coral Microatolls. J. Geophys. Res. 104, 895– 919.
F
ig
u
re 3. Con
to
u
r map
s
o
f
mag
n
itu
d
e
fo
r 10
%
p
ro
b
a
b
ility
o
f ex
ceed
a
n
ce in
50 y
e
ar
Figure 4. Cont
our maps of distance for
10%
probability
of exceedance in 50 y
e