Research Journal of Pharmaceutical, Biological and Chemical
Sciences
Design of Photovoltaic Cell with Copper Oxide Electrode by Using Indoor
Lights.
Rahadian Zainul*
1, Admin Alif
2, Hermansyah Aziz
3, Syukri Arief
4,
Syukri Dradjad
5, and Edison Munaf
6.
1
Department of Chemistry, Faculty of Mathematics and Natural Sciences, Padang State University, Padang 25163, Indonesia.
2-6
Department of Chemistry, Faculty of Mathematics and Natural Sciences, Andalas University, Padang 25163, Indonesia.
ABSTRACT
This research aims to develop PV cell which utilizes natural and artificial incident light comming into indoors. This breakthrough is done to take advantage of the energy wasted from the low lighting in the room. PV cell of indoor lights is developed by modifying the electrode copper-oxide with some design reactor for PV cells to get the best performance. Optimum performance is obtained with a Vmax 0,988 V and the current (I) maximum 0.635 mA. The measurement results show that cells of Cu2O/Al electrode pair better than the cell
uses electrodes Cu2O/Cu, comparison with the efficiency of 122: 1 in indoor lights and 307: 1 in neon lights.
Keywords :Photovoltaic Cell, Copper oxide, Reactor Design, Indoor Lights
INTRODUCTION
In recent years, most of the energy comes from fossil fuels that can cause many problems(1; 2). Among others; First, the air pollution as a result of burning coal and oil that produces carbon dioxide (CO2). Second, the limited availability and can’t renewable. Third, the distribution of the number of countries making the cost of relocation and distribution to is swelling and very expensive(3; 4). Therefore, the necessary research for new energy sources, which are friendly to the environment (ecological), cheap (economical), sustainable for availability and abundant in nature.(5-9)
Solar energy is a clean and abundant energy. Total solar energy that bathes the entire surface of the Earth every year around 3 x 1024 J, or about 10,000 times that of the total world energy consumption per year (4, 10). The density of its power 1 kWm-2 during sunny days, and the power of solar energy globally approximately 160,000 TW(11). The availability of a large potential for renewable and sustainable energy sources.
During this time, the utilization of the light coming into the room felt very less. This is of concern to us for a cell that is designed to take advantage of the lights, using the technology of photovoltaic cells. The purpose of this research is the PV cell is designed to be able to work on the sunlight coming into the room (indoor lights) and also the lightsemanatingfrom a lights source fluorescent bulbs.
METHODS AND MATERIALS
Tools and materials
Tools and materials used in this research is a Multimeter (Heles), Lightmeter, SEM-EDX (Hitachi S-3400N), XRD (PANalytical pw30/40), fluorescent lamps (Philip 10 Watts), paper (separator), carbon paper, Furnace, Analytic Tools, and Scales tools glasses. The materials used in this research is the glass, glue the glass, Plate of Cu and Al, sodium sulfate (Na2SO4) (Merck), gelatin powder, chloroform (Merck) and aquades.
Experimental Method
Manufacture of electrodes the electrode Cu2O
Cu2O is made with a plate of Cu on calcination temperature variation of 300, 350, 400, 450 and 500 o
C, for 1 hour. Result of a plate of Cu2O characterized using XRD and SEM-EDX.
The manufacture of PV cells
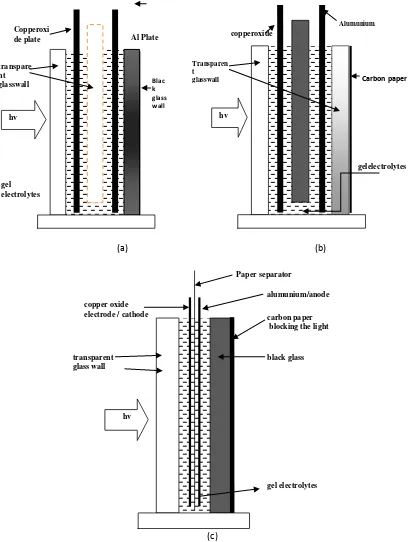
Photovoltaic cells are designed with the variation of the distance and type of electrode used. Cathode (Cu2O) and anode (Cu, Al) is limited by the glass (3 mm thick) and a 6 mm, to design 1 and 2. On the design of glass outer wall, 1 at the anode used glass black, whereas in design 2 used carbon paper. In design 3, the cathode and anode are only limited by paper 0.32mm thick membrane and the outer glass anode is limited by carbon paper.
PV cells are made with three designs like the Fig. 1.
Sodium Sulfat (Na2SO4) gel electrolyte solution preparation
A total of 14,206 grams of Na2SO4 dissolved in 400 mL of water and added that as many as 2 grams of
powder. The mixture was stirred and heated to boiling until the solution becomes clear.After that, add a few drops of chloroform. In hot conditions the electrolyte solution is poured into the PV cell.
Current and voltage PV Cell measurements
(a) (b)
(c)
Figure 1: Schematic design for the design of PV cells 1 (a), the design of 2 (b) and design 3 (c)
RESULTS AND DISCUSSION
SEM EDX analysis
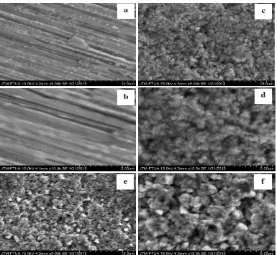
From Fig. 2, it appears there is a change on the surface of the Cu plate before and after calcination. From EDX analysis indicated in Table 1, note an increase in the amount of oxygen on the surface of the Cu plate originally 1.22 percent. In the calcination temperature of 400oC obtained for 16.5 percent oxygen. At 500oC, percent oxygen on the surface of the Cu plate by 15.27 percent. This result indicate that Cu plate after calcination at 400oC has more CuO at the surface compare with Cu plate after calcination at 500 oC.
Figure 2: SEM images of the surface of the copper plate before being calcinated (a) 5000x, (b) 10000x And after calcinating at a temperature of 400oC (c) 5000x, (d) 10000x and calcinating at a temperature of 500oC (e) 5000x and
(f) 10000x
Table 1: Results of EDX copper plates before calcination and after calcination at temperatures of 400 ° C and 500 ° C
Element
Weight percent Calcination
Without 400oC 500oC Carbon 10.46667 10.45 6.7 Oxygen 1.226667 16.34 15.27667 Copper 88.31 73.20667 78.02333
XRD analysis
From Fig. 3.seen the peak of the curve is formed which indicates the formation of copper oxide compounds. From Table 2, it is known that a compound formed by 26.7 percentCuO and Cu2O at 73.3
percent.From this result was obtained, there two kind of copper oxide was formed, CuO and Cu2O. This two
compund was formed because under temperature 1000oC will form mixture of CuO and Cu2O, while Cu2O was
formed first and followed by CuO.(12)
Table 2: Results of XRD copper plates after calcinatingat a temperature of 400°C
Formula Percent Compound CuO 26.7% Copper Oxide Cu2O 73.3% Copper Oxide
Current and Voltage Measurement results PV Cells
Current and voltage with temperature variations calcinations
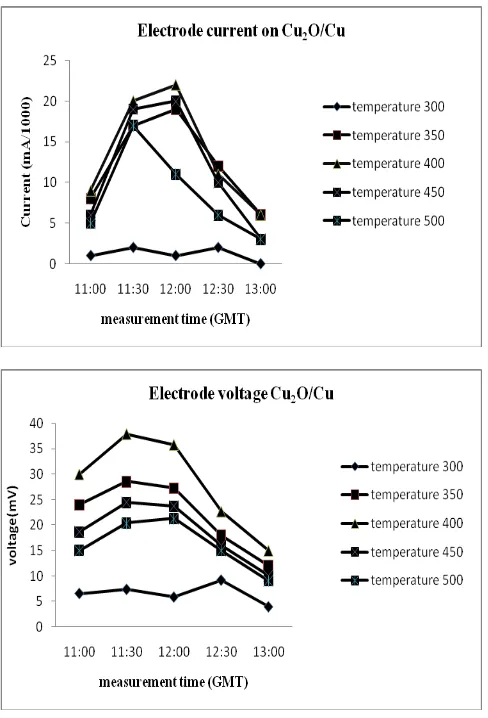
From the results of current and voltage measurements with calcinationtemperature variations was obtained optimum conditions at temperature 400oC.This result also obtained by Sears in preparation Cu2O via
thermal treatment. He said Higher temperatures produced too thick or too non-uniform a layer, whereas lower temperature oxide layers were too thin.(13)At temperature 400oC, the PV cell electrode pair Cu2O/Cu
provide daily average currentat indoor lights is13.6 μAand voltage of 28.28 mV. Power output reached 116μWatt/m2
.
Figure 4: Graph current and voltage of the PV cell electrode pair Cu2O/Cu at the calcinations temperature variations
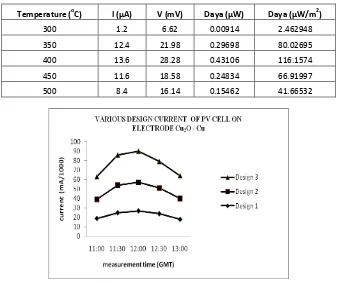
Current and voltage with a variation of PV cell design
From the results of current and voltage measurements with various designs of PV cells was obtained optimum conditions in the PV Cells Design 3. In the design of PV cells 3, the pair of electrodes Cu2O/Cu provide
cell, this result also obtained by Chang, in his experiment was found that electrode distances can enhance the short-circuit current density (Jsc) and thereby conversion efficiency.(14)
Current and voltage PV cells with an electrode pair Cu2O/Cu and Cu2O/Al
From the results of current and voltage measurements with the PV Cells electrode pair Cu2O/Cu
produced a daily average current of 28.2μA and 36.5 mV voltage at indoor lights, and with electrode pair Cu2O/Al is 600 μA and 635 mV . In the PV cell electrode pair Cu2O/Cuunder indoorlights irradiation, generated
daily averages current35 μA and voltage 36 mV, with electrode pair Cu2O/Al generated daily averages current
318.3 μAdan 438.7 mV. Power output of PV cell electrode pair Cu2O/Cu reached 0.28 mWatt/m2 under indoor lights and 0.34 mWatt/m2 under neon lights, and power output of Cu2O/Al reached 50.6 mWatt/m
2
at indoor lights and 41.6mWatt/m2 for neonlights. This result because Cu2Ois a natural semiconductor type P. If we use
Cu2O/Cu, Cu will accelerated recombination hole and electron because Cu has positive reduction potential, it
contrast with Al with negative reduction potential.(15)
Circuit of PV cells in series and parallel
From the results of current and voltage measurements under irradiation sun lights which enter to the room, on the circuit of several PV Cells electrode pairs Cu2O/Al produced a daily average currentis 482 μA and
voltage is 1575 mV for 3 series arrangement of cells.At 5 and 7 series arrangement each cell produced current 400 μA, 431 μA, and the voltage of each cell is 2340 mV, 3580 mV. In the parallel arrangement of the PV cell 10 electrode pairs Cu2O/Al produced current 2330 uA current and voltage 580 mV. At 7 series arrangement of PV
cells, obtained a power of 415.7855 mWatt/m2.
Table 3: The results of the current and voltage measurement electrodes daily average Cu2O / Cu at the calcination temperature variations
Temperature (oC) I (μA) V (mV) Daya (μW) Daya (μW/m2)
Figure 5: Graph of current and voltage of the electrode pair Cu2O/Cu at various PV cell design.
Table 4: The results of the current and voltage measurement electrodes daily average Cu2O/Cu in various designs PV Cells
PV Design I (μA) V (mV) Daya
(μW)
Daya
(μW/m2)
1 22.6 30.02 0.678452 182.8218809 2 25.6 31.16 0.797696 214.9544597 3 28.2 36.5 1.0293 277.3645918
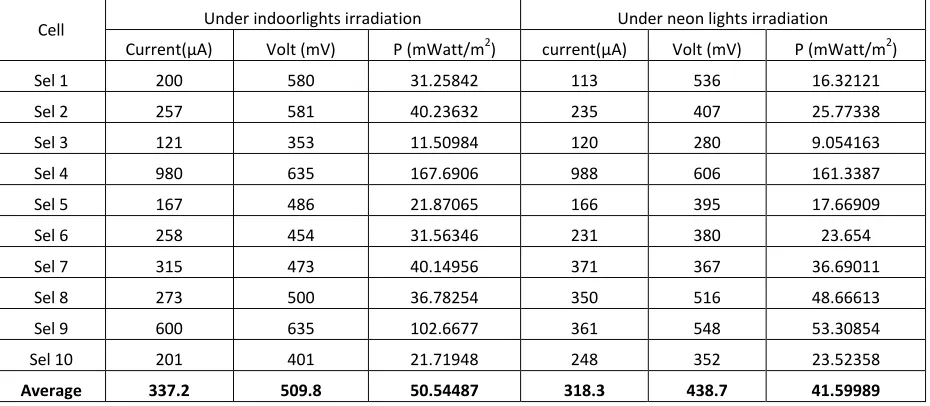
Table 5: The results of the current and voltage measurement electrodes daily average Cu2O/Al on the lights source used
Cell Under indoorlights irradiation Under neon lights irradiation
Current(μA) Volt (mV) P (mWatt/m2) current(μA) Volt (mV) P (mWatt/m2) Sel 1 200 580 31.25842 113 536 16.32121 Sel 2 257 581 40.23632 235 407 25.77338 Sel 3 121 353 11.50984 120 280 9.054163 Sel 4 980 635 167.6906 988 606 161.3387 Sel 5 167 486 21.87065 166 395 17.66909 Sel 6 258 454 31.56346 231 380 23.654 Sel 7 315 473 40.14956 371 367 36.69011 Sel 8 273 500 36.78254 350 516 48.66613 Sel 9 600 635 102.6677 361 548 53.30854 Sel 10 201 401 21.71948 248 352 23.52358
Average 337.2 509.8 50.54487 318.3 438.7 41.59989
Table 6: Results Measurement of current and voltage in series and parallel from multiple cell electrode pairs Cu2O/Al.
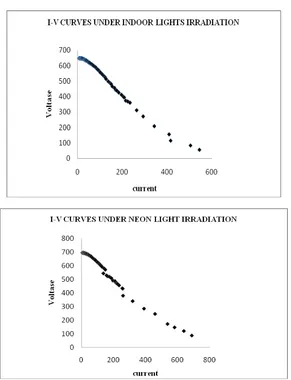
Figure 6: Current and voltage curves of the electrode pair Cu2O/Al under indoor lights irradiation and neonlights irradiation
Table 7: I-V Characteristic Curve; Open circuit currents (IOC), the open circuit voltage (Voc), Maximum Flow (I max), maximum voltage (V max), Value Fill Factor (FF) and efficiency of PV Cells ()
under indoor lights irradiation on Cu2O/Al
I oc V oc I max V max FF (%)
337.2 509.8 690 694 2.785615 0.752 under neon lights irradiation on Cu2O/Al
I oc V oc I max V max FF (%)
318.3 438.7 545 647 2.525204 1.3 under indoorlights irradiation on Cu2O/Cu
I oc V oc I max V max FF (%)
20.2 28.55 46 36 2.871461 0.00618
under neon lights irradiation on Cu2O/Cu
I oc V oc I max V max FF (%)
I-V measurement
Table 7 shown the efficiency of PV cell with electrodes Cu2O/Al under irradiation neon lights was
bigger than under irradiation sun lights which enter into the room, this occur because intensity of neon lights is bigger than sun lights which enter into the room.
CONCLUSION
From result of this research can concluded was PV cell with design number 3 is the best design. PV cell with electrode Cu2O/Al was given the best performance compare with PV cell with electrodes Cu2O/Cu. Maximum voltage of PV cell with electrode Cu2O/Al was generated is 0.988 mV and maximum current is 0.635
mA and efficiency 1.3 % under neon lights and 0.752 % under indoor lights.
REFERENCES
[1] Pang SH, Frey HC, Rasdorf WJ. 2009. Environmental science & technology 43:6398-405 [2] Stephenson AL, Dupree P, Scott SA, Dennis JS. 2010. Bioresource technology 101:9612-23
[3] Edwards PP, Kuznetsov VL, David WI. 2007. Series A, Mathematical, physical, and engineering sciences 365:1043-56
[4] Zuttel A, Remhof A, Borgschulte A, Friedrichs O. 2010. Series A, Mathematical, physical, and engineering sciences 368:3329-42
[5] Mudimu O, Rybalka N, Bauersachs T, Born J, Friedl T, Schulz R. 2014. Metabolites 4:373-93 [6] Mills N, Pearce P, Farrow J, Thorpe RB, Kirkby NF. 2014. Waste management 34:185-95 [7] Irimia-Vladu M. 2014. Chemical Society reviews 43:588-610
[8] Haber W. 2007. Environmental science and pollution research international 14:359-65
[9] Aresta M, Dibenedetto A, Angelini A. 2013. Series A, Mathematical, physical, and engineering sciences 371:20120111
[10] Parlevliet D, Moheimani NR. 2014. Efficient conversion of solar energy to biomass and electricity. Aquatic biosystems 10:4
[11] Swierk JR, Mallouk TE. 2013. Chemical Society reviews 42:2357-87
[12] Musa. AO, Akomolafe T, Carter MJ. 1998. Solar Energy Materials and Solar Cells 51:305—16 [13] W.M. Sears, Fortin E. 1984. Solar Energy Materials 10 93-103
[14] Ping-Kuan Chang, Ting-Wei Kuo, Mau-Phon Houng, Chun-Hsiung Lu, Yeh C-H. 2012. IEEE journal 978-1-4577-1829