ANALYSIS FOR SELF-SUFFICIENCY OF RICE IN INDONESIA: FORECAST OF ITS PRODUCTION AND CONSUMPTION
AGUS HUDOYO, DWI HARYONO AND INDAH NURMAYASARI
(Department of Agribusiness, College of Agriculture, University of Lampung)
Email:agus.hudoyo@gmail.com
ABSTRACT
While there are different opinions whether or not Indonesia should be self-sufficient in rice,
the data for analyzing its production and consumption are not reliable according to some
experts. This paper, therefore, attempts to forecast the possibility of self-sufficiency in rice
for Indonesia. The empirical models of the production and the consumption are econometric
models. By using the FAO’s data in the period 1961-2014, the result revealed that Indonesia
will be self-sufficient in 2028 and after.
Keywords:Rice, Production, Consumption, Self-sufficiency
INTRODUCTION
Indonesia has been a rice importer since 1900 (Rosnerand McCulloch, 2008, for the
data in the period 1900-2000; FAO, 2016, for the period 1961-2013; and BPS-Statistic
Indonesia, 2016, for the period 2014-2015).Indeed, in the period 1985-1990 after Indonesia
was a self-sufficient in 1984, the quantity of rice imported had been very low, i.e. 0.03-0.05
million tons for certain purposes.Since 1991, Indonesia has been back as a big rice importer
country.
The Indonesia Government has been trying to get back as a self-sufficient in rice.
However, according to Simatupang and Timmer (2008), based on the experience of reaching
self- sufficiency in 1984, itwas very costly. In this regard, McCulloch and Timmer (2008)
suggested that Indonesia should engage more fully in the world rice market to fulfill the
Indonesian demand of rice.
Whether Indonesia will be self-sufficient in rice is a big question.To answer this
question, we need to forecast the production and the consumption of rice and then compare
production are overestimated and the data of consumption are underestimated (Rosnerand
McCulloch, 2008; and Arifin, 2015). In this circumstances, this paper attempts to analyze the
possibility of Indonesia be self-sufficient in rice.
METHOD
The empirical models can be seen in Equation (1) for the rice production and Equation (2) for
the rice consumption.
Prodt = bo+ b1AHt+ b2Seedt+ b3Yeart+ e1t (1)
Const= co + c1GDPt,+ c2Popt + e2t (2)
Where:
t : For production, t: 1961. 1962, …, 2014;
For consumption t: 1970, 1971, …, 2013
Prod : Rice production (million tons of paddy)
AH : Rice Area Harvested (million hectares)
Seed : Seed planted for rice (million tons)
Year : 1961=1, 1962=2, …, 2014=54
Cons : Rice consumption (million tons, paddy equivalent)
GDP : Indonesia Gross Domestic Product ($US billion, 2005 price)
Pop : Population (million people)
bandc : Parameter estimates
e : Error term
The source of all data is the FAO’s website: http://faostat3.fao.org/home/E. Those two
empirical models are firstly analyzed by using Ordinary Least Square (OLS). Since the data
are time series, the OLS results should be evaluated for the existence of autocorrelation
(Greene, 2000). If there is autocorrelation, then we use Feasible Generalized Least Square
(FGLS) in order to get the efficient standard error.
RESULTS AND DISCUSSION
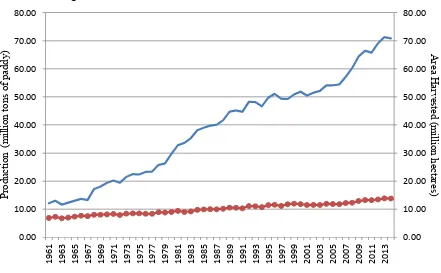
For analyzing the rice production, the data are from 1961 to 2014. The rice production
and the area harvested data are depicted in Figure 1. It reveals that the rice production has
been increasing affected more by the increasing of yield than by the additional harvested
area. Moreover, there were two periods when the yields of rice drastically increased, i.e. the
1981-1989 due to the green revolution and the 2008-2014 due to the agricultural
revitalization.
The average yield of rice in 2014 is 5.13 ton/ha. It may be too high because of the
Indonesian Agency for Agricultural Research and Development (IAARD), 2016, the potential
median yield of the rice is 8.85 ton/ha.
The result of the estimation for the rice production model can be seen in Table 1. It
shows that the production forecast model resulted by FGLS is the best model since it is not
only the best linear unbiased estimator (BLUE) of the coefficients, but also it has the efficient
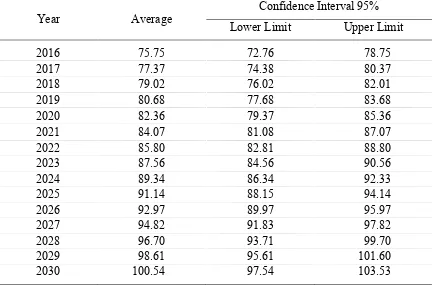
standard error. Therefore, it is used for forecasting the rice production (Table 2). In this table,
there are three values for each forecast year, i.e. average, lower limit and upper limit of the
95% confidence interval. We used the lower limit for the rice production projection.
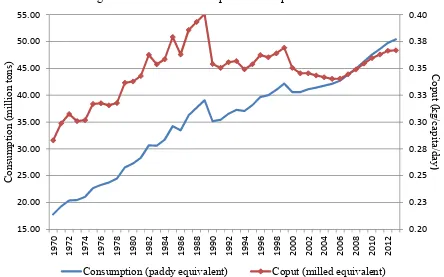
For analyzing the rice consumption, we use the data from 1970 to 2013. The rice
consumption data and its calculated coput (consumption per capita) are depicted in Figure 2.
It shows that the rice coput almost has the same trend with the rice consumption in the period
1970-2013. Only in the period 2002-2005, the coput had been declining, while the rice
consumption had been increasing.
The calculated coput in 2013 is 134 kg/capita/year. Based on the National Economic
Survey, it is 85 kg/capita/year, while according to OECD/FAO (2015), the average of
Indonesian rice coput in the 2010-2014 is 163 kg/capita/year.
The result of the estimation for the rice consumption forecast model can be seen in
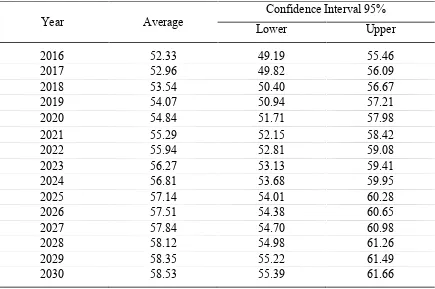
Table 3. The model resulted by FGLS is BLUE and has efficient standard error. Based on this
estimated consumption model, the forecast for the rice consumption is calculated and
revealed in Table 4. We used the upper limit of the 95% confidence interval for the projection
of the rice consumption.
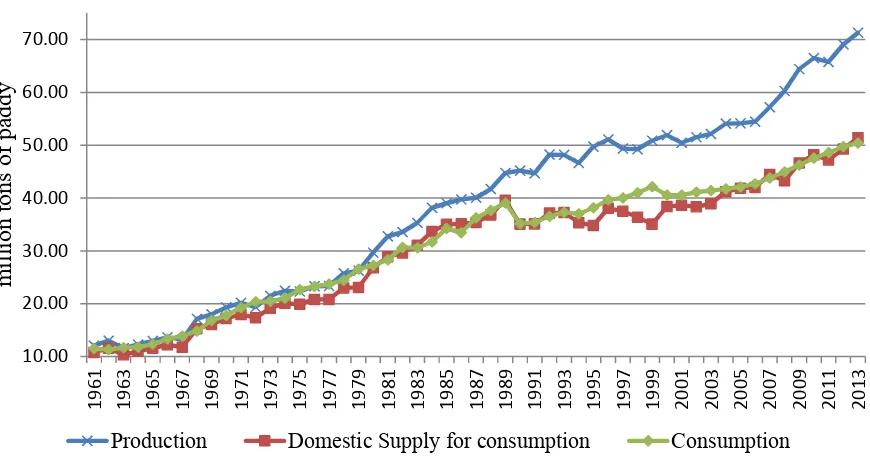
The domestic production of rice is used for consumption, feed, seed, processing and
others. Some rice is waste before reach the end user, such as consumers. The domestic supply
for rice consumption (DS) is the rice production minus others (seed, feed, processing, other
uses, and waste). If the DS equals to the consumption of rice, Indonesia is self-sufficient in
rice. The DS data in the period 1961-2013 are revealed in Figure 3. It shows that there were
13 years when Indonesia self-sufficient in rice, i.e. 1962, 1968, 1981, 1983, 1984, 1985,
1986, 1989, 1992, 2007, 2009, 2010, and 2013. Since the self-sufficient happened for several
years in the period 1983-1986, we say the 1984 is the year when Indonesia achieving
self-sufficiency in rice.
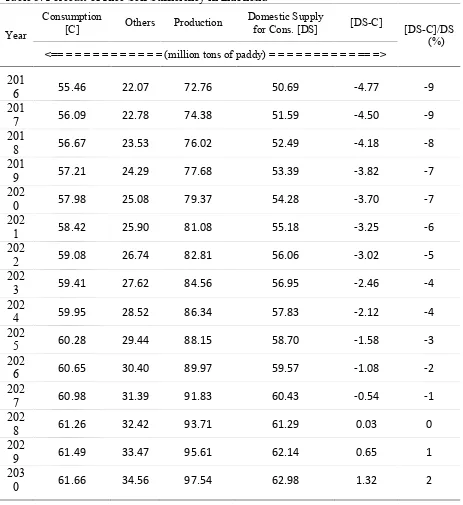
After forecasting the rice production and consumption, then we use them for predicting
the 95% confidence interval. Conversely, we use the upper limit for the rice consumption
forecast. This means our prediction will be in the 5% level of significant. The forecast of the
rice self-sufficiency in Indonesia can be seen in Table 8. This table reveals that Indonesia will
be rice self-sufficient in 2028 and after.
REFERENCES
Arifin, Bustanul. 2015. The Problem of The 1.5 Million Ton Rice Import (Soal Impor Beras 1,5Juta Ton). Kompas, 3 October, 2015.
BPS-Statistics Indonesia.2016. Foreign Trade Statistics 2015, Import, Volume II. Jakarta.
FAO.2016. http://faostat3.fao.org/home/E.
Greene, W.H. 2000.Econometric Analysis.Fourth Edition.Prentice Hall, Upper Saddle River, New Jersey.
Indonesian Agency for Agricultural Research and Development (IAARD).2016. http://en.litbang.pertanian.go.id/research/400/Food-Crops.
McCulloch, Neil andTimmer, C. Peter.2008. Rice Policy in Indonesia: A Special Issue. Bulletin of Indonesian Economic Studies, Vol. 44, No. 1: 33-44, 2008.
OECD/FAO.2015. OECD-FAO Agricultural Outlook, OECD Agriculture statistics (database). doi: dx.doi.org/10.1787/agr-outl-data-en.
Rosner, L. Peter and McCulloch, Neil.2008. A Note on Rice Production, Consumption and Import Data in Indonesia. Bulletin of Indonesian Economic Studies, Vol. 44, No. 1: 81–91, 2008.
Table 1. The Estimated Forecast Model for Rice Production
Independent OLS FGLS
Variables Coefficients t-value Coefficients t-value
Intercept -24.00* -4.38 -27.31* -4.72
Area Harvested 4.03* 4.55 4.30* 4.62
Seed 30.01* 4.02 37.90* 4.98
Year 0.40* 3.98 0.31* 2.94
F value 1,891* 2,241*
R Square (R2) 0.9913 0.9928
Adj. R2 0.9907 0.9923
Standard Error 1.7174 1.4910
Observations 54 53
Durbin Watson 0.644 2.326
*: Statistically significant at the 1% level Note:
Dependent variable: Rice Production (million tons)
Independent variables: Area Harvested (million hectares); Seed (million tons); and Year (1961=1, 1962=2, …, 2014=54)
Table 2. The Forecast of Rice Production in Indonesia (million tons)
Table 3. The Estimated Forecast Model for Rice Consumption
Independent OLS FGLS
Variables Coefficients t-value Coefficients t-value
Intercept -11.74* -3.75 -12.27* -3.90
GDP -0.02** -2.42 -0.02* -2.68
Population 0.28* -10.85 0.28* 10.98
F value 588* 615*
R Square (R2) 0.9663 0.9685
Adj. R2 0.9647 0.9669
Standard Error 1.6944 1.5515
Observations 44 43
Durbin Watson 0.414 2.142
*: Statistically significant at the 1% level, and ** at the 5% level Note:
Dependent variable: Rice Consumption (million tons of paddy equivalent)
Independent variables: GDP (billion US$, 2005 price); and Population (million people)
Table 4. Forecast of Rice Consumption in Indonesia (million tons, paddy)
Table 5. Forecast of Rice Self Sufficiency in Indonesia
Year
Consumption
[C] Others Production
Domestic Supply
for Cons. [DS] [DS-C] [DS-C]/DS (%) <== = = = = = = = = = = = (million tons of paddy) = = = = = = = = = = == =>
201
6 55.46 22.07 72.76 50.69 -4.77 -9
201
7 56.09 22.78 74.38 51.59 -4.50 -9
201
8 56.67 23.53 76.02 52.49 -4.18 -8
201
9 57.21 24.29 77.68 53.39 -3.82 -7
202
0 57.98 25.08 79.37 54.28 -3.70 -7
202
1 58.42 25.90 81.08 55.18 -3.25 -6
202
2 59.08 26.74 82.81 56.06 -3.02 -5
202
3 59.41 27.62 84.56 56.95 -2.46 -4
202
4 59.95 28.52 86.34 57.83 -2.12 -4
202
5 60.28 29.44 88.15 58.70 -1.58 -3
202
6 60.65 30.40 89.97 59.57 -1.08 -2
202
7 60.98 31.39 91.83 60.43 -0.54 -1
202
8 61.26 32.42 93.71 61.29 0.03 0
202
9 61.49 33.47 95.61 62.14 0.65 1
203
0.00
Figure 1. The Production and Area Harvested of Rice in Indonesia
0.20
Figure 2. The Rice Consumption and Coput in Indonesia
10.00
Figure 3. The Rice Consumption, Production and Domestic Supply in Indonesia (paddy equivalent)